A Work Project, presented as part of the requirements for the Award of a Master’s Degree in Finance from the NOVA – School of Business and Economics
The impact that different accounting standards have on a company’s Financial Statements: a case study based on U.S. GAAP and IFRS on Amazon adjusted for IAS 38,
IFRS 16 and IFRS 9.
Carlos Miguel Mendonça Vicente (ID: 23757)
A Project carried out on the Master’s in Finance Program, under the supervision of: Filipa Castro
2 Executive Summary
This research tries to evaluate how differences between firms reporting under U.S. GAAP and IFRS can affect investor’s perceptions and financial disclosure to the public in general. Differences between the two reporting standards were analyzed, namely regarding the treatment of Research and Development Costs, Operating Leases and Financial Instruments. The study departed from the financial report of a selected firm, published in its annual report ended in December 31st, 2017. The measurement of the differences derived from a thorough study of the company’s Financial Statements and its notes, conducting the restatement process and measurement of the overall impacts from these restatements.
Thank you note:
To Professor Filipa Castro for the professional and critical guidance throughout the development of this project and to Francisca Neves, my EY’s professional advisor that walked me through the process with her expertise in Auditing and Accounting.
3 Table of Contents Executive Summary ... 2 Literature Review ... 4 Financial Accounting ... 4 Financial Reporting ... 4
International Financial Reporting Standards ... 5
United States General Accepted Accounting Principles ... 5
The convergence of the accounting standards – IFRS and U.S. GAAP ... 6
Methodology ... 7
Empirical analysis ... 8
Research and Development ... 8
Leases ... 12
Financial Instruments ... 18
Overall Impacts on the Financial Statements ... 21
Scenario Analysis ... 23
Ratio Analysis... 23
Conclusion ... 25
Attachment 1 – Amazon’s Consolidated Profit and Loss Statement ... 26
Attachment 2 – Amazon’s Consolidated Balance Sheet ... 27
Attachment 3 – Amazon’s Consolidated Statement of Cash Flows... 28
Attachment 4 – Amazon’s Consolidated Statement of Comprehensive Income ... 29
Attachment 5 – Amazon’s Consolidated Statement of Changes in Equity ... 30
Attachment 6 – Classification and Measurement for Financial Instruments (IFRS 9) ... 31
Attachment 7 – Overall Reclassifications from Research and Development Costs IAS 38 .... 32
Attachment 8 – Overall Reclassifications from Operating Leases IFRS 16 ... 33
Attachment 9 – Overall Reclassifications from Financial Instruments IFRS 9 ... 34
Attachment 10 – Overall Consolidated Reclassification of Accounts ... 35
Attachment 11 – Modified and Full Retrospective Approaches to accounting for IFRS 16 ... 36
Modified Retrospective Approach ... 36
Full Retrospective Approach ... 37
4 Literature Review
Financial Accounting
“The purpose of financial accounting is to provide accounting information about an enterprise's financial condition and operating result. The information provided by an accounting system is needed by decision makers.” (Anbing, 2005)
Every business across the world produces and conducts activities that can either enhance or downgrade the course of a firm’s financial position. These activities produce inflows and/or outflows of money or other type of transactions that need, by law, to be recorded in a set of documents produced by the accounting team and the management – financial statements. Financial statements are planned and executed following some specific criteria, depending on the geographical location of the firm itself, through a process called financial reporting - the process of recording, organizing and reporting the transactions resulting from business operations over a specified period, typically a year.
Financial Reporting
Financial Reporting is the compilation, treatment and documentation of financial information of companies to their respective shareholders. Different legislations lead national institutions to create their own accounting standards to pursue with the activity of financial reporting inside each individual state. To offer a clearer and transparent view on a company’s financial health to markets and investors, different economies started to apply the same financial reporting standards. The United States of America is still the most relevant country that did not follow the same harmonization behavior as the remaining, creating a disparity among reported financial information from different companies in different markets, or even same companies quoted in different markets. This financial information is latter presented in a company’s Annual Report, a document that informs stakeholder’s, media and others about the financial
5 health of a company.
International Financial Reporting Standards
Established as a non-profit organization, the IFRS foundation is the public interest entity responsible for producing, developing and publishing the official high quality, understandable, enforceable globally accepted financial reporting standards for 166 countries worldwide, as well as to aid in the promotion and to facilitate its adoption in the different regions. The IFRS foundation has as an authority and main body regulator the International Accounting Standards Board (IASB).
The IASB and the foundation itself provide to the companies the necessary tools to prepare and publish their financial statements. As a common entity followed by a variety of member states around the world, the similar accounting principles adopted by the different companies in different geographies allows for a more transparent and homogeneous way of providing information on the companies’ financial statements. Public entities are legally bound to do their publications in harmony with these standards.
United States General Accepted Accounting Principles
In the United States, one of the only countries adopting different accounting standards, unregulated accounting practices led the national government, after the stock market crash of 1929, to take responsibility and action to create rules on how to standardize the norms from which publicly traded companies, and other market players, should rely for reporting their financial results. The Securities and Exchange Commission (SEC) was given authority to set standards and later delegated these duties to the private sector, giving birth, in 1973, to the Financial Accounting Standards Board (FASB), the current regulator on financial reporting practices in the U.S., hence the creator of the General Accepted Accounting Principles (GAAP). Similarly to IFRS, U.S GAAP defines objectives and directives for proper reporting practices
6 on the American companies’ financial statements. Their basic objectives comprise the act of providing information that should be useful to potential investors and creditors who seek for investment opportunities and credit, helpful to make financial decisions, long-term actions and improve the practitioners’ financial performance. These principles are more rules-based oriented, reigned mainly by four assumptions (business entity, monetary unit, periodicity and going concern), four principles (historical cost principle, accrual basis accounting, matching principle and full disclosure) and five constraints (objectivity, material items reported, consistent financial principles and maintained throughout time).
The convergence of the accounting s tandards – IFRS and U.S. GAAP
“As a result of globalization processes, accounting standards concerning international financial reports and audits have assumed more and more importance.” (Ván, Hajnalka. “The
relationship between international accounting standards and environmental accounting”. Farkas, B. (ed) 2011: Studies in International Economics and Finance. JATEPress, Szeged, pp. 181–191.).
As stated by the author quoted above, since the beginning of the new millennium, globalization of processes such as commercial agreements, free movement of people either due to personal or professional needs, the extension of financial transactions, multinational corporations, development of the financial and economic world, triggered the urge to facilitate the market players with a significant amount of information on financial performance on possible investable companies worldwide, as well as to credit providers on possible clients. In fact, by 2015 the SEC had already planned switching accounting methods from GAAP to IFRS, which did not happen, at least not yet.
The question that one should point out is – What are, in fact, these main differences between the GAAP and the IFRS? How are these differences impacting a company’s financial health is
7 restatement occurs in the near future?
This thesis does not attempt to study every single difference between the IFRS and the U.S. GAAP and in their own respective applicable rules. Its intention is to give a brief notion of how accounting for the restatement of one reporting standard to the other will influence the overall results of a company and, hence, why should there be resistance in harmonizing the two standards and converging them into one that is single and global.
Methodology
The methodology to be used in the remaining of this work project is based on empirical analysis, going through the selection of a company that one thought it could fit the requirements necessary for the intended study – Amazon in this case – and going through its last submitted annual report (SEC’s 10-K report), analyze their consolidated financial statements as well as the notes to the financial statements published in the same document. After this selection, one should choose from which reporting standard to depart – Amazon reports its financial accounts under U.S. GAAP - and, taking into consideration the main differences that were selected, proceed with the exercise of making the restatement of the captions adjacent to the referred differences and get to the final result that one should expect under the opposite reporting standard – IFRS. At this point, based on investors’ preferences and from what the market seeks to evaluate a company, conclusions should be gathered to give a view on this topic, allied with the main variations found with the restatement exercise.
Among the various differences between the reporting rules from both standards, only a few are going to be chosen for the purpose of this analysis. The selection criteria will be based on the level of importance that these have on the company’s daily life and, applying a level of professional judgement, one will select the differences that could have the biggest material impact in the company’s results, if a reconciliation of the standards was to be made. As such,
8 and after analyzing the company’s Financial Statements presented in the SEC’s 10-K report, the selected differences to analyze were related to Research and Development Costs, Leases (adjusted to the IFRS’ new rule – IFRS 16 – to be implemented starting January 1st, 2019) and
Financial Instruments (adjusted to the IFRS’ new rule – IFRS 9 – which implementation started
back in January 1st, 2018).
Empirical analysis
The 2017’s annual report1 (SEC’s 10-K Report) for the period ended in December 31st, 2017
was the basis for the analysis described below. It is important to mention that the purpose of this analysis is to measure the overall impact of the differences between the two reporting standards described above, as if the company were to make the necessary adjustments in 2017, the last year of full reported results. Meaning, the values and analysis made throughout this paper are static for the financial year of 2017, and not for the remaining future or past of the firm (see attachments 1 to 5 with Amazon’s Financial Statements as of December 31st, 2017).
The entity is an e-commerce service provider, with sites spread all over the world achieving growth rates above the industry average. Being also a company that provides software optimization solutions for other companies and for the entity itself, Research and Development
(R&D) costs are expected to be significant in the company’s books.
Research and Development
Information given by the company related to these costs is present in the Annual Report, both in the Financial Statements and in their accompanying notes. As it is said in the report, research and development costs within the current activity of the firm are recorded through Technology
1For a better understanding of this academic research, it is advisable to go along the present report with the company’s financial statements found in:
9
and Content (T&C). Hence, for the purpose of the remaining paper, both terms can be used.
As the company reports and accounts for their financial results under U.S. GAAP, R&D costs are treated differently from the rules applied under IFRS.
Under U.S. GAAP, as defined in ASC 350, R&D costs are treated and accounted entirely as an expense through the Profit and Loss Statement, exactly in the moment that they are incurred. This will impact the profitability of the firm as 100% of these costs will decrease the Net Income level of the firm and, consequently, it will decrease the overall equity level as Results from the period after tax are transferred to the Statement of Financial Position (Balance Sheet) through Retained Earnings.
Under IFRS, the accounting treatment is slightly different. According to IAS 38, an intangible asset whether purchased or created internally is recognized as such if and only if:
• There is a probability that the future economic benefits coming from the asset will be attributed to the company;
• The cost of the asset can be measured reliably.
However, if the criteria for recognition is not met, IAS 38 requires the expenditure of this item as a full expense in the moment it is incurred. This means that, making the appropriate segregation of research costs and development costs, where the former never meet the criteria set by the IAS 38 since they are merely expenses incurred looking for information (researching) for a specific product that is intended to be developed either by the entity or by a client (if sold). On the other hand, development costs, typically meet the criteria imposed by the IAS 38, and therefore an intangible asset can be created and, consequently, capitalized over the service life of the asset, once the product is brought to market and the service life does not exceed 20 years. The accounting treatment is then set up as follows:
10 1. Direct expense for the research costs (Debit in the Expenses of the company in the P&L Account);
2. Calculation of the capitalizing amount of the Development costs (Development costs in the period / Years of service life of the Intangible Asset) and is accounted as an expense in the P&L Account for the period;
3. The net value of the Intangible is then an Asset in the company’s Balance Sheet as Deferred Development Costs.
Given the information given by the company in the available Annual Report (page 28), it is said that these costs “(…) include (…) research and development of new and existing products and
services, development, design, and maintenance of our websites, curation and display of products and services made available on our websites, and infrastructure costs.” Additionally,
in terms of numbers, one can see the total expensed amount relative to this caption in the company’s Profit and Loss Account (see attachment 1). Given the lack of more detailed information, in order to make the necessary adjustments to pursue with the reclassification of this caption, one should make certain assumptions that, aligned with the business model and specifications of the company so that it won’t deviate too much from the reality, would allow to get to all the required items to account for R&D costs under IFRS (and IAS 38). Thus, one assumed the following:
• Given the fact that one simply has available the total amount of Technology and Content in the company’s Profit and Loss Statement as of December 31st, 2017, it is strictly necessary
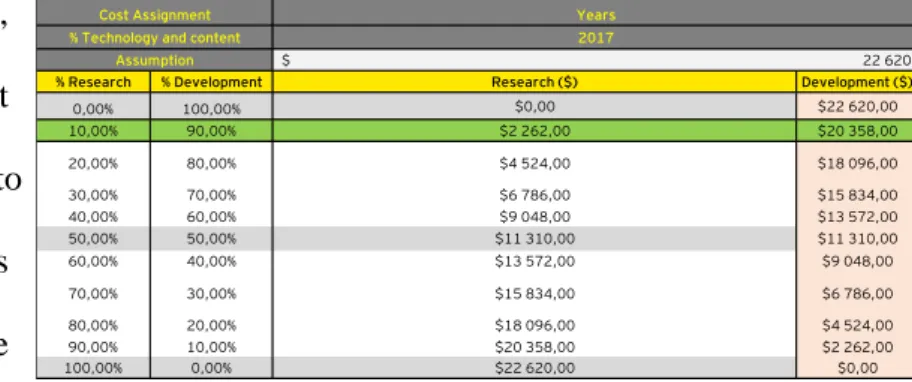
to calculate which part is related to Research costs and which to Development costs. For that, one applied a certain degree of professional judgment and conducted the work based on the hypothesis to have a better understanding on how the total cost for R&D (22.620 million $ in 2017) would vary among the percentages given to each part of the caption. Given the weights
11 chosen based on how, theoretically,
costly would the research component for the items in analysis relatively to the development component, it was assumed that the components are
assigned as 10% and 90% of the total, leading to a total
amount of 2.262 million $ for research and 20.358 million $ for development, respectively. • Next, it is important to set all the assumptions necessary for the capitalization of the
development costs from the period in question. As one goes through the Financial Statements
of the company, it is possible to find a component related to the Capitalization of Technology
and Content included in the consolidated statements as a component of Other Assets. Looking
over this set of data, it is possible to visualize that the costs related to intangibles have a total of accumulated amortization of 252 million $ and a net value of 388 million $ (gross value of 640 million $) with an average remaining life of 4.4 years. So, by simply dividing the total gross amount of the item for its amortized value up to date, one should get a good approximation of the number of years of accumulated amortization of the asset (2.5 years). Adding this value to the average number of remaining years to amortize (4.4 years), one should get to a total amount of 6.9 years which, for simplicity reasons, 7 was the final number of years to amortization chosen. Consequently, a
sensitivity analysis was performed to get the
appropriate value of the item net of
amortization, as well as its amortized value depending on the length of useful life. To note that the sensitivity analysis was only performed as if the maximum of years for the useful life of the item is 20 years, since under the IAS 38 an intangible asset can only be recognized as such and,
% Research % Development Research ($) Development ($)
0,00% 100,00% $0,00 $22 620,00 10,00% 90,00% $2 262,00 $20 358,00 20,00% 80,00% $4 524,00 $18 096,00 30,00% 70,00% $6 786,00 $15 834,00 40,00% 60,00% $9 048,00 $13 572,00 50,00% 50,00% $11 310,00 $11 310,00 60,00% 40,00% $13 572,00 $9 048,00 70,00% 30,00% $15 834,00 $6 786,00 80,00% 20,00% $18 096,00 $4 524,00 90,00% 10,00% $20 358,00 $2 262,00 100,00% 0,00% $22 620,00 $0,00 22 620 $ Years % Technology and content
Cost Assignment
2017 Assumption
This is saying that, by 2017, there are only 4,4 years left to amortize the remaining development costs If:
Acc. Amortization Acquired Intangibles (net) Life Remaining
-$252,00 $388,00 4,4
Means that:
> Total Value Asset $640,00
> Years Amortized 2,5
> Total Life Asset 6,9 7 (for simplicity)
EPage 39 of the Annual Report
2017 Tech & Content
Table 1 – Cost assignment for Research and Development
12 consequently, capitalized as long as its useful life is lower than 20 years (IAS 38).
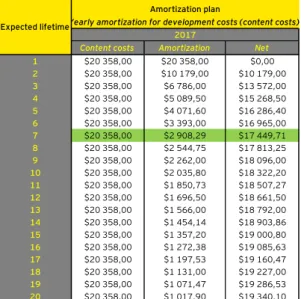
In summary, these assumptions will lead to a value of 2.262 million $ for directly expensed research
costs, 20.358 million $ for development costs from
which for 7 consecutive years of capitalization, in 2017 the total amount of net development costs registered through the Balance Sheet of the company are 17.449,71 million $ as deferred development costs and, consequently, 2.908,29 million $ of capitalization costs directly expensed in
the Profit and Loss Statement. Important to state that this scenario is expected to be the same throughout the remaining years of amortization, under the assumption that the level of research
and development costs (technology and content) are kept the same.
Leases
Operating lease is a subject that has been in the spotlight for quite a while. It is seen almost like a black hole for some companies given the possible consequences of the new IFRS 16 rule and what could be the impact in a company’s books. IFRS 16 is a rule that will have a mandatory implementation starting January 1st, 2019. It is said that “the imminent application of the new
leases standard will promote balance sheet transparency – with major consequences for many sectors” (Deller, A 2018, “IFRS 16 to give balance sheet transparency a boost”, ACCA
Accounting and Business Magazine, November 1st, 2018). In other words, until now companies could engage in various types of leasing contracts – operational leases – whose accounting treatment was only through profit and loss. But if one could think about the concept of these contracts, they are nothing more than a “loan”. Consequently, it was beneficial for companies
Amortization plan
Yearly amortization for development costs (content costs)
Content costs Amortization Net
1 $20 358,00 $20 358,00 $0,00 2 $20 358,00 $10 179,00 $10 179,00 3 $20 358,00 $6 786,00 $13 572,00 4 $20 358,00 $5 089,50 $15 268,50 5 $20 358,00 $4 071,60 $16 286,40 6 $20 358,00 $3 393,00 $16 965,00 7 $20 358,00 $2 908,29 $17 449,71 8 $20 358,00 $2 544,75 $17 813,25 9 $20 358,00 $2 262,00 $18 096,00 10 $20 358,00 $2 035,80 $18 322,20 11 $20 358,00 $1 850,73 $18 507,27 12 $20 358,00 $1 696,50 $18 661,50 13 $20 358,00 $1 566,00 $18 792,00 14 $20 358,00 $1 454,14 $18 903,86 15 $20 358,00 $1 357,20 $19 000,80 16 $20 358,00 $1 272,38 $19 085,63 17 $20 358,00 $1 197,53 $19 160,47 18 $20 358,00 $1 131,00 $19 227,00 19 $20 358,00 $1 071,47 $19 286,53 20 $20 358,00 $1 017,90 $19 340,10 Expected lifetime 2017
13 to enter into operating lease contracts to drive away investor’s attention and other credit facilities, that they were paying installments on lent material. Thus, intended to promote more transparency on the companies’ financial statements, the IFRS 16 was created.
Starting January 1st, 2019, IFRS 16 ("Leases") can start to be implemented by companies wishing to adopt at an early stage. This new rule simply changes the way operating leases are accounted in the company's financial statements, contradicting or complementing IAS 17. The previously existing IAS 17 states that a lease contract is only considered a finance lease contract if it satisfies just one of the following statements:
• The lease transfers ownership of the asset to the lessee by the end of the lease term; • The lessee has the option to buy the asset at a price which is expected to be sufficiently lower than the fair value of the asset at the exercisable date of the call option, which at inception is more likely to be exercised at maturity. By sufficiently lower, U.S. GAAP understands 75%, which the same can be assumed under IFRS;
• The lease term of the contract is for the major part of the economic life of the asset, even if the tittle is not transferred;
• At the inception of the lease, the PV of the minimum lease payments amounts to at least substantially all of the fair value of the leased asset (90% under U.S. GAAP - assume the same under IFRS);
• The leased assets are of specialized nature such that only the lessee can use them without major modifications being made.
There are other factors that one could take under consideration when assessing the nature of the lease contract:
• If the lessee is entitled to cancel the contract, the lessor's losses associated with the cancellation are bared by the lessee;
14 • Gains or losses from fluctuations in the fair value of the residual are for the lessee to bear (for example reimbursement of lease payments);
• The lessee can extend the leasing contract for an additional period at a price that is substantially lower than the market rent of the underlying asset.
By adopting IFRS 16, companies will no longer register a rental expense on their Profit and Loss Account. The effect of this contractual engagement is reflected at the company’s Balance Sheet giving rise to an Asset component called Right of Use Asset and, also a Liability registered by the Present Value of the Remaining Lease Payments, which will be reflected in the company’s leverage level and further ability to comply with its debt and interest payments. Companies that are obligated to adopt IFRS 16 can choose to do so at an early stage since the standard allows for early adoption. During the adoption process, this can be done in two ways2:
under the Modified Retrospective Approach and under the Full Retrospective Approach in which, the first method does not require reclassification and recast of comparative information and, consequently, prior accounting procedures for operating leases stay as they were accounted in the past. Contrarily, the latter method requires reclassification of prior accounting procedures in retained earnings for operating leases prior to the adoption of IFRS 16, which is costlier for the firm and more time and resource consuming.
The company under analysis reports under U.S. GAAP and, as such, their accounting treatment for operating leases simply require the recognition of a rental expense every period during the maturity of the underlying contract. Thus, these transactions only go through Profit and Loss and are not taken into consideration on the company’s Balance Sheet, violating the “transparency” value in financial reporting.
15 Amazon’s annual report states on page 60 and 61 that “In February 2016, the FASB issued an
ASU amending the accounting for leases. The new guidance requires the recognition of lease assets and liabilities for operating leases with terms of more than 12 months (…) The ASU is
effective for reporting periods beginning after December 15th, 2018, with early adoption
permitted. We plan to adopt this ASU beginning in Q1 2019.” With this statement one can
conclude for the option not to early adopt the new rules for lease accounting, and for simplicity reasons given the uncertainty of the commencement date for the adoption, one is assuming the adoption under the modified retrospective approach meaning that past year’s restatement is unnecessary for the purpose of this analysis.
Accounting for operational leases as IFRS 16 is adopted requires the existence of an asset in the lessee’s balance sheet and, consequently, a liability as a counterpart. The value for both in the beginning of the contract should be the same as it represents the present value of the remaining operating lease payments up to maturity. Every year, a transaction through profit and loss has to occur but differently from IAS 17’s rental expense. Now, under IFRS 16, the “rental expense” is split in two – a part for amortization and the remaining as interests over the value of the asset. Depreciation expenses have to be considered which, for this exercise, are accounted under the straight-line method over the useful life of the asset in the company’s adjusted balance sheet. In the periods following the commencement date of the contract, assuming the interest rate of the underlying contracts and the level of future operating lease payments (reimbursements), the constant level of depreciation of the asset will surpass the value of amortization each year until the asset is fully depreciated (assuming 10 years of useful life for the underlying). The interest rate used to discount the future operating lease payments is the same that the company uses to discount for the other types of leasing contracts – financial and
16 capital leases – with
a rate of 2,57% in 2017. Given the fact
that the only information regarding operating
lease payments for the year ended in December 31st, 2017 available in the company’s annual
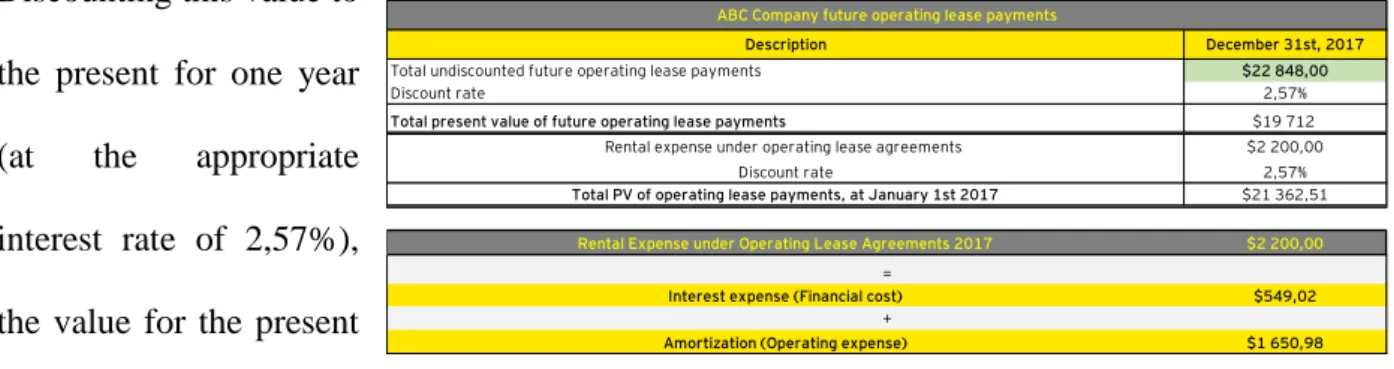
report is the rent expense in the profit and loss account, one conducted the restatement to adjust for IFRS 16 based on this amount which ascended to 2.200 million $. One simply applied the interest rate on top of the rental payment and got the amortization value of 1.650,98 million $ for the same year (2.200 million $ x 2,57%).
The company presents to the readers a summary of the future lease payments, undiscounted, as it is shown in the table below. Picking up from the value in the “Total” section of the table and discounting it at the appropriate period (until 2029 in this case – 13 years) one should get to the present value of future payments as of January 1st, 2017. The next step would be adding back the rental expense of 2.200 million $ and get a total value of 21.911,53 million $, representing the supposed present value of future rental operating lease payments as of December 31st, 2017.
Discounting this value to the present for one year (at the appropriate interest rate of 2,57%), the value for the present value as of January 1st, 2017.
In summary, with the adjustment to restate Operating Leases from U.S. GAAP for IFRS, especially for IFRS 16, one should take into consideration the following captions:
• On the Balance Sheet for the period in question, one should expect movements in the
Data from Annual Report page 69:
2018 2019 2020 2021 2022 Thereafter (until 2029) Total
$967,00 $2 234,00 $2 111,00 $1 834,00 $2 050,00 $31 799,00 $40 995,00 $6 084,00 $4 788,00 $2 590,00 $557,00 $262,00 $530,00 $14 811,00 $445,00 $460,00 $466,00 $476,00 $472,00 $3 946,00 $6 265,00 $2 427,00 $2 376,00 $2 258,00 $2 039,00 $1 813,00 $11 935,00 $22 848,00 $3 527,00 $3 561,00 $3 195,00 $3 039,00 $2 922,00 $7 956,00 $24 200,00 $1 584,00 $1 016,00 $733,00 $571,00 $438,00 $4 744,00 $9 086,00 $15 034,00 $14 435,00 $11 353,00 $8 516,00 $7 957,00 $60 910,00 $118 205,00 Other commitments Total commitments Principal Contractual Commitments
Year ended December 31st Debt principal and interest
Capital lease obligations, including interest Finance lease obligations, including interest
Operating leases
Unconditional purchase obligations
ABC Company future operating lease payments
Description December 31st, 2017
$22 848,00 2,57% $19 712
Rental expense under operating lease agreements $2 200,00
Total undiscounted future operating lease payments Discount rate
Total present value of future operating lease payments
Discount rate 2,57%
Total PV of operating lease payments, at January 1st 2017 $21 362,51
Amortization (Operating expense) $1 650,98
Rental Expense under Operating Lease Agreements 2017 $2 200,00
=
Interest expense (Financial cost) $549,02
+
Table 4 – Principle Contractual Commitments for Operating Leases
Table 5 – Total Present Value of Future Operating Lease Payments Table 6 – Decomposition of rental expense for Operating Leases (IFRS 16)
17 value for Total Assets due to a debit operation in the Right of Use Asset and a debit in the caption for Accumulated Depreciation (to note that this caption is counter-nature since it represents a reduction in the value of the asset and, for that reason it is a negative asset account), which will result in a total adjusted value for the company’s assets of 149.050,38 million $; • On the other side of the Balance Sheet, one should register the Present Value of the Remaining Capital Lease Payments as a Liability (for the same amount as the Right of Use Asset) and, at the same time, there is a yearly movement in this account when the reimbursement (amortization) is paid and the Lease Liability decreases, which will result in a total adjusted value for Debt of 60.974 million $;
• At the Profit and Loss level, one should expect a reduction in the Operating Expenses due to the reduction in the Lease Rental Expense since now, one should only account for the depreciation expense. Additionally, one accounts for lease related interest expenses. Hence, the overall impact in Net Income will be the difference between the amortization (now accounted for through Liabilities in the Balance Sheet) and depreciation expenses. On the other hand, indicators like EBIT will be higher than before, given the reduction in the operating expenses. This will have a total impact on an adjusted value for EBIT of 4.034,85 million $ and for Net Income of 3.480,90 million $;
• On the Cash Flow statement, one simply needs to adjust the following: given the regularity of the interest payments with the contraction of operating lease contracts, this aggregated outflow of cash will start to be considered as a part of the operating cashflow as it was already accounted for under U.S. GAAP. At the same time, amortization expenses of the underlying will start to be considered as financing cashflow instead of operating cashflow as it was under IAS 17 and under U.S. GAAP. The adjustments are both negative impacts of 549,02 million $ for interests on the Operating Cashflow and, also, 1.651 million $ for amortization expenses in the Financing Cashflow.
18
Financial Instruments
Financial instruments are assets that, by definition, can be traded, created, modified and settled between two or more contractual parties. The more usual forms of financial instruments are cash, bank deposits, shares, and/or bonds (there are also other types of financial assets such as marketable securities which represent a group of shares or bonds that are to be sold or redeemed within a year).
Since this asset class usually represents a material part of the companies’ assets, and given the fact that even though there are not too many differences between the way these are treated under U.S. GAAP (hence, on the company’s financial statements) and under IFRS back in 2017, with the release of the new IFRS 9 in January 1st, 2018, one thought it would be an interesting topic
to complement the analysis done so far in this paper.
Under U.S. GAAP, the classification and measurement depend largely on the legal form of the asset (either a loan or a security). At acquisition, debt instruments that meet the definition of a security are classified in one of the following three financial asset’s categories3:
1. Held to maturity (HTM) – measured at amortized cost (AC);
2. Held for trading (HFT) – measured at fair value, with changes in the fair value recognized through net income (FVNI);
3. Available for sale (AFS) – measured at fair value, with changes in the fair value recognized through other comprehensive income (FVOCI).
Under IFRS, it’s not about the legal form of the asset itself. Financial instruments under this reporting standard depend on two separate processes for classification and measurement. First,
3Unless fair value option is chosen by the company, financial assets such as loans and receivables are classified as either: held for investment (measured at
19 they depend on the contractual cashflow characteristics (CCF) and on the business model under which they are managed. The first process determines if the contractual terms of the underlying give rise on specific dates to cashflows that are only payments of principals and interests on the outstanding amount. Hence, the underlying assets that go along with the CCF test are measured at their AC, FVOCI or FVNI, unless the fair value is automatically chosen. Contrarily, assets that fail the CCF test are automatically measured at FVNI.
The IAS 39 was the rule applicable from 2005 to 2018 related to the accounting treatment for Financial Instruments. Due to its complexity and lack of transparency which lead to different interpretations, the IFRS Foundation launched the IFRS 9. The main differences that now exist with the application of the IFRS 9 are the following:
• Equity instruments such as stocks will always be measured at fair value, and the company can choose between registering any gain/loss through net income and other comprehensive income (without realizing any gains/losses in the profit and loss statement). Whenever there is a change in the fair value of the asset, the unrealized gain or loss is realized as the asset is sold. Here, if the company has chosen to measure the asset through net income, the realization of the gain or loss will impact net income. On the other hand, if the company has chosen to measure the asset through other comprehensive income, IFRS 9 prohibits the entity to realize the change in value over net income.
• Debt instruments (bonds and loans) - for the classification of debt instruments, one should go through the two-step process explained above.
At the end, the overall classification of the financial instruments is the same – Amortized Cost, FVNI and/or FVOCI – under the same assumptions and circumstances. Further notes on the exact valuation of the assets are explained in the notes to this paper (see attachment 6).
20 financial instruments the company presents in its books for the period in analysis. All available information leads to the conclusion that Amazon’s marketable securities, equity investments and excess cash are all classified and measured on a fair value basis through other comprehensive income, since the company categorizes them as assets available for sale. Under IFRS 9, standard investments in equities that are not intended to be hold to maturity neither managed with the intention to sell, should be measured at Fair Value through Net Income the (see attachment 6 for further comprehension of this classification), there has to be an adjustment that comprises the derecognition of the changes in fair value of the securities from Other Comprehensive Income and, consequently, recognize it through Net Income, together with the adjustments of Fair Value for the sold marketable securities for the period. From the Statement of Other Comprehensive Income one can see that recognitions on changes in Fair Value for these assets amounted to -39 million $, which should be canceled out in this statement and, further decrease the value for the Net Income of the company in the same amount.
Additionally, the company presents on the notes to the consolidated financial statements (see note 2 – Cash, Cash Equivalents, and Marketable Securities – annual report page 60), specifically the table that evaluates the “gross gains and losses realized on sales of available for sale marketable securities” as for the period ending in December 31st, 2017. If one makes the double check with the company’s financial
statements, one could find that the realized profits (losses) from these sales are accounted
through profit and loss, which under IFRS
9 is acceptable. Hence, the only reclassification one should pursue here is the restatement above mentioned. Consequently, the company’s net income decrease will have an impact at the Balance Sheet level for the same amount of reduction in Retained Earnings.
Table 7 – Gross unrealized changes in fair value in Marketable Securities
Description 2017
Unrealized profit (loss) from changes in FV -$39,00
Impact in NI -$39,00
Impact in OCI $39,00
21
Overall Impacts on the Financial Statements
The three main differences pointed above will lead to the restatement and recalculation of multiple captions that now will present adjusted values according to financial reporting under IFRS, specially taking into consideration the changes from U.S. GAAP to IAS 38, IFRS 16 and IFRS 9 (see attachments 7, 8, 9 and 10) Changes will be recorded in the following captions: • Income Before Taxes: the value presented in the unadjusted statement is 3.806 million $. However, it has to be accounted for the changes coming from not accounting for the total value of development costs in the P&L, hence it is added to the previous value of income before taxes arriving to a total adjusted value of 21.255,71 million $, due to the registration of deferred development costs amounting to the difference between the two (17.449,71 million $). Overall percentage change of +458,48%.
• Income Taxes: adjusted for the impacts coming from the increase in the income before taxes given the reduction in T&C and, also, coming from the reduction in the operational expense from the operating lease contracts. This will lead to an overall change amounting to -3.479,64 million $, going from -769 million $ to -4.248,64 million $. Overall percentage change of +452,49%.
• Net Income: this caption is affected by the changes from Income Before Taxes, Income Taxes and the reversal from the losses applied from the sale of Financial Instruments when they should have been accounted for through Other Comprehensive Income. Adjusted to approximations, this caption is expected to fluctuate from 3.033 million $ to 17.200,92 million $. Overall percentage change of +467,13%.
• Interest Expenses: this value changes with the additional interest expenses coming from the operational leases whose value is no longer a simple rental expense through operating expenses, but a mix of amortization and interest expenses at the interest rate of 2,57% over the value of the previous rental expense of 2.200 million $. This results in a negative impact of 549
22 million $ which is added to the previous interest expense in the profit and loss (-848 million $) and now one should expect (-1.397,02 million $). Overall percentage change of -264,74%. • Other Assets: this caption will be adjusted for the variation in Technology and Content, by the value of the deferral of the latter. This value amounts to 17.449,71 million $, which will be added to the previous unadjusted value of 8.897 million $ and one should get to an adjusted value for IAS 38 of 26.346,71 million $. Overall percentage change of +196,13%.
• Cash and Cash Equivalents: the unadjusted value for this amounts to 20.522 million $, however due to differences in taxes, the amount in this caption should decrease to 16.827,30 million $. Overall percentage change of -18%.
• Total Assets: adjustments coming from the registration of the Right of Use Asset under IFRS 16, the reduction in cash and cash equivalents for the period and, also, the increase in Deferred Assets for the “uncapitalized” development costs. This will lead to a total variation of 13.755,01 million $, going from the unadjusted value of 131.310 million $ to 162.805,39 million $. Overall percentage change of +23,99%.
• Equity: this value will solely fluctuate due the fluctuations in Net Income (explained above). Overall percentage change of +58,84%.
• Total Debt: here the variation comes from the Present Value of Future Lease Payments which amount to 19.712 million $, with the respective deduction of reimbursement for the period in question (-1.651 million $). The unadjusted value of 42.913 million $ will now be adjusted to 60.974 million $. Overall percentage change of +42,09%.
• Operational Cash: changes come from the variation in Cash and Cash Equivalents (explained above). Results go from unadjusted values of 18.434 million $ to adjusted of 16.827,30 million $. Overall percentage change of -8,72%.
• Operational Net Income: changes come from the variation in Net Income (explained above). Overall percentage change of +467,13%. Unadjusted values go from 3.033 million $ to
23 17.200,92 million $ adjusted.
• Other Comprehensive Income: increase in 39 million $ due to the derecognition of Financial Instrument’s changes in Fair. Overall percentage change of 1,10%.
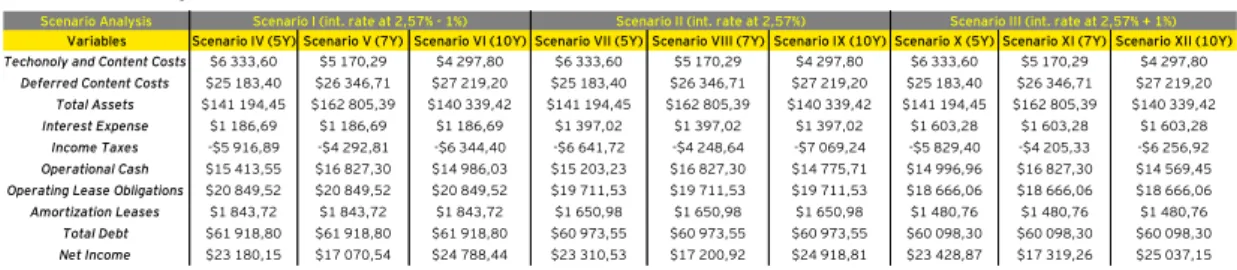
Scenario Analysis
A scenario analysis is being presented with interest rate for Leases and useful life of R&D costs varying. Results are somehow not in accordance with what is expected for this (even though some go along with one’s expectations) leaving as an open item, the analysis of the results presented above, since different opinions can be derived from this matter.
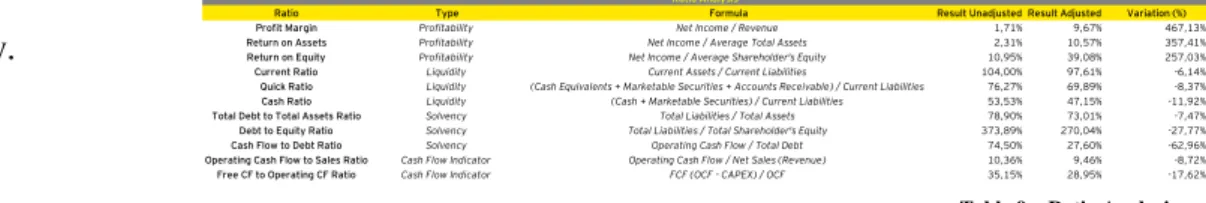
Ratio Analysis
Investors, when searching for profitable opportunities – either in the long-term or short-term – usually don’t look for the entire financial statements of companies. Instead, investors search for ratios given by trustworthy entities. These measures are mainly divided in 4 categories: Profitability ratios, Liquidity ratios, Solvency ratios and Valuation ratios.
For this academic research, one will select a sample of ratios that are most appropriate for the changes implied by the application of the International Standards. It is important to note that the interpretation of the results about to be presented is on the personal judgement and risk preferences of each investor. The explanations given are generalized for each of the ratio’s definition, which are presented under the attachment 12:
• Profit Margin - how likely it is that a company will turn a profit;
Scenario Analysis
Variables Scenario IV (5Y) Scenario V (7Y) Scenario VI (10Y) Scenario VII (5Y) Scenario VIII (7Y) Scenario IX (10Y) Scenario X (5Y) Scenario XI (7Y) Scenario XII (10Y) Techonoly and Content Costs $6 333,60 $5 170,29 $4 297,80 $6 333,60 $5 170,29 $4 297,80 $6 333,60 $5 170,29 $4 297,80
Deferred Content Costs $25 183,40 $26 346,71 $27 219,20 $25 183,40 $26 346,71 $27 219,20 $25 183,40 $26 346,71 $27 219,20
Total Assets $141 194,45 $162 805,39 $140 339,42 $141 194,45 $162 805,39 $140 339,42 $141 194,45 $162 805,39 $140 339,42
Interest Expense $1 186,69 $1 186,69 $1 186,69 $1 397,02 $1 397,02 $1 397,02 $1 603,28 $1 603,28 $1 603,28
Income Taxes -$5 916,89 -$4 292,81 -$6 344,40 -$6 641,72 -$4 248,64 -$7 069,24 -$5 829,40 -$4 205,33 -$6 256,92
Operational Cash $15 413,55 $16 827,30 $14 986,03 $15 203,23 $16 827,30 $14 775,71 $14 996,96 $16 827,30 $14 569,45
Operating Lease Obligations $20 849,52 $20 849,52 $20 849,52 $19 711,53 $19 711,53 $19 711,53 $18 666,06 $18 666,06 $18 666,06
Amortization Leases $1 843,72 $1 843,72 $1 843,72 $1 650,98 $1 650,98 $1 650,98 $1 480,76 $1 480,76 $1 480,76
Total Debt $61 918,80 $61 918,80 $61 918,80 $60 973,55 $60 973,55 $60 973,55 $60 098,30 $60 098,30 $60 098,30
Net Income $23 180,15 $17 070,54 $24 788,44 $23 310,53 $17 200,92 $24 918,81 $23 428,87 $17 319,26 $25 037,15
Scenario I (int. rate at 2,57% - 1%) Scenario II (int. rate at 2,57%) Scenario III (int. rate at 2,57% + 1%)
24 • Return on Assets: percentage of how profitable a company's assets are in generating revenue.
• Return on Equity: measure of how well a company uses investments to generate earnings’ growth;
• Current Ratio4: ability of a company to cover its short-term liabilities with its current
assets;
• Quick Ratio: level of the most liquid current assets available to cover current liabilities; • Cash Ratio: the value of current assets that could quickly be turned into cash, and what percentage of the company’s current liabilities these cash and near-cash assets could cover; • Total Debt to Total Assets Ratio: how well a company can cope with long term financial obligations;
• Debt to Equity Ratio: measurement of the percentage of the company’s balance sheet that is financed by suppliers, lenders, creditors and obligors versus what the shareholders have committed;
• Cash Flow to Debt Ratio: operating cash flow is defined as the amount of cash generated by the company’s normal business operations;
• Operating Cash Flow to Sales Ratio: gives investors an idea of the company's ability to turn sales into cash;
• Free Cash Flow to Operating Cash Flow Ratio: operating cash flow minus capital expenditures, an essential outflow of funds to maintain a company's competitiveness and efficiency.
4Calculated assuming no additional entry in Current Assets (Deferred Development Costs and Right of Use Asset) and no Current Liabilities (PV Lease
Payments).
Table 9 – Ratio Analysis
Ratio Type Formula Result Unadjusted Result Adjusted Variation (%) Profit Margin Profitability Net Income / Revenue 1,71% 9,67% 467,13% Return on Assets Profitability Net Income / Average Total Assets 2,31% 10,57% 357,41% Return on Equity Profitability Net Income / Average Shareholder's Equity 10,95% 39,08% 257,03% Current Ratio Liquidity Current Assets / Current Liabilities 104,00% 97,61% -6,14% Quick Ratio Liquidity (Cash Equivalents + Marketable Securities + Accounts Receivable) / Current Liabilities 76,27% 69,89% -8,37% Cash Ratio Liquidity (Cash + Marketable Securities) / Current Liabilities 53,53% 47,15% -11,92% Total Debt to Total Assets Ratio Solvency Total Liabilities / Total Assets 78,90% 73,01% -7,47% Debt to Equity Ratio Solvency Total Liabilities / Total Shareholder's Equity 373,89% 270,04% -27,77% Cash Flow to Debt Ratio Solvency Operating Cash Flow / Total Debt 74,50% 27,60% -62,96% Operating Cash Flow to Sales Ratio Cash Flow Indicator Operating Cash Flow / Net Sales (Revenue) 10,36% 9,46% -8,72% Free CF to Operating CF Ratio Cash Flow Indicator FCF (OCF - CAPEX) / OCF 35,15% 28,95% -17,62%
25 Conclusion
Concluding on how Reporting Standards used to do Financial Reporting activities and to what extent standard A is better than B is not an easy task and not the purpose of this paper.
Throughout this analysis, the author tried to focus on literature review that intended to be skeptical on whether IFRS and U.S GAAP should become one. It has been a complex and dubious discussion among professionals, which even led SEC to postpone the union between U.S GAAP with IFRS in 2014 to be postponed. It is undoubtable that differences between the above mentioned have been decreasing over the years, but survivors are not that different from each other.
If it wasn’t for the release of IFRS 9, IFRS 16 and IAS 38, both standards would be even closer. However, with the implementation of these new rules, the impacts that would result from these changes became a warning sign and a constant concern for companies required to adopt them. It is paramount to state that these differences, have considerable impacts in a company’s financial statements. Adopting IFRS 16 exposes a company to a higher level of leverage, with an estimated debt increase of 42%. Capitalizing costs however, increases net income by 453%. Recognizing financial instruments at their FV through NI exposes a company to higher levels of volatility in earnings.
Nevertheless, what one should conclude with this study is that transparency results in perception. Perception enhances interest. Interest increases decision making. Decision making is leads to investment. Amazon would increase its likelihood of profit levels by more than 400%, debt financed by external creditors would decrease by more than 20% and Amazon would increase growth through earnings’ increase by more than 250%. If there are no signs of higher transparency leads to better investment (at Amazon’s benefit), than one asks – What is?
26
Attachment 1 – Amazon’s Consolidated Profit and Loss Statement
CONSOLIDATED STATEMENTS OF OPERATIONS Year Ended December 31,
(in millions $, except per share data) 2017
Net product sales $118 573,00
Net service sales $59 293,00
Total net sales $177 866,00
Operating expenses:
Cost of sales $111 934,00
Fulfillment $25 249,00
Marketing $10 069,00
Technology and content $22 620,00
General and administrative $3 674,00
Other operating expense, net $214,00
Total operating expenses $173 760,00
Operating income $4 106,00
Interest income $202,00
Interest expense -$848,00
Other income (expense), net $346,00
Total non-operating income (expense) -$300,00
Income before income taxes $3 806,00
Provision for income taxes -$769,00
Equity-method investment activity, net of tax -$4,00
Net income $3 033,00
Basic earnings per share 6.32
Diluted earnings per share 6.15
Weighted-average shares used in computation of earnings per share:
Basic $480,00
Diluted $493,00
Amazon
27
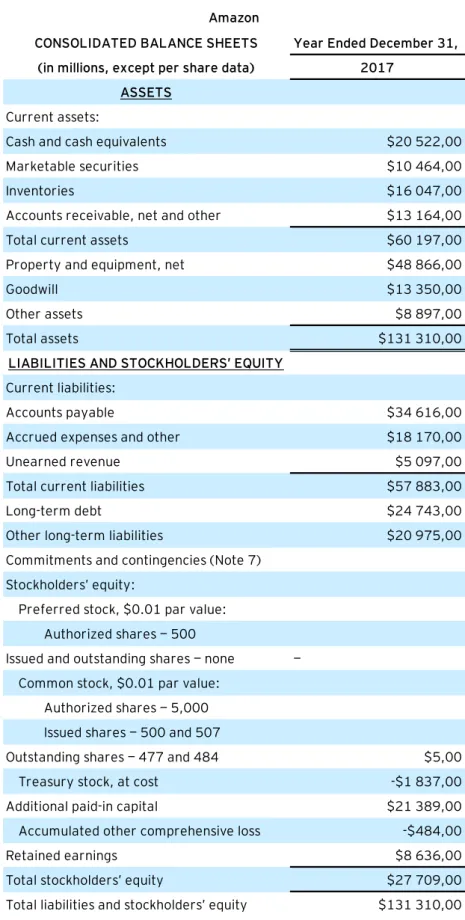
Attachment 2 – Amazon’s Consolidated Balance Sheet
CONSOLIDATED BALANCE SHEETS Year Ended December 31,
(in millions, except per share data) 2017
ASSETS
Current assets:
Cash and cash equivalents $20 522,00
Marketable securities $10 464,00
Inventories $16 047,00
Accounts receivable, net and other $13 164,00
Total current assets $60 197,00
Property and equipment, net $48 866,00
Goodwill $13 350,00
Other assets $8 897,00
Total assets $131 310,00
LIABILITIES AND STOCKHOLDERS’ EQUITY
Current liabilities:
Accounts payable $34 616,00
Accrued expenses and other $18 170,00
Unearned revenue $5 097,00
Total current liabilities $57 883,00
Long-term debt $24 743,00
Other long-term liabilities $20 975,00
Commitments and contingencies (Note 7) Stockholders’ equity:
Preferred stock, $0.01 par value: Authorized shares — 500
Issued and outstanding shares — none —
Common stock, $0.01 par value: Authorized shares — 5,000 Issued shares — 500 and 507
Outstanding shares — 477 and 484 $5,00
Treasury stock, at cost -$1 837,00
Additional paid-in capital $21 389,00
Accumulated other comprehensive loss -$484,00
Retained earnings $8 636,00
Total stockholders’ equity $27 709,00
Total liabilities and stockholders’ equity $131 310,00
Amazon
28
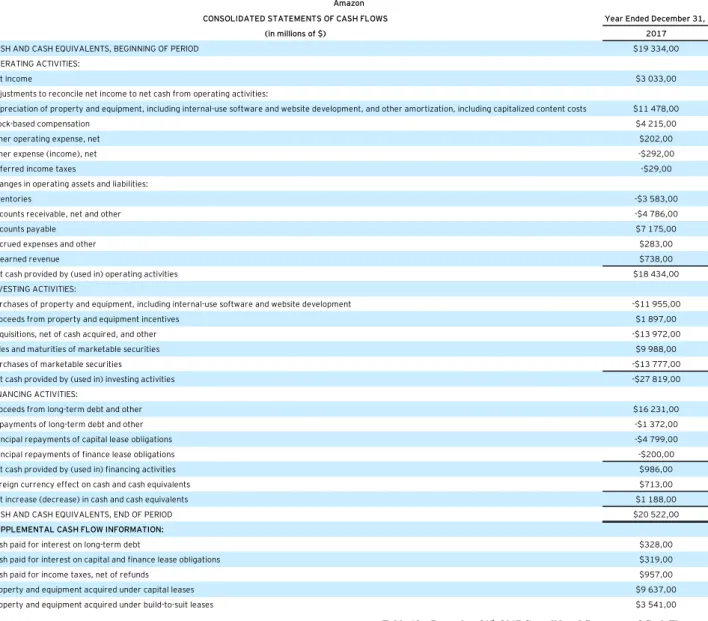
Attachment 3 – Amazon’s Consolidated Statement of Cash Flows
CONSOLIDATED STATEMENTS OF CASH FLOWS Year Ended December 31,
(in millions of $) 2017
CASH AND CASH EQUIVALENTS, BEGINNING OF PERIOD $19 334,00
OPERATING ACTIVITIES:
Net income $3 033,00
Adjustments to reconcile net income to net cash from operating activities:
Depreciation of property and equipment, including internal-use software and website development, and other amortization, including capitalized content costs $11 478,00
Stock-based compensation $4 215,00
Other operating expense, net $202,00
Other expense (income), net -$292,00
Deferred income taxes -$29,00
Changes in operating assets and liabilities:
Inventories -$3 583,00
Accounts receivable, net and other -$4 786,00
Accounts payable $7 175,00
Accrued expenses and other $283,00
Unearned revenue $738,00
Net cash provided by (used in) operating activities $18 434,00
INVESTING ACTIVITIES:
Purchases of property and equipment, including internal-use software and website development -$11 955,00
Proceeds from property and equipment incentives $1 897,00
Acquisitions, net of cash acquired, and other -$13 972,00
Sales and maturities of marketable securities $9 988,00
Purchases of marketable securities -$13 777,00
Net cash provided by (used in) investing activities -$27 819,00
FINANCING ACTIVITIES:
Proceeds from long-term debt and other $16 231,00
Repayments of long-term debt and other -$1 372,00
Principal repayments of capital lease obligations -$4 799,00
Principal repayments of finance lease obligations -$200,00
Net cash provided by (used in) financing activities $986,00
Foreign currency effect on cash and cash equivalents $713,00
Net increase (decrease) in cash and cash equivalents $1 188,00
CASH AND CASH EQUIVALENTS, END OF PERIOD $20 522,00
SUPPLEMENTAL CASH FLOW INFORMATION:
Cash paid for interest on long-term debt $328,00
Cash paid for interest on capital and finance lease obligations $319,00
Cash paid for income taxes, net of refunds $957,00
Property and equipment acquired under capital leases $9 637,00
Property and equipment acquired under build-to-suit leases $3 541,00
Amazon
29
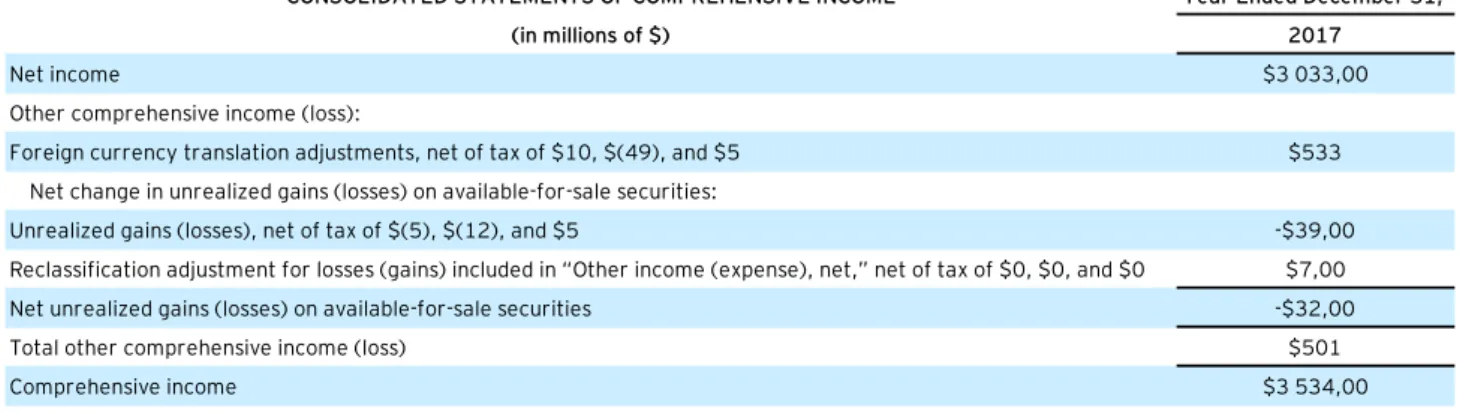
Attachment 4 – Amazon’s Consolidated Statement of Comprehensive Income
CONSOLIDATED STATEMENTS OF COMPREHENSIVE INCOME Year Ended December 31,
(in millions of $) 2017
Net income $3 033,00
Other comprehensive income (loss):
Foreign currency translation adjustments, net of tax of $10, $(49), and $5 $533 Net change in unrealized gains (losses) on available-for-sale securities:
Unrealized gains (losses), net of tax of $(5), $(12), and $5 -$39,00 Reclassification adjustment for losses (gains) included in “Other income (expense), net,” net of tax of $0, $0, and $0 $7,00 Net unrealized gains (losses) on available-for-sale securities -$32,00
Total other comprehensive income (loss) $501
Comprehensive income $3 534,00
Amazon
30
Attachment 5 – Amazon’s Consolidated Statement of Changes in Equity
C O N SO L ID A T E D ST A T E M E N T S O F ST O C KH O L D E R S’ E Q U IT Y C om m on St oc k (in m illi on s of $ ) Sh ar es A m ou nt T re asu ry St oc k A dd itio na l P aid -in C ap ita l A cc um ula te d O th er C om pr eh en si ve In co m e ( L oss) R et ain ed E ar nin gs T ot al St oc kh old er 's E qu ity Ba la nc e a s o f J an ua ry 1 2 0 1 5 $ 4 6 5 ,0 0 $ 5 ,0 0 -$ 1 8 3 7 ,0 0 0 $ 1 1 1 3 5 ,0 0 -$ 5 1 1 ,0 0 $ 1 9 4 9 ,0 0 $ 1 0 7 4 1 ,0 0 Ne t in co m e — — — — — $ 5 9 6 ,0 0 $ 5 9 6 ,0 0 O the r c om pr eh en siv e in co m e ( lo ss ) — — — — -$ 2 1 2 ,0 0 — -$ 2 1 2 ,0 0 Ex er cis e o f c om m on stoc k o ption s $ 6 ,0 0 — — $ 4 ,0 0 — — $ 4 ,0 0 Ex ce ss ta x b en ef its fr om stoc k-b as ed c om pe ns ation — — — $ 1 1 9 ,0 0 — — $ 1 1 9 ,0 0 Stoc k-b as ed c om pe ns ation a nd is su an ce o f e m plo ye e b en ef it pla n s toc k — — — $ 2 1 3 1 ,0 0 — — $ 2 1 3 1 ,0 0 Iss ua nc e o f c om m on stoc k f or a cq uis ition a ctiv ity — — — $ 5 ,0 0 — — $ 5 ,0 0 Ba la nc e a s o f D ec em be r 3 1 2 0 1 5 $ 4 7 1 ,0 0 $ 5 ,0 0 -$ 1 8 3 7 ,0 0 0 $ 1 3 3 9 4 ,0 0 -$ 7 2 3 ,0 0 $ 2 5 4 5 ,0 0 $ 1 3 3 8 4 ,0 0 Ne t in co m e — — — — — $ 2 3 7 1 ,0 0 $ 2 3 7 1 ,0 0 O the r c om pr eh en siv e in co m e ( lo ss ) — — — — -$ 2 6 2 ,0 0 — -$ 2 6 2 ,0 0 Ex er cis e o f c om m on stoc k o ption s $ 6 ,0 0 — — $ 1 ,0 0 — — $ 1 ,0 0 Ex ce ss ta x b en ef its fr om stoc k-b as ed c om pe ns ation — — — $ 8 2 9 ,0 0 — — $ 8 2 9 ,0 0 Stoc k-b as ed c om pe ns ation a nd is su an ce o f e m plo ye e b en ef it pla n s toc k — — — $ 2 9 6 2 ,0 0 — — $ 2 9 6 2 ,0 0 Ba la nc e a s o f D ec em be r 3 1 2 0 1 6 $ 4 7 7 ,0 0 $ 5 ,0 0 -$ 1 8 3 7 ,0 0 0 $ 1 7 1 8 6 ,0 0 -$ 9 8 5 ,0 0 $ 4 9 1 6 ,0 0 $ 1 9 2 8 5 ,0 0 C um ula tiv e e ffe ct of a c ha ng e in a cc ou ntin g p rin ciple re la te d to stoc k-b as ed c om pe ns ation — — — — — $ 6 8 7 ,0 0 $ 6 8 7 ,0 0 Ne t in co m e — — — — — $ 3 0 3 3 ,0 0 $ 3 0 3 3 ,0 0 O the r c om pr eh en siv e in co m e — — — — $ 5 0 1 ,0 0 — $ 5 0 1 ,0 0 Ex er cis e o f c om m on stoc k o ption s $ 7 ,0 0 — — $ 1 ,0 0 — — $ 1 ,0 0 Stoc k-b as ed c om pe ns ation a nd is su an ce o f e m plo ye e b en ef it pla n s toc k — — — $ 4 2 0 2 ,0 0 — — $ 4 2 0 2 ,0 0 Ba la nc e a s o f D ec em be r 3 1 2 0 1 7 $ 4 8 4 ,0 0 $ 5 ,0 0 -$ 1 8 3 7 ,0 0 0 $ 2 1 3 8 9 ,0 0 -$ 4 8 4 ,0 0 $ 8 6 3 6 ,0 0 $ 2 7 7 0 9 ,0 0 A m az on T ab le 14 – De ce m b er 31 st , 2017 Con so lid at ed S tat em en t o f S har eh old er ’s E q uit y
31
Attachment 6 – Classification and Measurement for Financial Instruments (IFRS 9)
> The financial asset is held within a business model whose objective
is to hold financial assets in order to collect contractual cash flows, AND
> The contract terms of the financial asset gives rise on specific dates
to cash flow that are solely payments of principal and interest on the principal amount outstanding.
> The financial asset is held within a business model whose objective is
achieved by both collecting contractual cash flows and selling financial
asset
AND
> The contract terms of the financial asset gives rise on specific dates to
cash flows that are solely payments of principal and interest on the principal amount outstanding.
> Whenever not classified at amortized cost or FVOCI: > There are irrevocable options for the entity:
- Not held for trading equity investments that would be classified as
FVNI and be classified as FVOCI;
- Financial assets that meet the criteria for amortized cost
or FVOCI can be classified as FVNI if doing so eliminated or reduces significantly and "accounting mismatch".
Cash flow characteristics Business Model Business Model Cash flow characteristics
Classification of Financial Assets
Type 1. Amortized cost
2. FVOCI
3. FCNI Type
Type
Table 15, 16 and 17 – Classification and Measurement of Financial Instruments under IFRS 9
32
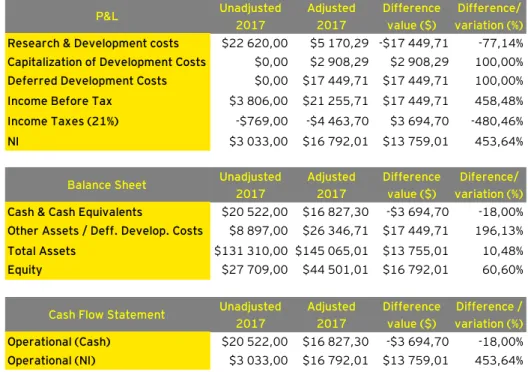
Attachment 7 – Overall Reclassifications from Research and Development Costs IAS 38
Table 18 – Financial impacts from reclassifying research and development costs under IAS 38
Unadjusted Adjusted
2017 2017
Research & Development costs $22 620,00 $5 170,29 -$17 449,71 -77,14%
Capitalization of Development Costs $0,00 $2 908,29 $2 908,29 100,00%
Deferred Development Costs $0,00 $17 449,71 $17 449,71 100,00%
Income Before Tax $3 806,00 $21 255,71 $17 449,71 458,48%
Income Taxes (21%) -$769,00 -$4 463,70 $3 694,70 -480,46%
NI $3 033,00 $16 792,01 $13 759,01 453,64%
Unadjusted Adjusted
2017 2017
Cash & Cash Equivalents $20 522,00 $16 827,30 -$3 694,70 -18,00%
Other Assets / Deff. Develop. Costs $8 897,00 $26 346,71 $17 449,71 196,13%
Total Assets $131 310,00 $145 065,01 $13 755,01 10,48% Equity $27 709,00 $44 501,01 $16 792,01 60,60% Unadjusted Adjusted 2017 2017 Operational (Cash) $20 522,00 $16 827,30 -$3 694,70 -18,00% Operational (NI) $3 033,00 $16 792,01 $13 759,01 453,64% Difference value ($) Difference/ variation (%) Difference value ($) Diference/ variation (%) Difference value ($) Difference / variation (%) P&L Balance Sheet
33
Attachment 8 – Overall Reclassifications from Operating Leases IFRS 16
34
Attachment 9 – Overall Reclassifications from Financial Instruments IFRS 9
Table 20 – Financial impacts from reclassifying Financial Instruments under IFRS 9
Description 2017
Unrealized profit (loss) from changes in FV -$39,00
Impact in NI -$39,00
Impact in OCI $39,00
35
Attachment 10 – Overall Consolidated Reclassification of Accounts
Table 21 – Overall impacts from reclassifications on Amazon’s December 31st, 2017 Financial Statements
Statement Previous Adjusted Difference $ Variation %
P&L $22 620,00 $8 078,57 -$14 541,43 -64,29% BS $8 897,00 $26 346,71 $17 449,71 196,13% P&L $3 806,00 $21 255,71 $17 449,71 458,48% P&L -$769,00 -$4 248,64 -$3 479,64 452,49% P&L $3 033,00 $17 200,92 $14 167,92 467,13% BS $20 522,00 $16 827,30 -$3 694,70 -18,00% BS $131 310,00 $162 805,39 $31 495,39 23,99% BS $27 709,00 $44 014,11 $16 305,11 58,84% CFS $18 434,00 $16 827,30 -$1 606,70 -8,72% CFS $3 033,00 $17 200,92 $14 167,92 467,13% BS $42 913,00 $60 973,55 $18 060,55 42,09% P&L -$848,00 $1 397,02 $2 245,02 -264,74% CFS $986,00 -$664,98 -$1 650,98 -167,44% SOCI $3 534,00 $3 573,00 $39,00 1,10% Equity Operational Cash Operational NI Total Debt Interest Expense
Net Cash used in Financing Activities OCI
Adjusted Values in the Financial Statements Total Caption
Technology and Content
Other Assets (Technology and Content) Income Before Tax
Income Taxes Net Income
Cash and Cash Equivalents Total Assets
36
Attachment 11 – Modified and Full Retrospective Approaches to accounting for IFRS 16
Modified Retrospective Approach
Lessee does not have to reclassify and recast comparative information. Previous accounting procedures for Operating Leases will be left untouched under IFRS 16. At the beginning of the application of IFRS 16 (as of January 1st, 2019), lessees will recognize the cumulative effect of the initial application as an adjustment to the beginning balance of retained earnings. First, one should calculate the PV of all remaining lease payments using the lessee's incremental borrowing rate at the date of initial application and stating the lease liability at the calculated amount on the balance sheet. There are two possible ways to measure and quantify for the right of use asset (on a lease-by-lease basis): (1) - Measure the asset as if IFRS 16 had been applied since the commencement date of a lease using a discount rate based on the lessee's incremental borrowing rate at the date of initial application; (2) - Measure the asset at an amount equal to the lease liability, adjusted by the amount of any prepaid or accrued lease payments recognized immediately before the date
of initial application.
Companies that do opt to comply with the new rule under this method would benefit from cost and time
savings and the unnecessary need to restate previous year’s
comparatives. On the other hand, it would be difficult to conduct performance ratios due to deviations in comparatives between the old standard and the newly implemented.
37
Full Retrospective Approach
This method requires adopters to follow IAS 8 – Accounting Policies, Changes in Accounting
Estimates and Errors - and present Financial Statements as if IFRS 16 has already been
implemented in the past. The next step is to adjust retained earnings at the beginning of the first comparative period. This would imply an increase in the amount of work and costs, as the adopters would have to go back to every contract’s commencement date to gather information. All the required adjustments must be made to the prior year’s opening balance of retained earnings and the following comparative financial information restated from that moment onwards.
Summarizing, this method implies that the adjustment of retained earnings has to be made on January 1st, 2018, meaning that although the lessee presents leases under IAS 17 for the FY18, in 2019 the lessee has to restate these same figures to comply with IFRS 16. Meaning, companies will apply IAS 17 in preparing its FS for 2018 and, then, will apply IFRS 16 to prepare comparative financial information to be included in its 2019’s financial statements. Advantages from this form of adoption arise with the fact that no estimations are required meaning that all the financial figures are represented more accurately which, consequently, will lead to higher quality reporting for audit and management purposes. Oppositely, there is a heavy increase in the amount of work due to the collection of historical lease information and restatement of comparatives, as well as a higher demand for resources, additional reporting, disclosures, and high demand for financial spending.