Master’s Degree in Management / Finance from the
NOVA – School of Business and Economics
„The Impact of Blockchain Technology on the Trustworthiness of Online
Voting Systems”
-
„Elections and Trust“
Nina Vysna – 34646
A Project carried out on the Master in Management / Finance Program, under the supervision of:
Prof. Andrew Bell
„The Impact of Blockchain Technology on the Trustworthiness of Online Voting Systems“ - „Elections and Trust“
Abstract
Online Voting evidently increases election turnouts. However, recent state-owned initiatives have failed due to security concerns and a lack of trust in the systems. Blockchain seems to be a very suitable technical solution to establish transparency in online voting and thus, create trust. We have built our own, blockchain-enabled voting platform and utilized it to run an A/B-testing experiment at a university election to investigate its effect. Our results show that students trusted the blockchain-based voting version less than the control version. However, literature and our focus group findings revealed that there is an interrelation between the distrust among the students and a low level of familiarity with blockchain technology. Hence, we conclude that people should be educated before being confronted with blockchain-enabled online voting to take advantage of the technology’s potential.
Keywords: Blockchain, Online Voting, Trust, Transparency
This work used infrastructure funded by Fundacao para a Ciencia e a Tecnologia (UID/ECO/00123/2013, UID/ECO/00124/2019 and Social Sciences DataLab, Project 22209),
POR Lisboa (LISBOA-01-0145-FEDER-007722 and Social Sciences DataLab, Project 22209) and POR Norte (Social Sciences DataLab, Project 22209).
Table of Contents
Table of Figures ...3 Table of Tables ...3 1. Introduction ...4 2. Literature Review ...5 Individual Contribution ...52.1 Elections and trust ...5
2.1.1 Election requirements ...7
2.1.2 Voting methods and their main issues ...9
2.1.2.1 Traditional voting systems ...9
2.1.2.2 Electronic voting systems ... 10
2.1.2.3 Remote voting systems ... 10
2.1.3 Current voting systems, transparency and trust ... 12
Group Contribution ... 15
3. Results ... 15
4. Conclusion ... 21
Table of Figures
Figure 1: Voter Turnout of the Student Representatives Election at Nova SBE
(2016-2019) ... 16
Table of Tables
Table 1: Compilation of election requirements. ... 7
Table 2: Demographic distributions of the sample and p-values of the imbalance .... 16
Table 3: Descriptive statistics of the constructs and their sub-constructs ... 17
Table 4: Model 1 - Regression analyses coefficients and two tailed p-values for all the respective constructs and sub-constructs ... 19
Table 5: Model 2,3 & 4 – Regression analyses coefficients and two tailed p-values for all respective constructs and sub-constructs ... 19
1. Introduction
According to Russell and Zamfir (2018), participation rates in parliamentary elections dropped by more than 10% globally between 1980 and 2018. To take countermeasures against this trend, online voting turned out to be a promising idea. Breux et al. (2017) found evidence that online voting actually increases election turnouts by especially encouraging less committed voters. Unfortunately, various, state-run initiatives to implement online voting have failed. The Netherlands forbade electronic counting of votes due to a strong fear of cyberattacks (Lowe, 2019) and France stopped all ongoing initiatives because of similar motivations (Reuters, 2018). The only exception remains Estonia, which already enabled online voting in parliamentary elections since 2005. In 2019, for the first time in history, it became the most popular channel to cast a vote with 44% of all participating voters using it (Krivonosova, 2019). However, what seems to be missing to expand the implementation of online voting systems is the right technology. Both, the responsible authorities and the broad population have to trust their voting system to enable a successful transformation. Spycher et al. (2011) identified transparency as the most crucial factor for establishing trust in online voting systems. In achieving this, Dogo et al. (2018) stress that blockchain technology establishes strong perceived transparency. Our implied research hypothesis therefore states that introducing blockchain technology to online voting system does actually increase the trust in this system. This hypothesis turns into our research question: To what extent the use of blockchain technology actually impacts the trustworthiness of online voting systems?
With the goal of investigating the answer, we built our own, blockchain-based online voting system, called Votechain, to run an expedient experiment. It technically works on a blockchain protocol and enables voters to cast their ballot online and verify it afterwards. Hereby, the voters are given access to the entire blockchain of the particular election they are participating in, in an encrypted manner. Each block represents one vote.
Votechain has been utilized in a students’ elections encompassing almost 1000 votes out of which roughly every second student actively participated in our A/B-Testing experiment. The main goal of this experiment was to investigate, whether students who were prompted with a visualization of the election blockchain after they cast their vote would actually trust this online voting system more than the control group, to which state-of-the-art security methods were shown instead.
This research paper starts off with an extensive literature review including an elaboration about the nature of elections, voting methods and the transition to online voting. Continuation of the literature review can be found in Konzok (2020) who discusses blockchain technology and in Riedlberger (2020) who elaborates on blockchain-based voting. Thereafter, Riedlberger (2020) describes methods we used, while this paper presents the experiment’s results in the results section as well as adequate statistical analysis. The discussion of the results is presented in Konzok (2020).
2. Literature Review
Our literature review is split into three sections and represents our individual contributions to the master thesis. Nina Vysna created the first section — Elections and trust — that is part of this document. Ivo Konzok developed the second section — An exploration of blockchain technology — and Kevin Riedlberger wrote the third section — Blockchain-enabled online voting. These parts are included in separate papers, Konzok (2020) and Riedlberger (2020).
Individual Contribution
2.1 Elections and trust
Elections are undoubtedly one of the cornerstones of any democratic society, as they allow ordinary citizens to participate in political decisions (Currin-Percival, 2010). When they work
well, they can deepen civic engagement, inform public debate and hold those in power accountable (Wojtasik, 2013; Norris and Grömping, 2019). In the recent years however, issues around elections have received a lot of attention in the global media, particularly after the US presidential elections in 2016. Russian actors are believed to have breached the elections’ security and accessed the voter registration systems and state websites, compromising at least 21 U.S. states prior to the elections. Even though the U.S. intelligence services concluded that no votes have been altered, hackers were able to steal hundreds of thousands of voters’ personal information among other ways of interfering (Abrams, 2019). Alarmingly, in a study conducted two weeks prior to the 2016 elections, researchers found that only 35% of Americans were very confident that their vote would be casted correctly (McCarthy and Clifton, 2016). According to the Elections Integrity Project 2019, fears of foreign meddling together with online disinformation and fake news are on top of the list of most pressing issues that challenge the perception of elections’ integrity. These issues are not exclusive to the USA, but are rather a global phenomenon as foreign interference have been reported in Europe as well, for example in the Brexit referendum campaign (Norris and Grömping, 2019).
According to Fowler, democracy only works if the elections results are perceived as legitimate (Morgan, 2018). In order to perceive the outcome of elections as legitimate, voters have to trust the electoral process (Anderson, 2005). To prevent democracy from being undermined, it is therefore essential to investigate how trust in electoral systems can be improved.
Our research contribution in this paper focuses on the trustworthiness of voting methods. Even though we provide an overview of all major election technologies, we chose to focus on the electronic methods and especially online voting technologies. Despite the advantages of online elections detailed below and digital transformation affecting all parts of the society, including elections, these systems face a lot of distrust. The existing skepticism is
however not withot valid reasons and our goal is to understand and find ways to reduce them. Specifically, we will explore the utility of emerging blockchain technologies to increase trust in online voting systems.
In this first part of our literature review we discuss the general requirements for voting systems, different methods of voting, and issues concerning the trustworthiness of these methods.
2.1.1 Election requirements
For a voting technology to be considered eligible for use in elections, it has to fulfil specific legal and constitutional requirements that aim to preserve democracy. Table 1 summarizes the most relevant requirements mentioned in current literature (Aranha and van de Graaf, 2018; Mursi et al., 2013; Lambrinoudakis et al., 2003; Mitrou et al., 2003; Gritzalis, 2002). According to Lambrinoudakis et al. (2003), requirements fall into two groups: security and system-wide requirements. Some requirements are further decomposed into several sub-attributes.
Table 1: Compilation of election requirements Security requirements
Accuracy - inalterability - no one can change another person’s vote
- completeness - all valid votes are included in the final count - soundness - no invalid vote is included
Democracy - eligibility - only eligible voters can place a vote
- unreusability - each voter can cast only one vote and cannot vote instead of anyone else
Privacy/secrecy - voters cannot be linked back to their vote; their election
Robustness - allowing abstention - voters have option to not cast their vote - preventing misbehaviour - preventing voters or election
authorities to invalidate the result of the election maliciously Verifiability/Audab
ility
- universal/public verifiability - anyone can verify the election results
- individual verifiability - voters can verify that their individual vote has been cast as intended and counted in the final tally Freedom/Uncoerca
bility
- voters free to form their opinion and to express it without being threatened, pressured or manipulated
Fairness - results only revealed when no one can vote anymore
Declarability - possibility to find out if the voter participated or not
Dispute freeness - a mechanism is in place to resolve any potential disputes at any point
System-wide requirements
Reliability - resistance towards any randomly occurring malfunctions
User Friendliness - easy to use system for all demographic groups
Equality - equal access - each demographic group has access to the
election technology and/or to the polling stations
- ‘one voter one vote’ principle - each vote counts equally towards the election result
Voter convenience - possibility to cast a vote quickly and easily
Voter mobility - possibility to cast a vote regardless of voter’s location
Flexibility - multiple different question formats, e.g. open-ended questions
Efficiency - determined by performance (time needed for one person to
vote) and complexity of the underlying technology - creates an upper limit to the scalability – number of
participants able to cast their ballot in a given time period with given resources
Transparency - all parties able to understand the election system and establish
2.1.2 Voting methods and their main issues
While there are many stages in the voting process, from recruiting poll workers to the final tabulation of results, here we focus on the process of casting a ballot itself and we summarize the methods that have been used around the globe for this purpose. Concerning this stage, it is important to define a few relevant terms. Election is a formal and organized choice by vote of a person for a political office or other position. A vote is an answer of an election participant to a certain question, each question with a set of answers or candidates is a race and a ballot is a structure that consists of one or more votes. A voting scheme/system is any method or a protocol that has mechanisms to receive votes as input and to produce the sum of those votes as an output and thus manages elections (Mursi et al., 2013).
2.1.2.1 Traditional voting systems
Although the mass proliferation of digital technology through all aspects of society has led to the digitization of certain elections, the majority of the world’s national elections are still held using traditional paper-ballot systems. Such ballots have pre-printed names of qualified candidates in a uniform order and they are counted by hand. Tally teams responsible for counting the votes are generally composed of members representing all competing parties. This is a major weakness of the paper-ballot system, as more experienced tally counters can bias the counting in their favour if the counters of the opposing party are more naive or less experienced. This can in turn threaten the accuracy requirement of the elections (Jones, 2003).
Another voting scheme commonly used in the United States is the optical mark-sense system. Poll workers use an optical scanner to register the choice of the voter marked on a paper ballot. Results of the count are stored electronically. They can be recounted as the system has a paper audit trail (Gambhir and Karsten, 2019). The main drawback of this system is that voters might use the wrong marking implement or wrong type of mark, which can lead to miscounts of votes (Jones, 2003), as was the case in Florida during the 2000 US presidential elections.
Punch card systems, which were also notorious for causing the miscount and subsequent recount in the 2000 US Presidential Election, have since been abandoned (Franzen, 2001; Agresti and Presnell 2002).
2.1.2.2 Electronic voting systems
The first fully computerized voting scheme, Direct Recording Electronic System (DRE) is used in multiple countries around the world. Examples include Brazil, India, Venezuela or the United States. European countries that used to have electronic voting machines in the past such as Germany, Netherlands and Ireland, abolished the system (Nikolov, 2019). In such systems, voters receive a PIN or a smart card from the election officials, that is inserted into the DRE machine (a computer connected to a network with an uninterruptible power supply placed in a voting booth), which has a touch screen. The election choice is then recorded digitally by the computer‘s memory (Lauer, 2004; Mursi et al., 2013).
One drawback of the DRE, is despite its redundant storage, the storage is created by the same software as the original count and therefore it is impossible to conduct an independent and reliable recount (Lauer, 2004; Jones, 2003). There are also systems called DRE - VVPAT (Voter Verified Paper Audit Trails) that enable users to print out the physical proof of vote for the election participants (Mursi et al., 2013). Even though this feature enhances audibility, it does not prevent potential tampering with the machines’ software in the first place (Lauer, 2004).
2.1.2.3 Remote voting systems
Jones (2003) defines remote voting, that can either be postal or electronic, as an election in which the participants are „not constrained to vote at designated polling places on the election day“ (p.13). Remote electronic voting (also called i-voting, online or internet voting) enables elections participants to cast their vote from any digital device connected to a public network. Ballots are then transmitted to the election authorities via the Internet (Oppliger et al. 2008).
Decreasing voter turnout is often stated as the reason to introduce voting that does not require physical presence and thus makes voting more convenient (Oppliger et al. 2008). Around the world, the average participation in national parliamentary elections decreased from 76% to 66% from 1980 to 2018 (Russell and Zamfir, 2018). Breux et al. (2017) found that remote voting indeed encourages election participation among less committed voters as has been stated in our introduction. A case study in Ontario evidently proved this finding (Goodman and Stokes, 2018). Additional benefits that justify the use of remote electronic voting in specific were summarized by Zada et al. (2016) as follows: „verifiability, speed of tallying ballots, reduced administration and wastage of resources and time, and vote casting validation“ (p.117). In most countries, remote voting is only an additional and exceptional option for exercising voting rights (Mitrou et al., 2003), available for eligible voters with a valid reason for not being able to attend the official polling station, such as residing abroad. However, making remote voting (and specifically online voting) merely a supplementary option hinders “the interest for innovation and for technologically supported participation in political processes” (Mitrou et al.,2003, p.47). The only country where online voting is available on a country-wide scale for all eligible voters in parliamentary elections is at the moment Estonia.
Postal and online voting share some flaws stemming from the vote being cast in the voter’s private environment rather than in a traditional booth in a public polling station (Krimmer & Volkamer, 2005). The voters themselves are the ones that need to ensure that the principles of free and private elections are protected, instead of the polling station workers. Although remote voting does not introduce problems related to privacy - voter coercion (forcing someone to vote in a certain way) and vote buying (paying someone to vote in a certain way) – they may be magnified due to a potential attacker’s extended reach and ability to verify the voters’ actions (Jules et al., 2010).
Online voting is often claimed to be insecure by design and experts warn against the danger of malicious hardware and software that could impact elections (Finogina, 2018). Personal electronic devices can be affected by viruses and worms, while servers can be affected by various cyber-attacks, e.g. denial-of-service (National Academies of Sciences, Engineering and Medicine, 2018). Another problem of online voting is the ‘digital divide’, which can be explained as implicit exclusion of certain demographic groups (poor, elderly, particular ethnic groups) who do not have the same access to and/or understanding of the underlying technology (Peralta, 2003).
2.1.3 Current voting systems, transparency and trust
Each voting system has a number of flaws with the potential to endanger one or more election requirements outlined in section 2.1.1. It would be subjective to claim that certain requirements are more important than others and thus certain election systems are better than others. Morover, according to Past (2019), security of elections is not a technical problem as attempts for election meddling have happened frequently throughout history, regardless of the system used. Since no system and its underlying technology guarantees bulletproof security, it is crucial to manage the risks of the chosen system and build up voters’ confidence that their vote is cast and counted correctly.
As previously mentioned, trust of voters into the electoral system is crucial for results to be considered legitimate and thus for preserving democracy. Bernhard et al. (2017) points out that for election results to be seen as legitimate, they must be convincing to all and especially to losers so there is no valid ground for challenging it. Norris (2014) and Bernhard et al. (2017) also found that when citizens suspect that electoral malpractice is common, they are less likely to participate in elections. However, not much research has focused on establishing which systems are most trusted by the voters and why. The existing research is also rather
inconclusive, perhaps because the trusting beliefs of voters frequently shift depending on the news coverage and controversies surrounding a particular voting technology (McGaley and Gibson, 2006).
Voters’ trust can be defined as the confidence that the voter’s ballot has been cast and counted correctly (Alvarez and Hall, 2004; Alvarez et al., 2008). The few studies regarding voters’ trust in election technologies have mostly been focused on the American voters and have produced conflicting results. Atkeson and Saunders (2007) found that absentee (postal) voting leads to lower voter confidence. They also emphasized that voter confidence is significantly impacted by voters’ level of belief that the technology used produces verifiable results. Alvarez et al. (2008) found that any other technology than paper ballot seems to decrease voter confidence. Stewart et al. (2010) researched voters’ preferences in the states of New Jersey and Virginia and the results suggest that most people prefer to vote on electronic machines, less with optical scan machines and least with hand counted paper ballots. Claassen et al. (2013) on the other hand found that voters trust optical scanners more than electronic machines. The latest survey held in the USA by the University of Chicago Harris School of Public Policy and The Associated Press-NORC Center for Public Affairs (2018) reports that Americans have most confidence in electronic machines that provide paper receipts, less in optically scanned paper ballots and least of them trust electronic machines without a paper trail. This survey further suggests that only 28 percent of Americans would be in favor of using an online voting system or the exclusive use of mail-in ballots.
Smith (2016) researched trust in voting technology among Australian citizens and found that they have the most trust in the voting systems they are most familiar with - paper ballots. They are also reasonably confident that remote electronic voting would produce accurate election results if it was introduced. In addition, he found that young voters are more positive about electronic elections than older voters. Research is quite conflicted in this topic as some
studies support this finding (Avgerou et al.,2009; Stewart, 2009) while other studies suggest that young people trust electronic voting less than older voters since they have more knowledge about the technology and its potential pitfalls (Alvarez et al., 2008; Delwit et al., 2005).
A study from Switzerland, where electronic voting has been tested in multiple elections since 2004, found that trust is a very important prerequisite for the adoption of electronic voting systems (Fragnière et al., 2019). Voters consider secrecy combined with individual verifiability crucial for their ability to trust the system. In addition, participants of this study offered an interesting insight: voters are more willing to forgive a human error that occurs in paper ballot elections than a computer error. According to the respondents in this study, an average person does not have the capacity to understand a computer error and thus to empathisize with it. Lheureux de Freitas and Macadar (2017) similarly found that in Brazil, where electronic voting has been in use since 1996, voters simply do not understand the election process suggesting that low transparency is a significant weakness of such systems.
Indeed, number of authors agree that the lack of transparency is a great challenge for electronic voting. For instance, Gritzalis (2002) suggest that the inherent distrust in such voting systems is due to their lack of transparency. Lauer (2004) further argues that while paper ballot system place trust in the government, electronic voting systems place trust in the hands of the third parties that make the technology, and the technology itself with its little transparency. In contrast, the paper ballot voting process is easily comprehensible and people can use common sense to look for potential fraud (Schoenmakers, 2000). Zollinger et al. (2019) also support the idea that people trust paper ballot systems more because they understand all the steps involved. Being familiar with the used technology and understanding it plays an important role in perceived trustworthiness of the election system (Avgerou et al., 2009). In Germany for instance, electronic voting was claimed unconstitutional in 2005 as an average voter without
any prior knowledge in the matter, should be able to understand the whole voting process (Weiler, 2018).
Trust evidently plays a crucial role in the use of all electronic voting systems and its acceptance (McGaley and Gibson, 2006). Transparency that allow voters to directly observe and understand the processes involved in casting the votes and their consequent tallying seem to be the key concept for elections to be perceived as genuine and trustworthy (Enguehard, 2008). This is problematic for electronic voting systems that suffer from low transparency as opposed to traditional paper ballot systems. It therefore seems that if governments want to reap the advantages of e-voting systems - and more specifically its online version that allows citizens to vote remotely - such as higher turnout, or faster and less wasteful process, they need to increase transparency of such systems, among other things.
In the following chapter 2.2, we investigate if blockchain technology has the potential to increase transparency and hence to be the solution for the trust issues that hinder adoption of online election technologies.
Group Contribution
Please find Methods in Riedlberger (2020) and Discussion in Konzok (2020).
3. Results
Out of 3127 students of Nova SBE who were eligible for voting, 967 decided to cast their vote, making it the highest turnout in ten years (see Figure 1). Versions A and B of the application were alternately distributed among the subjects based on the previous voter’s version; 483 received version A and 484 saw version B. 454 out of 967 voters filled in the survey (response rate = 46.9%); 242 of them belonging to the control group (no blockchain) and 212 belonging to the experimental group (with blockchain).
Figure 1: Voter Turnout of the Student Representatives Election at Nova SBE (2016-2019)
The demographic distributions of the overall surveyed sample and the respective groups can be found below, in Table 2. Majority of the sample was male (56.17%), white (93.39%), aged between 18 and 24 (83.04%), and Portuguese (64.54%). Other prominent nationalities that participated in the survey, other than Portuguese were German (16.74%) and Italian (6.39%).
Table 2: Demographic distributions of the sample and p-values of the imbalance
Both groups (N=454) Control group (N=242) Treatment group (N=212) p-value (imbalance t-test) Gender Male 56.17% 50.83% 62.26% 0.014** Female 43.61% 49.17% 37.26% 0.011** Age Under 18 0.66% 1.24% 0.00% 0.104 18-24 83.04% 82.64% 83.49% 0.811 25-34 15.64% 15.29% 16.04% 0.827 35-44 0.44% 0.83% 0.00% 0.185 45-54 0.22% 0.00% 0.47% 0.286 Program Masters 72.25% 70.66% 74.06% 0.421 Bachelors 22.25% 22.73% 21.70% 0.793 Ph.D. 5.07% 5.79% 4.25% 0.457 Other 0.44% 0.83% 0.00% 0.185 Nationality Portuguese 64.54% 61.16% 68.40% 0.108 German 16.74% 19.01% 14.15% 0.167 Italian 6.39% 7.85% 4.72% 0.174 Other 12.33% 11.98% 12.74% 0.809 Race White 93.39% 90.91% 96.23% 0.023** Asian 1.54% 1.24% 1.89% 0.583 Black 1.32% 2.48% 0.00% 0.021** Other 3.74% 5.37% 1.89% 0.051*
Notes: significance at: *α = 10%; **α = 5%.
0 100 200 300 400 500 600 700 800 900 1000 0 50 100 150 200 250 300 350 400 16/17 17/18 18/19 19/20 (online voting) To tal N u m b e r o f V o te s N u m b e r o f V o te s p e r El e c ti o n
Voter Turnout of the Student Representatives Election at Nova SBE
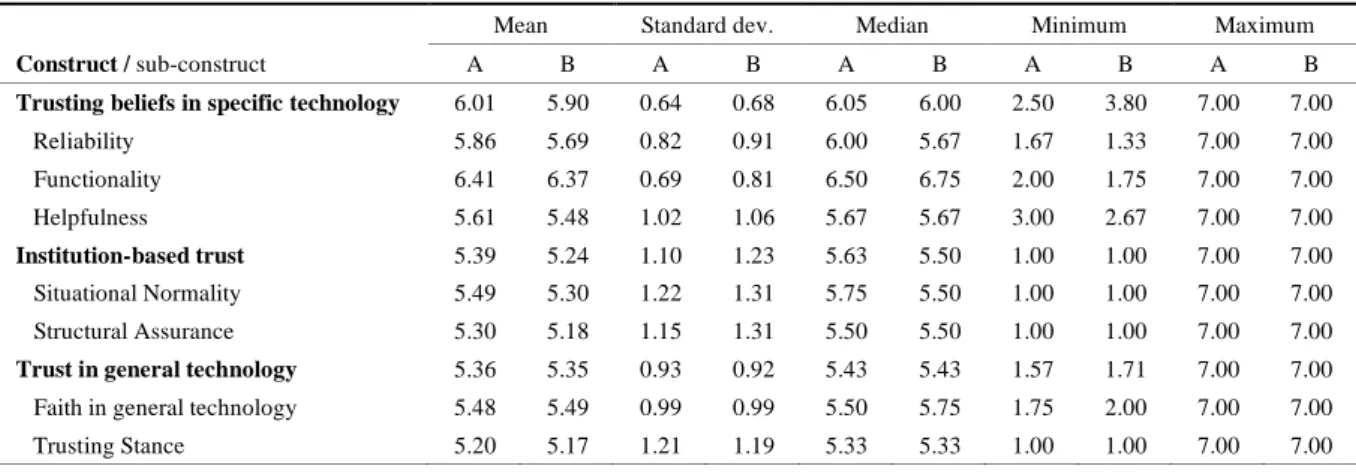
By analysing the descriptive statistics across the two groups (reported in Table 3), we see that surveyed voters in the control group (non-blockchain application) have higher average scores on each construct and almost all sub-constructs than the voters in the treatment group (blockchain version). The only exception is faith in general technology, where treatment group scores slightly higher on average. The highest average score of 6.41 was measured for sub-construct functionality in the control group. It is important to note that the average scores of all sub-constructs and hence constructs are on the upper end of the spectrum.
Table 3: Descriptive statistics of the constructs and their sub-constructs
Mean Standard dev. Median Minimum Maximum
Construct / sub-construct A B A B A B A B A B
Trusting beliefs in specific technology 6.01 5.90 0.64 0.68 6.05 6.00 2.50 3.80 7.00 7.00
Reliability 5.86 5.69 0.82 0.91 6.00 5.67 1.67 1.33 7.00 7.00 Functionality 6.41 6.37 0.69 0.81 6.50 6.75 2.00 1.75 7.00 7.00 Helpfulness 5.61 5.48 1.02 1.06 5.67 5.67 3.00 2.67 7.00 7.00 Institution-based trust 5.39 5.24 1.10 1.23 5.63 5.50 1.00 1.00 7.00 7.00 Situational Normality 5.49 5.30 1.22 1.31 5.75 5.50 1.00 1.00 7.00 7.00 Structural Assurance 5.30 5.18 1.15 1.31 5.50 5.50 1.00 1.00 7.00 7.00
Trust in general technology 5.36 5.35 0.93 0.92 5.43 5.43 1.57 1.71 7.00 7.00
Faith in general technology 5.48 5.49 0.99 0.99 5.50 5.75 1.75 2.00 7.00 7.00
Trusting Stance 5.20 5.17 1.21 1.19 5.33 5.33 1.00 1.00 7.00 7.00
As mentioned in the Methods section (Riedlberger,2020), we ran the first regression model 10 times, to measure the effect of the treatment (blockchain) on each construct and sub-construct separately while controlling for the imbalanced variables gender and race. Based on the outlined theoretical framework, blockchain increases transparency and thus we hypothesized that using blockchain should increase trust in online voting systems. In other words, we hypothesized that the trusting beliefs in specific technology construct and its sub-constructs (reliability, functionality, helpfulness) may receive higher scores in the treatment group than in the control group. However, the results of the regression analysis do not allow us to reject the null hypothesis that there is no significant difference in trust in our online voting system between subjects who received non-blockchain version and those who received blockchain version, with the exception of reliability sub-construct. We found the treatment
significantly decreases perceived reliability of our voting application with 95% confidence (p=0.037). The coefficient is -0.1723, meaning that, on average, subjects who received the treatment have a 0.17 units lower average score on reliability items, as compared to those without the treatment. For all the other sub-constructs and constructs we did not observe any significant effect of the treatment, but it is worth to note that the coefficients of the treatment were negative for all constructs and almost all sub-constructs except faith in general technology. However, it is unsurprising that the treatment did not have any effect on institution-based trust and propensity to trust general technology, as these constructs measure the level of trust towards technology in general and towards online voting systems regardless of our voting application. We only expected a positive effect of treatment (blockchain) on trusting beliefs in specific technology and its sub-constructs. Quite contrary to our hypothesis expectations, the results suggest that blockchain has a significant negative effect on perceived reliability of our online election system. The coefficients and p-values for Model 1 are reported in Table 4.
In the second model, we measured the added effects of belonging to a certain nationality, gender, education level and of having a different level of trust (both trust in general technology and institution-based trust) on trust in our blockchain enabled voting application and its perceived reliability, functionality and helpfulness. We were able to observe a significant negative effect for Ph.D. students in reliability, helpfulness and trusting beliefs in specific technology. This effect is observed regardless of the treatment, meaning that the effect of being a Ph.D. student is on average the same for both control and treatment group. The coefficient is however close to zero which implies a relatively little effect. In addition, there were only 23 Ph.D. students in the whole sample (N=454), thus it is hard to deduct any implications from this observation.
Table 4: Model 1 - Regression analyses coefficients and two tailed p-values for all the respective constructs and sub-constructs
Reliability Functionality Helpfulness Trust in specific technology Situational Normality Structural Assurance Institution-based trust Faith in general technology
Trusting Stance Trust in general technology Independent
variables coef. p-value coef. p-value coef. p-value coef. p-value coef. p-value coef. p-value coef. p-value coef. p-value coef. p-value coef. p-value Constant 5.875 0.000*** 6.382 0.000*** 5.577 0.000 5.988 0.000*** 5.451 0.000*** 5.246 0.000*** 5.348 0.000*** 5.435 0.000*** 5.123 0.000*** 5.301 0.000*** Female -0.083 0.310 0.013 0.863 0.037 0.711 -0.009 0.887 0.024 0.845 0.098 0.406 0.061 0.587 0.057 0.550 0.092 0.423 0.072 0.414 Black 0.097 0.785 0.364 0.243 0.411 0.340 0.298 0.274 0.708 0.175 -0.320 0.529 0.194 0.688 0.463 0.261 0.346 0.487 0.413 0.280 Asian 0.616 0.061* -0.023 0.936 0.658 0.099* 0.373 0.138 0.808 0.094* 0.677 0.150 0.743 0.096* 0.186 0.624 0.765 0.096* 0.434 0.218 Other race 0.362 0.090* 0.249 0.184 0.023 0.928 0.215 0.189 -0.025 0.937 0.440 0.887 0.009 0.974 0.090 0.715 0.167 0.575 0.123 0.590 Treatment -0.172 0.037** -0.018 0.801 -0.124 0.216 -0.096 0.128 -0.170 0.160 -0.112 0.343 -0.141 0.208 0.029 0.758 -0.002 0.985 0.016 0.858
Table 5: Model 2, 3 & 4 - Regression analyses coefficients and two tailed p-values for all respective constructs and sub-constructs
Model 2 Model 3 Model 4
Reliability Functionality Helpfulness Trust in specific technology Situational Normality Structural Assurance Institution-based trust Faith in general technology
Trusting Stance Trust in general technology Independent
variables coef. p-value coef. p-value coef. p-value coef. p-value coef. p-value coef. p-value coef. p-value coef. p-value coef. p-value coef. p-value Constant 5.985 0.000*** 6.555 0.000*** 5.648 0.000*** 6.112 0.000*** 5.579 0.000*** 5.332 0.000*** 5.455 0.000*** 5.488 0.000*** 5.186 0.000*** 5.358 0.000*** Female -0.143 0.196 -0.043 0.658 0.159 0.231 -0.012 0.882 -0.015 0.926 0.156 0.303 0.071 0.619 0.257 0.042** 0.040 0.796 0.164 0.161 Black -0.083 0.826 0.389 0.240 0.529 0.244 0.289 0.310 0.295 0.580 -0.756 0.147 -0.230 0.638 0.807 0.064* 0.126 0.812 0.515 0.202 Asian 0.560 0.094* 0.027 0.927 0.718 0.073* 0.394 0.118 0.600 0.202 0.542 0.238 0.571 0.185 0.429 0.262 0.863 0.064* 0.615 0.083* Other race 0.319 0.147 0.302 0.117 0.066 0.803 0.236 0.155 -0.121 0.694 -0.053 0.860 -0.087 0.758 0.242 0.338 0.181 0.557 0.216 0.357 German 0.136 0.379 -0.082 0.544 -0.059 0.749 -0.010 0.932 0.016 0.940 -0.039 0.853 -0.011 0.954 -0.402 0.022** -0.384 0.072* -0.395 0.015** Italian 0.000 0.999 -0.225 0.232 0.342 0.184 0.013 0.938 0.072 0.811 -0.056 0.850 0.008 0.976 0.352 0.152 0.342 0.253 0.347 0.127 Other nation 0.226 0.246 -0.165 0.332 -0.107 0.648 -0.031 0.836 0.298 0.274 0.333 0.210 0.316 0.207 -0.397 0.074* 0.236 0.384 -0.126 0.541 Bachelors -0.022 0.877 -0.063 0.613 0.040 0.816 -0.020 0.853 -0.070 0.729 0.066 0.738 -0.002 0.992 -0.183 0.264 -0.018 0.929 -0.112 0.460 Ph.D. -0.541 0.025** -0.124 0.558 -0.923 0.002*** -0.489 0.008*** 0.439 0.196 0.179 0.589 0.309 0.321 -0.430 0.118 -0.091 0.785 -0.285 0.263 Other program -0.163 0.795 -0.362 0.511 -0.992 0.189 -0.491 0.301 1.216 0.169 0.132 0.878 0.674 0.406 -0.959 0.175 -0.702 0.414 -0.849 0.195
Gen. tech. neutral -0.060 0.730 -0.042 0.780 0.164 0.431 0.014 0.913 -0.593 0.014** -0.694 0.003*** -0.643 0.004*** - - -
-Gen. tech. low -0.323 0.280 0.058 0.825 -0.211 0.556 -0.137 0.543 -2.032 0.000*** -1.670 0.000*** -1.851 0.000*** - - -
-Inst. tech. neutral -0.202 0.279 -0.191 0.243 -0.658 0.003*** -0.334 0.018** - - -
-Inst. tech. low -0.687 0.003*** -0.749 0.000*** -0.420 0.125 -0.632 0.000*** - - -
-Treatment -0.215 0.162 0.035 0.797 -0.009 0.961 -0.053 0.645 -0.075 0.720 0.053 0.795 -0.011 0.955 0.199 0.232 0.029 0.886 0.126 0.413
Female × treatment 0.119 0.473 0.036 0.803 -0.282 0.156 -0.035 0.782 0.026 0.912 -0.186 0.412 -0.080 0.706 -0.486 0.011** 0.141 0.540 -0.217 0.217
German × treatment -0.221 0.353 0.090 0.665 0.057 0.842 -0.013 0.941 -0.214 0.522 -0.076 0.817 -0.145 0.636 -0.049 0.854 -0.408 0.211 -0.203 0.413
Italian × treatment 0.305 0.389 -0.037 0.904 -0.631 0.137 -0.113 0.672 0.547 0.272 0.252 0.605 0.399 0.382 -0.217 0.592 -0.126 0.799 -0.178 0.636
Other nat. × treatment -0.081 0.763 0.061 0.796 0.262 0.418 0.079 0.699 -0.050 0.894 -0.066 0.858 -0.058 0.867 -0.120 0.693 -0.851 0.022** -0.434 0.125 Bachelors × treatment 0.081 0.694 -0.243 0.180 0.061 0.805 -0.055 0.727 -0.152 0.602 -0.100 0.726 -0.126 0.638 0.118 0.619 0.238 0.411 0.170 0.441
Ph.D. × treatment 0.390 0.309 -0.276 0.412 0.702 0.127 0.217 0.453 -0.740 0.170 -0.885 0.093 -0.812 0.100 0.769 0.079** 0.178 0.737 0.516 0.203
Other prog. × treatment 0.000 0.108 0.000 0.062* 0.000 0.878 0.000 0.115 0.000 0.614 0.000 0.564 0.000 0.975 0.000 - 0.000 - 0.000
-GTN × treatment -0.111 0.657 -0.416 0.059* -0.943 0.002*** -0.483 0.011*** -0.274 0.432 -0.156 0.647 -0.215 0.501 - - -
-GTL × treatment -0.234 0.626 -0.621 0.141 0.477 0.409 -0.176 0.628 -0.292 0.650 -0.900 0.152 -0.596 0.312 - - -
-ITN × treatment -0.161 0.552 0.127 0.593 0.449 0.168 0.137 0.503 - - -
-ITL × treatment 0.326 0.286 0.482 0.072* 0.171 0.640 0.342 0.138 - - -
In line with our expectations and with the research of the McKnight et al. (2011), we see a significant negative effect of having low/neutral institution-based trust on the trust in specific technology and its subconstructs across both control and treatment group, as compared to subjects with high institution-based trust. We also see an added negative effect of having low/neutral general technology trust on trust in our blockchain based voting application. The significance and coefficient for each variable and construct/sub-construct are displayed in Table 5. For instance, being neutral towards general technology has an added negative effect of -0.51 units on average on trusting beliefs in our blockchain-based voting application.
The third model similarly measured the added effects of belonging to a certain nationality, gender, education level and of having a different level of trust in general technology on institution-based trust and its sub-constructs. As expected, our results suggest that subjects with neutral or low general technology trust have significantly lower scores on situational normality, structural assurance and institution-based trust than those with high general technology trust. This effect is however observed regardless of the treatment; it is the same whether the subjects received the blockchain version or not.
The fourth model measures the added effects of belonging to a certain nationality, gender, education level on general technology trust and its sub-constructs. The results suggest that on average, Germans have significantly lower scores for faith in general technology, stance towards general technology and trust in general technology than Portuguese subjects regardless of the treatment, meaning the effect is the same for both control and treatment group. Being female also shows significant effect on faith in general technology regardless of the treatment: female subjects tend to have an 0.26 units higher average score than males for this sub-construct. Interaction term between females and treatment is significant as well, however the direction of the effect is negative and compounding the coefficients for females, treatment and females x treatment variables yields coefficient that is close to zero, thus it is impossible to
make a meaningful interpretation. Regression analysis for stance towards general technology shows significant negative effect of interaction variable between other nationality and treatment. However, since the variable other nationality combines the scores of 33 different nationalities, we did not give this observation much consideration. The coefficients and p-values for Models 2,3 & 4 are reported in Table 5.
4. Conclusion
Blockchain bears high potential to enhance the transparency of online voting systems and therefore increase their trustworthiness to drive adoption and higher election turnouts. We expected that our A/B-experiment - described in Riedlberger (2020) - would reveal higher levels of trust for blockchain-enabled voting in contrast to a two-factor-authentication security protocol, which we used for the control group of our experiment. Results presented in this paper showed the opposite. Although only one of the seven sub-constructs we applied to measure trust showed a significant difference between version A and B, this difference was in favor of two-factor-authentication. Students tended to perceive version A (two-factor-authentication) as more reliable than version B (blockchain-based). However, we were able to retrieve from literature that transparency of online voting systems and familiarity with the utilized technology are key enabler of trust, which is supported by our focus group findings. Students agreed that blockchain enhances transparency which verifies the technology’s potential for being applied in online voting.
Therefore, we concluded that people have to become more familiar with blockchain technology to be able to trust its application, as discussed in Konzok (2020). The right way to achieve a widespread technical understanding seems to be educating the population ahead of time. Future research should use our findings to set up an experiment, using a representative sample and effective education methods, to fundamentally approve blockchain’s potential in driving the trustworthiness of online voting systems. In times of decreasing turnouts of
parliamentary elections and a dangerous shift to the right in global politics, the importance of finding effective ways to engage people in raising their political voice cannot be overstated.
5. Bibliography
Abrams, Abigail. 2019. “Here's What We Know So Far About Russia's 2016 Meddling”. Accessed November 2019. https://time.com/5565991/russia-influence-2016-election/. Agresti, Alan, and Brett Presnell. 2002. “Misvotes, Undervotes and Overvotes: The 2000
Presidential Election in Florida.” Statistical Science 17(4): 436-440. https://doi.org/10.1214/ss/1049993202.
Alvarez, R.M. and Hall, T.E. 2008. Electronic elections: The perils and promises of digital democracy. Princeton, NJ: Princeton University Press.
Alvarez, R.M., Hall, T.E. and Llewellyn, M.H. 2008. Are Americans confident their ballots are counted? Journal of Politics 70: 754–766.
Anderson, Christopher J., André Blais, Shaun Bowler, Todd Donovan, and Ola Listhaug. 2005. Losers’ Consent: Elections and Democratic Legitimacy. Oxford/New York: Oxford University Press
Aranha, Diego F., and Jeroen van de Graaf. 2018. “The Good, the Bad, and the Ugly: Two Decades of E-Voting in Brazil.” IEEE Security & Privacy 16(6): 22-30.
https://doi.org/10.1109/msec.2018.2875318.
Atkeson, L.R. and Saunders, K.L. 2007. The effect of electoral administration on voter confidence: A local matter? PS Political Science and Politics 40: 655–660.
Avgerou, Chrisanthi, Andrea Ganzaroli, Angeliki Poulymenakou, and Nicolau Reinhard. 2009. “Interpreting the Trustworthiness of Government Mediated by Information and Communication Technology: Lessons from Electronic Voting in Brazil.” Information Technology for Development 15(2): 133-148.
Bernhard, Matthew, Josh Behaloh, J. Alex Halderman, Ronald L. Rivest, Peter Y. A. Ryan, Philip B. Stark, Vanessa Teaugue, Poorvi L. Vora, Dan S. Wallach. 2017. “Public Evidence from Secret Ballots.” In Secong International Joint Conference on Electronic Voting E-Vote-ID 2017 proceedings. 121-140.
Breux, Sandra, Jérôme Couture, and Royce Koop. 2017. “Turnout in Local Elections: Evidence from Canadian Cities, 2004–2014.“ Canadian Journal of Political Science 50(3), 699-722. doi:10.1017/S000842391700018X
Claassen, R.L., Magleby, D.B., Monson, J.Q. and Patterson, K.D. 2013. Voter confidence and the election-day voting experience. Political Behavior 35: 215–235.
Currin‐Percival, Mary, Garrick L. Percival, Shaun Bowler & Martin Johnson (2010) Citizen Dissatisfaction with the US Presidential Primary System, Journal of Elections, Public Opinion and Parties, 20:1, 3-30, DOI: 10.1080/17457280903450666
Delwit, P., Kulahci, E. and Pilet, J.B. 2005. Electronic voting in Belgium: A legitimized choice? Politics 25(3): 153–164.
Dogo, E. M., N.I. Nwulu, Olayemi M. Olaniyi, Clinton Aigbavboa and Thembinkosi
Nkonyana. 2018. “Blockchain 3.0: Towards a Secure Ballotcoin Democracy through a Digitized Public Ledger in Developing Countries.” In Conference: 2nd International Conference on Information and Communication Technology and Its Applications (ICTA 2018): Federal University of Technology, Nigeria.
Enguehard, Chantal. 2008. “Transparency in Electronic Voting : The Great Challenge.” In Conference on E-democracy - State of the art and future agenda proceedings.
Finogina, Tamara. 2018. “Why Is Paper-Based Voting the Most Secure Option?” Third International Joint Conference on Electronic Voting E-Vote-ID 2018: TUT Press Proceedings. 349-350.
Fragnière, Emmanuel, Sandra Grèzes, and Randolf Ramseyer. 2019. “How Do the Swiss Perceive Electronic Voting? Social Insights from an Exploratory Qualitative Research.”
In Fourth International Joint Conference on Electronic Voting: E-Vote-ID 2019, 106– 21.
Franzen, Harald. 2001. “The 2000 Election, Reengineered.” Scientific American. July 2001. https://www.scientificamerican.com/article/the-2000-election-reengin/.
Gambhir, Raj Karan, and Jack Karsten. 2019. “Why Paper Is Considered State-of-the-Art Voting Technology.” Brookings. Accessed October 2019.
https://www.brookings.edu/blog/techtank/2019/08/14/why-paper-is-considered-state-of-the-art-voting-technology/.
Goodman, Nicole, and Leah C. Stokes. 2018. “Reducing the Cost of Voting: An Empirical Evaluation of Internet Voting’s Effect on Turnout.” SSRN Electronic Journal. https://doi.org/10.2139/ssrn.2849167.
Gritzalis, Dimitris A. 2002. “Principle and Requirements for a Secure E-Voting System.” Computer & Society 21 (6): 539–56.
Jones, Douglas W. 2003. “The Evaluation of Voting Technology.” Secure Electronig Voting Advances in Information Security 7: 3-16. New York: Springer Science + Business Media
Juels, Ari, Dario Catalano, and Markus Jakobsson. 2010. “Coercion-Resistant Electronic Elections.” Towards Trustworthy Elections: new Directions in Electronic Voting. 37-63. Berlin: Springer-Verlag.
Konzok, Ivo. 2020. “The Impact of Blockchain Technology on the Trustworthiness of Online Voting Systems – An Exploration of Blockchain Technology”. NOVA School of Business and Economics. Lisbon.
Krimmer, Robert, and Melanie Volkamer. 2005. “Bits or Paper? Comparing Remote
Electronic Voting to Postal Voting.” in Electronic Government - Workshop and Poster Proceedings of the Fourth International EGOV Conference 2005, Denmark.
Krivonosova, Iullia, Serrano, R. Antnoio, Duenas-Cid, David and Krimmer, Robert. 2019. “How increasing use of Internet voting impacts the Estonian election management.” In Fourth International Joint Conference on Electronic Voting E-Vote-ID 2019. 1-4. Taltech Press.
Lambrinoudakis, Costas, Dimitris Gritzalis, Vassilis Tsoumas, Maria Karyda, and Spyros Ikonomopoulos. 2003. “Secure Electronic Voting: The Current Landscape.” Secure Electronic Voting. Advances in Information Security, 101-122. New York: Springer Science + Business Media
Lauer, Thomas W. 2004. “The Risk of E-Voting.” Electronic Journal of E-Government 2 (3): 177-186.
Lheureux de Freitas, Jorge, and Marie Anne Macadar. 2017. “The Brazilian Electronic Voting System: Evolution and Challenges.” In Second International Joint Conference on
Electronic Voting E-Vote-ID 2017. 59-71.
Lowe, Kevin, Christine Tennent, John Guenther, Neil Harrison,Cathie Burgess, C., Moodie, N. and Vass, G., 2019. “Aboriginal Voices: An overview of the methodology applied in the systematic review of recent research across ten key areas of Australian Indigenous education.” The Australian Educational Researcher 46(2). 213-229.
doi: 10.1007/s13384-019-00307-5.
McCarthy, Justin, and Jon Clifton. 2016. “Update: Americans’ Confidence in Voting, Election.” Gallup. Accessed December 2019.
https://news.gallup.com/poll/196976/update-americans-confidence-voting-election.aspx.
McGaley, Margaret, and J. Paul Gibson. 2006. “A Critical Analysis of the Council of Europe Recommendations on E-Voting.” In EVT'06: Proceedings of the USENIX/Accurate
Electronic Voting Technology Workshop 2006 on Electronic Voting Technology Workshop.
Mitrou, Lilian, Dimitris Gritzalis, Sokratis Katsikas, and Gerald Quirchmayr. 2003. “Electronic Voting: Constitutional and Legal Requirements, and Their Technical Implications.” In Secure Elecetronic Voting.Advances in Information Security. 43-60. New York: Springer Science + Business Media
Morgan, Billy. 2018. “New Survey Reveals Concerns about the Security of the Nation’s Voting System ahead of the Midterm Elections.” The University of Chicago - Harris Public Policy. October 2018. https://harris.uchicago.edu/news-events/news/new-survey-reveals-concerns-about-security-nations-voting-system-ahead-midterm.
Mursi, Mona F. M., Ghazy M. R. Assassa, Ahmed Abdelhafez, and Kareem M. Abo Samra. 2013. “On the Development of Electronic Voting: A Survey.” International Journal of Computer Applications in Technology 61 (16):1-11.doi:10.5120/10009-4872
National Academies of Sciences, Engineering, and Medicine. 2018. Securing the Vote: Protecting American Democracy. Washington, DC: The National Academies Press. https://doi.org/10.17226/25120.
Nikolov, Krassen. 2019. “Fact check: Does machine voting exist in Europe?” Accessed December 2019. https://euelectionsbulgaria.com/fact-check-does-machine-voting-exist-in-europe/
Norris, Pippa. 2014. Why Electoral Integrity Matters. Cambridge University Press.
Norris, Pippa, and Max Grömping. 2019. “Electoral Integrity Worldwide.” Electoral Integrity Project. Accessed December 2019.
https://static1.squarespace.com/static/58533f31bebafbe99c85dc9b/t/5ce60bd6b208fcd9 3be49430/1558580197717/Electoral+Integrity+Worldwide.pdf.
Oppliger, Rolf, Jör Schwenk, and Jörg Helbach. 2008. “Protecting Code Voting Against Vote Selling.” In SICHERHEIT 2008 – Sicherheit, Schutz Und Zuverlässigkeit. Beiträge Der 4. Jahrestagung Des Fachbereichs Sicherheit Der Gesellschaft Für Informatik e.V., edited by Alkassar Ammar, 193–204. Gesellschaft für Informatik e. V.
Past, Liisa. 2019. “What Estonia’s Record Number of I-Voters Teaches Us about Election Trust.” Euractiv. Accessed December 2019.
https://www.euractiv.com/section/elections/opinion/what-estonias-record-number-of-i-voters-teaches-us-about-election-trust/.
Peralta, Rene. 2003. “Issues, Non-Issues, and Cryptographic Tools for Internet-Based Voting.” Secure Electronic Voting. Advances in Information Security (7):155-164 . Boston: Springer.
Perrigo, Billy. 2019. “What the U.S. Can Learn About Electronic Voting From This Tiny Eastern European Nation.” www.time.com. Accessed December 2019.
https://time.com/5541876/estonia-elections-electronic-voting/. Reuters. 2018. “Blockchain explained.” Accessed September
26. http://graphics.reuters.com/TECHNOLOGYBLOCKCHAIN/010070P11GN/index.h tml.
Riedlberger, Kevin. 2020. “The Impact of Blockchain Technology on the Trustworthiness of Online Voting Systems – An Exploration of Blockchain-Enabled Online Voting”. NOVA School of Business and Economics. Lisbon.
Russell, Martin, and Ionel Zamfir. 2018. “Digital Technology in Elections - Efficiency versus Credibility?” European Parliamentary Research Service. Accessed December 2019. http://www.europarl.europa.eu/RegData/etudes/BRIE/2018/625178/EPRS_BRI(2018)6 25178_EN.pdf
Schoenmakers, Berry. 2000. “Compensating for a Lack of Transparency.” Proceedings of the Tenth Conference on Computers, Freedom and Privacy Challenging the Assumptions – 2000. 231-233.00. https://doi.org/10.1145/332186.332288.
Smith, Rodney. 2016. “Confidence in Paper-Based and Electronic Voting Channels: Evidence from Australia.” Australian Journal of Political Science 51(1): 68-85.
https://doi.org/10.1080/10361146.2015.1093091.
Spycher, Oliver, Melanie Volkamer, and Reto Koenig. 2011. “Transparency and technical measures to establish trust in norwegian internet voting.” In International Conference on E-Voting and Identity: VoteID11, 19-35. Berlin: Springer.
Stewart III, C., Alvarez, R.M. and Hall, T.E. 2010. Voting technology and the election experience: The 2009 gubernatorial races in New Jersey and Virginia. In R. Krimmer and R. Grimm, eds. Electronic voting 2010. Bonn: GI Editions.
The Associated Press-NORC Center for Public Affairs Research. 2018. „Concerns about the Vulnerability of the Election System Ahead of the 2018 Midterms“. Acceessed
November 2019.
http://www.apnorc.org/PDFs/Harris%20Poll%20Survey%201/UChicago%20Harris%20 APNORC%20Poll%201%20Final.pdf
Weiler, Thomas. 2018. “How to Solve the Transparency-Anonymity Dilemma?” Third International Joint Conference on Electronic Voting E-Vote-ID 2018: Proceedings.345-346.
Wojtasik, Waldemar. 2013. “Functions of Elections in Democratic Systems.” Political Preferences 4: 25-38 . https://doi.org/10.6084/m9.figshare.729054.
Zada, Phillip, Gregory Falzon, and Paul Kwan. 2016. “Perceptions of the Australian Public towards Mobile Internet Voting: Risks, Choice and Trust.” Electronic Journal of E-Government 14 (1): 117–34.
Zollinger, Marie-Laure, Verena Distler, Peter Rønne, Peter Y. A. Ryan, Carine Lallemand, and Vincent Koenig. 2019. “User Experience Design for E-Voting: How Mental Models Align with Security Mechanisms.” In Fourth International Joint Conference on