Space-Time Interpolation and Uncertainty Assessment of an Extreme
Precipitation Index Using Geostatistical Cosimulation
Ana Cristina Costa
Universidade Nova de Lisboa, ISEGI
Campus de Campolide, 1070-312 Lisboa,
Portugal
[email protected]
Amílcar Soares
Instituto Superior Técnico, CERENA
Av. Rovisco Pais, 1049-001 Lisboa,
Portugal
[email protected]
Abstract
The rainfall regime in southern Portugal is clearly Mediterranean. In such regions, the research on space-time patterns of extreme precipitation is an important contribution to assess desertification dynamics, among other impact studies applications. For the space-time interpolation and uncertainty assessment of an extreme precipitation index, in the southern region of continental Portugal, we explore the application of direct sequential cosimulation (coDSS), which allows incorporating covariates such as altitude. The technique is illustrated using precipitation observations measured at 105 monitoring stations with data within the period 1970-2000. The results provide evidences of an increase of the spatial continuity of the extreme precipitation index in the last decades. The relationship between elevation and the index is decreasing along time. The promising results from this study indicate the coDSS technique as a valuable tool to deepen the knowledge on the space-time patterns of extreme precipitation indices.
1. Introduction
The accurate analysis of precipitation patterns is an important issue, because it is essential for climate monitoring, modeling of erosion, runoff and pollutant transport, among other applications for ecosystem and hydrological impact modeling.
In arid and semi-arid regions such as the Mediterranean Basin, the research on space-time patterns of extreme precipitation indices is an important contribution to assess desertification dynamics and to identify areas potentially at risk from land degradation. In such environments, prolonged periods of drought in some areas may reduce the availability of water resources; while other areas can be affected by an increase of heavy precipitation
events, with an increase of erosion and flood risk ([14]).
The spatial interpolation of precipitation has been the focus of much research (e.g. [9], [6], [5]). However, the number of studies analyzing space-time patterns of extreme precipitation indices is very limited. The large majority of studies focus on their temporal linear trends and, although desirable, a spatial analysis sometimes is not feasible due to the sparse number of monitoring stations over large study regions ([13]). An exception is the work of [11] in which the station values of the daily precipitation were interpolated through external drift kriging, using a digital elevation model as secondary information and, afterwards, several extreme precipitation indices were calculated.
Geostatistical techniques, known as kriging, provide statistically unbiased estimates of surface attributes from a set of observations measured at point locations, using the estimated spatial and temporal covariance structure of the observed data. A major advantage of geostatistical prediction, such as kriging with an external drift or cokriging techniques, is that sparsely sampled observations of the primary attribute can be complemented by secondary attributes that are more densely sampled ([8], [9]).
Kriging is locally accurate in the minimum error variance sense, but it provides inaccurate representations of spatial variability ([1]), also known as the “smoothing” effect of kriging ([7], pp. 370). To overcome this limitation, stochastic simulation has become a widely accepted technique to reproduce the spatial distribution and uncertainty of highly variable phenomena ([7], [1], [16]).
As other southern European regions, the rainfall regime in southern Portugal is highly variable in both the spatial and temporal dimensions, being clearly Mediterranean. The southern part of the country is highly vulnerable to climate impacts, namely to Seventh IEEE International Conference on Data Mining - Workshops
droughts and erosive rainfall, and it is consequently vulnerable to desertification processes. Therefore, the research on space-time patterns of extreme precipitation indices over this region is especially relevant, and is the main objective of this work.
For the interpolation and uncertainty assessment of an extreme precipitation index, in the southern region of continental Portugal, we explore the application of direct sequential cosimulation ([16]) which allows incorporating covariates such as altitude.
The stochastic simulations were developed for an extreme precipitation index recommended by the joint working group on climate change detection of the World Meteorological Organization – Commission for Climatology (WMO–CCL) and the Research Programme on Climate Variability and Predictability ([15]).
The technique is illustrated using high quality daily precipitation observations measured at 105 monitoring stations located in southern Portugal, with data within the period 1970-2000. The direct cosimulation algorithm was implemented in a 800x800m grid using a digital elevation model (DEM) as exhaustive secondary information. The space-time patterns of the extreme precipitation index are analyzed, and uncertainty is assessed.
2. Study region and precipitation data
The study region is located in the South of continental Portugal, and 105 monitoring stations with daily precipitation data were selected (Figure 1). Most of the precipitation series were extracted from the National System of Water Resources Information (SNIRH – Sistema Nacional de Informação de Recursos Hídricos) database (http://snirh.inag.pt), and three of them were compiled from the European Climate Assessment dataset (http://eca.knmi.nl). Each station series data was previously quality controlled and studied for homogeneity by [2] and [3].
Numerous extreme precipitation indices are described and analyzed in the literature. Indices based on percentile thresholds are more appropriate for regions that contain a broad range of climates, whereas indices based on the count of days crossing fixed thresholds are beneficial for impact studies as they can be related with extreme events that affect human society and the natural environment ([13]).
Taking into consideration the purposes of this study, we selected an index based on the count of days with precipitation above the 20mm threshold ([15]). The R20 index measures the frequency of heavy precipitation events, and is defined as the number of
days per year with precipitation amount above or equal to 20mm.
Figure 1. Study region and stations’ locations
As other extreme precipitation indices, the R20 index is sensitive to the number of missing days, thus the selected stations satisfy the following criterion. The daily records are as complete as possible, with less than 16% of data missing in each year. Hence, for each station, the R20 index for a specific year was set to missing if there were more than 16% of the days missing for that year ([10]).
3. Methodological framework and
implementation issues
3.1. Direct sequential cosimulation
Sequential simulation is a widely used tool for obtaining a set of equiprobable simulated realizations of variables from natural phenomena, honoring their spatial distribution and uncertainty. While sequential indicator simulation (SIS) and sequential Gaussian simulation (SGS) require the transformation of original variables, direct sequential simulation (DSS) has been proposed ([12]) for simulating directly in the original data space and does not rely on multi-Gaussian assumptions. [12] showed that for the sequential simulation algorithm to reproduce a specific covariance model it suffices that simulated values are drawn from local distributions centered at the simple kriging estimates with a variance corresponding to the simple kriging estimation variance. This result guarantees that the spatial covariance of the original variable is reproduced but not the histogram. To overcome this limitation, [16] proposed a DSS algorithm that uses the local simple kriging estimates of the mean and variance, not to define the local cumulative distribution function (cdf) but to sample from the global cdf. Moreover, this approach allows for the joint simulation of more than one variable
without any data transformation, thus named direct sequential cosimulation (coDSS).
Instead of simulating all variables simultaneously, this approach simulates each variable in turn conditioned to the previous simulated variable. In this study, the primary variable is defined as the extreme precipitation index (R20) measured at the monitoring station’s locations, and the secondary variable is the elevation data provided by the DEM in a 800x800m grid defined over the study region.
The coDSS algorithm is thoroughly described by [16] and uses collocated simple cokriging to incorporate the exhaustive secondary information ([7], Ch. 6). In this study, the collocated cokriging was applied with the Markov-type approximation ([7], pp. 237-239), thus only the primary variable variogram and the linear correlation coefficient between primary and secondary variable was required.
3.2. Implementation
It is recognized that topography and other geographical factors are responsible for considerable spatial heterogeneity of the precipitation distribution at the sub-regional scale. [9] incorporated a DEM into the spatial interpolation of annual and monthly rainfall observations, averaged over the period of January 1970 to March 1995, and measured in the most southern region of continental Portugal (Algarve). Precipitation generally increases with elevation because of the orographic effect of mountainous terrain. The relief of Algarve, which is within our study region, is dominated by two mountainous regions. Therefore, has expected in that work, the linear correlation coefficient between annual rainfall and elevation was equal to 0.79. Moreover, [9] found that the correlation coefficient was wicker in dry months (equal to 0.33 in August).
For the implementation of the coDSS procedure, a preliminary analysis revealed that the linear correlation coefficient between the extreme precipitation index and elevation ranges from 0.24 to 0.62 within the period 1970-2000, over the study region (Figure 2). The terrain north of the Algarve region does not have high elevations, which might explain those weak to moderate correlations.
For each year, the collocated cokriging incorporated a different correlation value between the primary and secondary variable. Moreover, for each decade, the stochastic simulations used a different spherical model fitted to the experimental semivariogram of the primary variable (for further details see the Space-time
patterns section). For each decade, the histogram of
simulated values over the study area was allowed to range from zero (minimum observed value) to the maximum observed value of R20 (equal to 29, 33 and 37 days for the 70's, 80's and 90's decades, respectively) plus 10% of each maximum.
0.0 0.2 0.4 0.6 0.8 1.0 1970 1980 1990 2000 C o rr el a tion
Figure 2. Linear correlation coefficient between R20 and elevation, by year
To reproduce the spatial distribution and uncertainty of the extreme precipitation index, 100 equiprobable simulated realizations were generated through the coDSS algorithm, for each year, using the mentioned specifications. The space-time inference was then performed by means of computing the mean and the median of the distribution of the 100 simulated values at each simulated grid node, by year. Finally, uncertainty was assessed by means of computing the standard-deviation, the coefficient of variation and the inter-quartile range of the distribution of the 100 simulated values at each simulated grid node, by year.
4. Results and discussion
4.1. Space-time patterns
Experimental space-time semi-variograms were calculated for three decades (1970-79, 1980-89, and 1990-99), and spherical models fitted. The spatial dimension was modeled using an isotropic variogram. The parameters of each variogram model fitted, and the decadal average of the linear correlation coefficient between R20 and elevation, are summarized in Table 1.
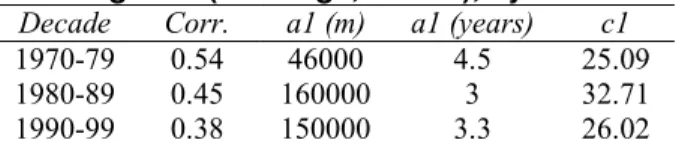
Table 1. Average correlation between R20 and elevation, and parameters of the space-time
variograms (a1: range; c1: sill), by decade
Decade Corr. a1 (m) a1 (years) c1
1970-79 0.54 46000 4.5 25.09 1980-89 0.45 160000 3 32.71 1990-99 0.38 150000 3.3 26.02
There are no apparent tendencies in what concerns the temporal component of the semi-variograms. However, the relationship between elevation and R20 has decreased along the study period (see also Figure 2), whereas there are evidences of an increase of the spatial continuity of R20 in the last decades. This evidence is consistent with the finds of [4] for other extreme precipitation indices computed for the same region within 1940-99.
4.2. Space-time inference
Using the coDSS technique, a set of 100 equiprobable simulated realizations of the extreme precipitation index (R20) was computed at each simulated grid node (800x800 m), by year. The space-time inference was performed by means of computing the mean and the median of those distributions. For illustration purposes, the results of 1974 and 1999 are presented since they correspond to the years with the maximum (0.62) and minimum (0.24) correlation coefficient between R20 and elevation, respectively.
Figure 3. Mean of the distribution of the 100 simulated values, 1974
Figure 4. Median of the distribution of the 100 simulated values, 1974
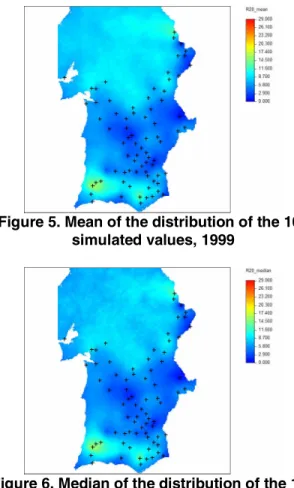
The maps of the median (Figure 4 and Figure 6) are less smoothed than the maps of the mean (Figure 3 and Figure 5). Within the study period, the higher values of the R20 index are mostly located in the two mountainous regions of Algarve, though not very evident in the maps of 1974 (Figure 3 and Figure 4).
The spatial continuity of R20 seems to be lower in the northern part of the maps because of the lack of monitoring station's data in that area. However, it is important to call attention to the fact that most of that area is out of the study region (Figure 1).
Figure 5. Mean of the distribution of the 100 simulated values, 1999
Figure 6. Median of the distribution of the 100 simulated values, 1999
The contribution of elevation to the prediction of R20 is difficult to assess, especially by just observing the maps of 1974 and 1999. Using other extreme precipitation indices, [4] concluded that 1974 was the driest year of the 1970's decade, which might explain that difficulty. Moreover, when the entire study period is analyzed, it is much more evident that elevation contributes more to the prediction of R20 when the correlation coefficient is higher, as expected.
Uncertainty was assessed by means of computing the standard-deviation (Figure 7 and Figure 10), the coefficient of variation (Figure 8 and Figure 11) and the inter-quartile range (Figure 9 and Figure 12) of the distribution of the 100 simulated values at each simulated grid node, by year.
Figure 7. Standard-deviation of the distribution of the 100 simulated values, 1974
Figure 8. Coefficient of variation of the distribution of the 100 simulated values, 1974
Figure 9. Inter-quartile range of the distribution of the 100 simulated values, 1974
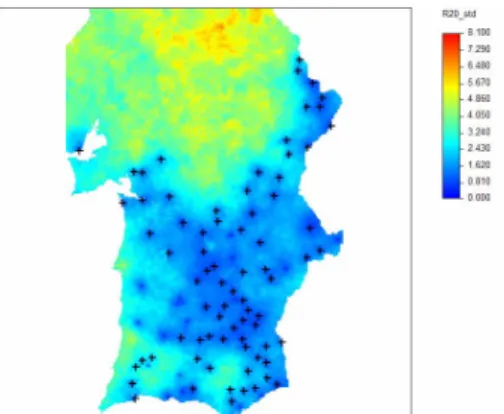
As expected, the region where the distribution of R20 has greater dispersion, thus more uncertainty, is in
the northern part of the maps, corresponding to a region less densely sampled. This is especially evident in the maps of the standard-deviation and inter-quartile range.
Figure 10. Standard-deviation of the distribution of the 100 simulated values, 1999
Figure 11. Coefficient of variation of the distribution of the 100 simulated values, 1999
Figure 12. Inter-quartile range of the distribution of the 100 simulated values, 1999
The coefficient of variation provides a relative measure of the dispersion of variable's values regardless of their units. Hence, the maps of the coefficient of variation are particularly useful because
they allow to: compare the uncertainty of R20 in different years; compare the uncertainty of R20 with other indices, whenever the same inference methodology is used; and compare the uncertainty of R20 using different inference methodologies.
5. Conclusion
The results provide evidences of an increase of the spatial continuity of the extreme precipitation index in the last decades that is consistent with the finds of [4]. The relationship between elevation and the index decreased along time. Future studies should verify if this decrease is anyhow related with the increase of the spatial continuity of the index. The influence of dry and wet periods in the relationship between elevation and the index is not clear and should be also further investigated. The direct sequential cosimulation proved to be a valuable technique to deepen the knowledge on the space-time patterns of extreme precipitation indices, because it allows incorporating secondary information into prediction and uncertainty assessment. The results of this application open perspectives for new approaches of the analysis of extreme climate events, particularly in the context of impact studies.
6. References
[1] J. Caers, "Direct sequential indicator simulation",
Proceedings of the 6th International Geostatistics Congress,
W. Kleingeld and D. Krige (eds.), Cape Town, South Africa, 2000.
[2] A.C. Costa, and A. Soares, “Identification of inhomogeneities in precipitation time series using SUR models and the Ellipse test”, Proceedings of Accuracy 2006 -
7th International Symposium on Spatial Accuracy Assessment in Natural Resources and Environmental Sciences, M. Caetano, and M. Painho (eds.), Instituto
Geográfico Português, 2006, pp. 419-428.
[3] A.C. Costa, J. Negreiros, and A. Soares, “Identification of inhomogeneities in precipitation time series using stochastic simulation”, geoENV VI – Geostatistics for Environmental
Applications, Springer, to appear.
[4] A.C. Costa, R. Durão, A. Soares, and M.J. Pereira, "A geostatistical exploratory analysis of precipitation extremes in southern Portugal", Invited paper presented at ISI 2007 –
56th Session of the International Statistical Institute, Lisbon,
Portugal, 22-29 August, 2007.
[5] C. Daly, “Guidelines for assessing the suitability of spatial climate data sets”, International Journal of
Climatology, Vol. 26, 2006, pp. 707-721.
[6] N. Diodato, “The influence of topographic co-variables on the spatial variability of precipitation over small regions of complex terrain”, International Journal of Climatology, Vol. 25, 2005, pp. 351-363.
[7] P. Goovaerts, Geostatistics for Natural Resources
Evaluation, Applied Geostatistics Series, Oxford University
Press, New York, 1997.
[8] P. Goovaerts, “Using elevation to aid the geostatistical mapping of rainfall erosivity”, Catena, Vol. 34, 1999, pp. 227-242.
[9] P. Goovaerts, “Geostatistical approaches for incorporating elevation into the spatial interpolation of rainfall”, Journal of Hydrology, Vol. 228, 2000, pp.113-129. [10] M.R. Haylock, and C.M. Goodess, “Interannual variability of European extreme winter rainfall and links with mean large-scale circulation”, International Journal of
Climatology, Vol. 24, 2004, pp. 759-776.
[11] Y. Hundecha, and A. Bárdossy, “Trends in daily precipitation and temperature extremes across western Germany in the second half of the 20th century”,
International Journal of Climatology, Vol. 25, 2005, pp.
1189-1202.
[12] A.G. Journel, "Modelling uncertainty: some conceptual thoughts", Geostatistics for the Next Century, R. Dimitrakopoulos (ed.), Kluwer Academic Pub., Dordrecht, The Netherlands, 1994, pp. 30-43.
[13] A.M.G. Klein Tank, and G.P. Können, “Trends in indices of daily temperature and precipitation extremes in Europe, 1946–99”, Journal of Climate, Vol. 16, 2003, pp. 3665-3680.
[14] R. Lázaro, F.S. Rodrigo, L. Gutiérrez, F. Domingo, and J. Puigdefábregas, “Analysis of a 30-year rainfall record (1967–1997) in semi–arid SE Spain for implications on vegetation”, Journal of Arid Environments, Vol. 48, 2001, pp. 373-395.
[15] T.C. Peterson, C. Folland, G. Gruza, W. Hogg, A. Mokssit, and N. Plummer, Report on the activities of the
Working Group on Climate Change Detection and Related Rapporteurs 1998–2001. World Meteorological
Organization, WCDMP-No. 47 / WMO-TD No. 1071, Geneva, Switzerland, 2001.
[16] A. Soares, “Direct Sequential Simulation and Cosimulation”, Mathematical Geology, Vol. 33, 2001, pp. 911-926.