Ciência Téc. Vitiv. 30(1) 9-20. 2015
9
This is an Open Access article distributed under the terms of the Creative Commons Attribution License
(http://creativecommons.org/licenses/by/4.0), which permits unrestricted use, distribution, and reproduction in any medium, provided the original work is properly cited.
YIELD AND QUALITY RESPONSES OF ‘ARAGONEZ’ GRAPEVINES UNDER
DEFICIT IRRIGATION AND DIFFERENT SOIL MANAGEMENT PRACTICES IN A
MEDITERRANEAN CLIMATE
RENDIMENTO E QUALIDADE DA PRODUÇÃO DA CASTA ‘ARAGONEZ’ SOB REGA DEFICITÁRIA E DIFERENTES CONDIÇÕES DE COBERTURA DO SOLO NUM CLIMA MEDITERRÂNICO
Alexandra Tomaz1*, José Miguel Coleto Martinez2 and Carlos Arruda Pacheco3
1 Escola Superior Agrária, Instituto Politécnico de Beja, Rua Pedro Soares, 7800-295, Beja, Portugal. 2 Escuela de Ingenierias Agrárias, Universidad de Extremadura, Badajoz, Spain, e-mail: [email protected]
3 Instituto Superior de Agronomia, Universidade Técnica de Lisboa, Tapada da Ajuda, 1349 Lisbon, Portugal, e-mail: [email protected]
*corresponding author: Tel:+351284314300, fax: +351284388207, e-mail: [email protected]
(Received 19.12.2014. Accepted 05.05.2015)
SUMMARY
In Mediterranean-type climates, increased irrigation efficiency is a key goal for viticulture, as it is for fruit production in general. The objective of the present study was to determine the responses of yield, berry composition, and wine quality to various degrees of irrigation supply and different soil management practices in a vineyard. Data were collected during two years from ‘Aragonez’ grapevines (Vitis vinifera L. syn. ‘Tempranillo’). The experimental site was located in a private vineyard in the Baixo Alentejo, southern Portugal. The vineyard is grown on vertisols, with drip irrigation. In the 4 ha area under study, a cover crop in the interrow was sown in half the plots, with the permanent resident vegetation maintained in the other half. The irrigation treatments were: high water availability (200 mm annual irrigation supply); moderate water availability (150 mm annual irrigation supply); deficit irrigation (100 mm annual irrigation supply); ultra-deficit irrigation (50 mm annual irrigation supply); rainfed. The deficit and ultra-deficit irrigation treatments were conducted in accordance with the Regulate Deficit Irrigation (RDI) strategy. The vine's vegetative growth and yield responses influenced by irrigation in both years were: pruning weight, yield, and cluster weight. The quality responses were different in the two years of study: the grape composition parameters that showed significant differences were few and different each year; in wine composition, only in 2008 was the effect of irrigation on titratable acidity proven. Vegetative growth and yield were lower in the presence of the sown cover crop. The composition of grapes and wine was mostly affected by the surface cover in 2008, with the best performance for the phenolic compounds corresponding to plants growing on plots with permanent sown cover crop. The phenolic component in grapes benefited from the presence of the sown cover crop and the successful application of the RDI strategy.
RESUMO
Em climas do tipo mediterrânico, o aumento da eficiência de rega é um objetivo fundamental para a viticultura e para a fruticultura em geral. Neste estudo, pretendeu-se determinar as respostas produtivas, quantitativas e qualitativas, a diferentes dotações de rega e a dois tipos de condições de cobertura do solo na entrelinha de uma vinha. Os dados foram recolhidos durante dois anos em videiras da casta Aragonez (Vitis vinifera L. syn. ‘Tempranillo’). O ensaio realizou-se numa vinha privada no Baixo Alentejo, Sul de Portugal. A vinha desenvolve-se em vertissolos e é regada por gota-a-gota. Em metade da área do ensaio, com um total de 4 ha, foi semeada uma mistura de leguminosas e gramíneas na entrelinha. Na restante área, o solo revestiu-se de vegetação espontânea. As dotações de rega ensaiadas foram: conforto hídrico elevado (dotação anual de 200 mm); conforto hídrico moderado (dotação anual de 150 mm); rega deficitária (dotação anual de 100 mm); rega ultra-deficitária (dotação anual de 50 mm); sequeiro. Os tratamentos de rega ultra-deficitária e ultra-ultra-deficitária foram conduzidos de acordo com a estratégia de Rega Deficitária Controlada (RDI). As respostas vegetativas e os componentes quantitativos da produção influenciados pela rega em ambos os anos de ensaio foram: o peso da lenha de poda, a produção/ha, o peso por cacho. As respostas qualitativas foram diferentes nos dois anos de ensaio: os parâmetros de composição das uvas que mostraram diferenças significativas foram poucos e discordantes em cada ano; na composição do vinho, apenas em 2008 se comprovou efeito da rega na acidez total. Em 2008, o desenvolvimento vegetativo e o rendimento foram significativamente inferiores nas parcelas enrelvadas. A composição das uvas e a composição do vinho foi mais influenciadas pelo enrelvamento em 2008, destacando-se a melhor performance para os compostos fenólicos nas uvas das videiras implantadas nas parcelas com cover crop semeado. A componente fenólica nas uvas beneficiou da presença de enrelvamento semeado na entrelinha e do sucesso na aplicação da estratégia RDI.
Key words: Vitis vinifera L.; irrigation; cover crop; vertisols. Palavras-chave: Vitis vinífera L.; rega; enrelvamento; vertissolos.
10
INTRODUCTION
The grapevine (Vitis vinifera L.) is considered a temperate region plant, but is adaptable to diverse weather conditions. Its cultivation is spread over most of the planet, but about 60% of the area of vineyards is located in Europe (OIV, 2008). Climate is a key element in grape and wine quality. It is primarily responsible for much of the diversity of cultivars together with the variability, quality, and authenticity of the wines (Tonietto and Carbonneau, 2004; Deloire
et al., 2005, Ojeda, 2007a). There are a number of
factors such as variety, cloning, training system, age, meso-climate, soil characteristics, and irrigation, which determine the quality potential of a vineyard (Medrano et al., 2003). In a particular vineyard, there will be an optimal performance for which the quality obtained is maximal. This model is valid for any qualitative parameter considered, such as sugar concentration, polyphenol content, aromatic potential, or fruit health (Ojeda, 2007b).
The wine sector is currently facing changes in consumer demands. Not only a sensorially pleasant product is expected, but it must also be healthy and produced in an environmentally sustainable way. Among the environmental problems associated with viticulture, water scarcity in Summer is critical in the countries of the Mediterranean climate (Olesen and Bindi, 2002; Laget et al., 2008; Flexas et al., 2010, Malheiro et al., 2010).
As a result of the plant's physiological and adaptive characteristics, vine vigour and yield are greatly affected by water availability in the soil. In regions with frequent summer droughts, irrigation is an important management tool to improve and regulate yield and quality (Oliveira, 1995; Barroso, 2002; Esteban et al., 2002; Goodwin, 2002; Cifre et al., 2005; Keller, 2005; Martínez-Cutillas et al., 2007; Ojeda, 2007a; Williams et al., 2010). Also, it is generally accepted that, in order to obtain quality, especially in red varieties, a moderate water stress is desirable in some phases of their growing cycle. The goal is to control vegetative growth and favour the synthesis of quality compounds (Payan and Salançon, 2004; Martínez-Cutillas et al., 2007; Ojeda, 2007a). An unlimited amount of soil moisture in some growth stages stimulates vigour, creating a dense vegetative canopy, thereby inducing excessive shading of the grapes, delaying their maturation as well as favouring the competition between leaves and fruit for assimilates. Conversely, growth may stop with severe water stress, depending on the time of occurrence
(Carbonneau, 2004; Keller, 2005; Pellegrino et al., 2006).
In areas with low rainfall, the knowledge of soil and plant water status, and of the effect of stress on the different stages of plant development, is the basis of a currently widespread irrigation strategy, Regulated Deficit Irrigation (RDI). With RDI two objectives can be achieved: the parsimonious use of water and the control of water availability throughout the development cycle of the plant. In the latter case, the intention is to prevent an excess of water during certain stages of the growth cycle, which would negatively affect the quality of the grapes. This strategy favours the occurrence of essentially two periods of water stress: after berry setting and after veraison. The former aims at growth and cell division control, promoting smaller berries, less compact clusters, and a greater skin/pulp ratio; the latter is intended to increase the concentration of anthocyanins and flavonoids. The evaluation of the opportunity to apply water stress may be conducted using information on soil moisture status and detailed information about the plant water status. However, the effectiveness of the development of water stress in the plant relies not only on the fraction of water consumption but also on the soil water storage capacity, on meteorological conditions, and root expansion (Pacheco, 1989; Reynolds and Naylor, 1994; Girona et al., 2005; Tomaz, 2012). The major constraint to the success of this type of irrigation management occurs in regions where the late rain in spring keeps the soil moist during the flowering stage. This happens in soils with physical and chemical properties that cause high water retention and desiccation delay (Barroso, 2002; Wample, 2002; Lopes et al., 2011). As irrigating early in the vine’s cycle may induce excessive vegetative growth, leading to poor quality production, this productive response is also expected when vines are established in deep soils with high post-flowering water availability. Studies conducted in non-irrigated vineyards have established a relationship between the water storage capacity of the soil and the quality components of the wine produced (Koundouras et al., 2006; Tomaz, 2012). These studies have shown that grapevines subjected to different water regimes resulting from soils with different water storage exhibit differences in yields and final product composition.
In contrast to annual crops, rainfed vineyards in a Mediterranean climate can maintain transpiration during the summer due to sparser coverage fraction, which restricts the potential loss of water.
11 Furthermore, the deepening of their roots provides larger quantities of available water (Winkler et al., 1974, Pacheco, 1989; Trambouze and Voltz, 2001; Gouveia et al., 2012; Tomaz, 2012). In conditions of high water availability, typical of deep soils of fine texture, the use of cover crops in the interrow is a tool to generate competition for water in order to restrain the water consumption and thereby reduce the vine vegetative expansion and contribute to the final product quality (Celette et al., 2005; Monteiro and Lopes, 2007; Celette et al., 2008; Wheaton et al., 2008; Furie, 2010; Cruz et al., 2012). The redistribution of the root system of species in competition for a given resource was named by Miller (1986) "Compensatory growth". In the case of vines, this mechanism is related to its roots plasticity and ability to explore the deeper soil layers, as surface layers progressively dry. Cover crops may have two, apparently opposed, functions: first, during the rainy season, promoting the reduction of surface runoff, and therefore providing additional soil water storage; secondly, it develops earlier, before the vine cycle, taking precedence on water consumption in the surface layers of the interrow (Cellete et al., 2008). There are some studies that provide insight into the effects of intercropping systems on water consumption and the productive responses in rainfed vineyards (Afonso et al., 2003; Celette et al., 2005, Monteiro and Lopes, 2007; Celette et al., 2008; Lopes
et al., 2008). Irrigation is expected to cause dynamic
alterations in water relationships between the vines and the cover crops, both at the surface and at depth, as well as within and between rows (Lopes et al., 2011; Tomaz, 2012). To address these issues, the water extraction from a vineyard with drip irrigation was analysed. Yield, vegetative growth, and quality responses to different amounts of irrigation water and to different surface covers were compared.
MATERIAL AND METHODS Experimental site and design
The experiment was carried out during two years (2007–2008) in a vineyard located in the region of Baixo Alentejo, southern Portugal. Four test plots, each with an area of 1 ha, were defined (Figure 1). In two of them a cover crop was sowed in the interrow (CC), and two were left with permanent resident vegetation (VE). Since the plots were also distinguished by soil type, each plot corresponds to a unit consisting of a soil management practice and a soil type. There were two soil types: soil type I was located in the higher area of the vineyard and soil type II in the lower, next to a waterway, an area of fine material accumulation. Although they were both
vertisols, they exhibit some differences in depth, clay content, and differentiation of horizons, with soil type II being the deeper and having the greater clay content. Thereby, plots VEI and CCI were located in the higher area, on soil type I, with plots VEII and CCII being on soil type II, in the lower area of the vineyard.
Figure 1. Experimental design. VEI – Permanent resident
vegetation x Soil type I; VEII – Permanent resident vegetation x Soil type II; CCI – Permanent sown cover crop x Soil type I; CCII
– Permanent sown cover crop x Soil type II. A - 200 mm annual irrigation supply; B - 150 mm annual irrigation supply; C - 50 mm annual irrigation supply; D - 100 mm annual irrigation supply; SE
– Rainfed.
Delineamento experimental. VEI – Vegetação espontânea x Solo tipo I; VEII – Vegetação espontânea x Solo tipo II; CCI – Cover crop semeado x Solo tipo I; CCII – Cover crop semeado x Solo tipo
II. A - 200 mm de dotação de rega anual; B - 150 mm de dotação de rega anual; C - 50 mm de dotação de rega anual; D - 100 mm
de dotação de rega anual; SE – Sequeiro.
Within each plot, two parallel zones were identified, each one with five sub-plots corresponding to different irrigation treatments. The irrigation treatments were: high water availability (A - 200 mm annual irrigation supply); moderate water availability (B - 150 mm annual irrigation supply); deficit
12 irrigation (D - 100 mm annual irrigation supply, matching the annual amount normally provided by the farmer); ultra-deficit irrigation (C - 50 mm annual irrigation supply); rainfed (SE). Data of yield and of quality responses for the SE treatment were only obtained in the second year of the study.
Plant material
The vineyard of the trial was ‘Aragonez’ grafted onto SO4 rootstock, planted in 2001, spaced at 2.8 m × 1 m, trained in a vertical shoot positioning and pruning on a bilateral Royat cordon.
In the cover crop plots, the cover crop was sown in November 2006, initially with a blend of grass, mostly rye-grass (Lollium L.), and legumes. In the following years, the cover was reconstituted after the first rains of September. In 2008, the vegetative cover was dominated by auto-regenerated legumes, especially alfalfa (Medicago sativa L.).
In the resident vegetation plots, different species of rye-grass (Lollium L.) were dominant, but spontaneous Trifolium L. and Rumex L. could also be found.
Water supply
Irrigation water was applied by an automatic drip irrigation system, programmed through electrovalves. The start of irrigation took place when pre-dawn leaf water potential (Ψpd) values ranged from -0.3 to -0.4 MPa. Irrigation frequency was adjusted by taking into account the Ψpd values of the least irrigated water treatment. Second and third irrigations were applied when Ψpd approached -0.5 MPa. For the following irrigations, Ψpd values of -0.6 to -0.7 MPa were considered. In 2007, seven irrigations were applied, three in July and the remaining in August. The first irrigation took place on July 10 and the last on August 22. In 2008, only 4 irrigations took place, starting on June 30 and ending on August 8.
Plant water status
The pre-dawn leaf water potential of the vines referred above was measured periodically using a pressure chamber (Model 1000, PMS Instrument Co., Albany, OR, USA). Measurements were carried out in each plot and irrigation treatment on two adult and well exposed leaves, located in the middle third of the canopy. Measurements began in mid-June, near bunch closure, and ended a few days before harvest.
Soil water content
Soil moisture status was monitored using a neutron probe (TROXLER® 4300, Troxler Electronic Laboratories, Inc., Durham, NC, USA). Data from 63 access tubes was collected. The tubes location was
the following: twelve tubes in sub-plots of A irrigation treatment; eleven tubes in sub-plots of B irrigation treatment; twelve tubes in sub-plots of C irrigation treatment; eight tubes in sub-plots of D irrigation treatment; ten tubes in sub-plots of rainfed treatment. The remaining ten were equally distributed in the interrows of the different sub-plots. The tubes were installed from 1.70 m to 2.70 m depth, the latter being the ones located between the rows. This monitoring was conducted every two or three weeks until the start of irrigation, and every week thereafter. Based on the data collected the soil moisture content evolution was determined, from which the desiccation profiles through the vine growth cycle were obtained, according to the method described in Pacheco (1989), where the maximum and minimum water content profiles are evaluated, considered the maximum storage and desiccation, respectively. The temporal evolution of the available soil water (ASW) was determined using (Eq. 1):
, í , (Eq. 1) where ASWi = available soil water on day i (mm);
h(0-270cm),i = soil water depth on day i (mm); h
(0-270cm),Min = maximum soil desiccation (mm).
Surface vegetation biomass
In 2007, two samples in each sub-plot were collected in the sown cover crop plots. In the following year the sampling included resident vegetation plots. The method consisted of cutting vegetation delimited by a 0.25 m² square quadrat, followed by drying at 65ºC. Dry matter was recorded. This operation was carried out in both years a few days before cutting the vegetation cover in mid-May.
Vines growth and yield
Pruning weight was used as an indicator of vine growth. Yield was expressed as average weight per hectare. The following yield components were also registered: number of clusters per vine and average weight per cluster. To monitor the vegetative growth and yield components, control areas of twenty vines, grouped in pairs formed by contiguous plants were fixed in each sub-plot.
Fruit and wine composition
The juice from the collected berries was analysed for soluble solids (°Brix), pH, titratable acidity, determined according to OIV (2014) procedures, and total polyphenol index, total anthocyanins, and tannin content (only in 2007), determined according to Cabrita et al. (2003). The following parameters were determined in wine: alcohol content, pH, titratable acidity (tartaric acid concentration), and volatile
13 acidity (acetic acid concentration), determined according to OIV (2014) procedures.
Statistical analysis
An ANOVA for two factors (surface cover and soil type versus applied irrigation water) was performed using the GLM procedures of the PASW® Statistics 18 software (SPSS Inc.®, IBM Corporation, New York, USA). The surface vegetation biomass was analysed by performing an ANOVA for a single factor (surface cover and soil). Differences between means were compared using Tukey’s test (p<0.05). Analyses were performed separately for each year.
RESULTS AND DISCUSSION Surface vegetation biomass
The vegetation biomass in the CC plots was very different in the two years tested: in 2007, the overall average was 1.6 t/ha, increasing to an average of 5.8 t/ha in 2008. In this second year of the study, there was a clear difference between the biomass produced by the sown cover crop and that produced by permanent resident vegetation (Table I).The values show that, in both soils studied, the sown cover crop produces on average about 2.5 times more biomass.
Table I
Effect of surface cover × soil type on surface vegetation biomass expressed as total dry matter.
Efeito do cultivo de cobertura x tipo de solo na biomassa aérea do cultivo de cobertura expressa como matéria seca total.
Year Variation source Total dry matter (g/m2)
2007 Surface cover × soil type ns
CCI 142.33 CCII 178.55
2008 Surface cover × soil type *
VEI 330.56b
VEII 333.18b
CCI 807.70a
CCII 837.54a
Different letters indicate statistically significant differences at p < 0.05 by Tukey’s test; * - significance at p < 0.05; ns - no significance at p < 0.05. VEI – Permanent resident vegetation x Soil type I; VEII – Permanent resident vegetation x Soil type II; CCI – Permanent sown cover crop x Soil type I; CCII – Permanent sown cover crop x Soil type II
During the first year, legumes became dominant in the CC plots. Due to unstable weather conditions, and subsequently because the vegetation was flowering, we decided not to cut at this stage in order not to jeopardize the self-regeneration of the cover crop. Therefore, seed production was high, resulting in excessive growth the following year.
Vine growth stages
The vine’s development stages were recorded (Table II). The growth cycle of the two years was similar. The differences occurred mainly in the early stages, with a small delay in 2007.
Table II
Start dates of the vineyard phenological stages each year. Datas de início dos estados fenológicos da vinha em cada ano.
Year Bud burst Bloom Bunch closure Veraison Harvest
2007 15-Mar 20-May 25-Jun 19-Jul 29-Aug
2008 5-Mar 13-May 25-Jun 20-Jul 21-Aug
Plant water status
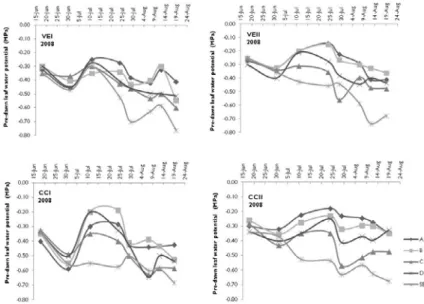
In both years, pre-dawn leaf water potential values remained at levels that are favourable to the vine water status (Carbonneau, 2004; Ojeda, 2007a). In 2007, in response to an irrigation performed on August 14, values considered unfavourable were recorded in the A and B treatments, indicative of an
excess of available water during ripening (Figure 2). In 2008, for both types of surface cover on soil type II, pre-dawn leaf water potential remained above 0.3 MPa, reflecting the effect of the irrigation applied on July 30 and August 8. In rainfed plots with resident vegetation, the values decreased below 0.7 MPa, corresponding to excessive drying of the soil (Figure
14 3). In general, during the monitoring period, the ultra-deficit and ultra-deficit treatments showed predawn values corresponding to optimal water restriction in
agreement with Carbonneau (2004) and Ojeda (2007 a)
Figure 2. Effect of surface cover and soil type and of applied irrigation water on the pre-dawn leaf water potential during 2007. Each point
represents the mean of 2 records. VEI – Permanent resident vegetation x Soil type I; VEII – Permanent resident vegetation x Soil type II; CCI – Permanent sown cover crop x Soil type I; CCII – Permanent sown cover crop x Soil type II. A - 200 mm annual irrigation supply; B - 150 mm
annual irrigation supply; C - 50 mm annual irrigation supply; D - 100 mm annual irrigation supply.
Efeito do tipo de cultivo de cobertura x tipo de solo e da dotação de rega no potencial hídrico de base durante 2007. Cada ponto representa a média de 2 registos. VEI – Vegetação espontânea x Solo tipo I; VEII – Vegetação espontânea x Solo tipo II; CCI – Cover crop semeado x Solo tipo I; CCII – Cover crop semeado x Solo tipo II. A - 200 mm de dotação de rega anual; B - 150 mm de dotação de rega anual; C - 50 mm de
dotação de rega anual; D - 100 mm de dotação de rega anual.
Figure 3. Effect of surface cover and soil type and of applied irrigation water on the pre-dawn leaf water potential during 2008. Each point
represents the mean of 2 records. VEI – Permanent resident vegetation x Soil type I; VEII – Permanent resident vegetation x Soil type II; CCI – Permanent sown cover crop x Soil type I; CCII – Permanent sown cover crop x Soil type II. A - 200 mm annual irrigation supply; B - 150 mm
annual irrigation supply; C - 50 mm annual irrigation supply; D - 100 mm annual irrigation supply; SE - Rainfed.
Efeito do tipo de cultivo de cobertura x tipo de solo e da dotação de rega no potencial hídrico de base durante 2008. Cada ponto representa a média de 2 registos. VEI – Vegetação espontânea x Solo tipo I; VEII – Vegetação espontânea x Solo tipo II; CCI – Cover crop semeado x Solo tipo I; CCII – Cover crop semeado x Solo tipo II. A - 200 mm de dotação de rega anual; B - 150 mm de dotação de rega anual; C - 50 mm de
Ciência Téc. Vitiv. 30(1) 9-21. 2015
15
Water uptake
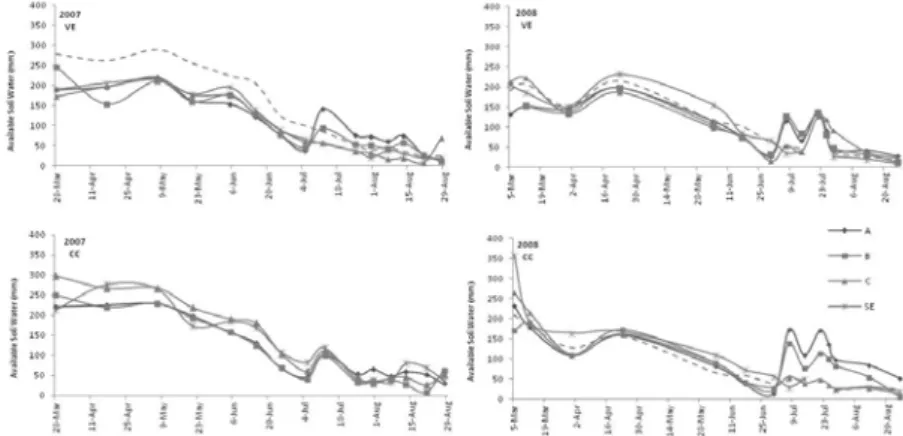
In 2006/2007, as a result of a very rainy autumn-winter period, the total rainfall was 593 mm. In 2007/2008, the rainfall totaled 474 mm. During 2007, available soil water levels were overall greater than in 2008, with the exception of SE treatment (Figure 4). The rainfall in April produced an increase in the amount of available water in the profile, more evident between rows in the resident vegetation plots. In both years, intense water extraction took place between the bunch closure and veraison stages (see Table II). Closer observation of the ASW evolution in the rainfed treatment shows that the values are very similar to those observed in the irrigated treatments. For example, in the B treatments, the average water depletion between July 12 and July 25, in the first year, was 49 mm. In SE treatments, for the same period, water extraction was 47 mm. Only in 2008,
between bunch closure and veraison, ASW in rainfed plots decreased, especially when compared with the A and B treatments. With respect to the temporal variation of water storage in the interrows, we found that prior to the start of irrigation it evolved in the same way as that registered in the rows of both the irrigated and the rainfed treatments. This means that, after cutting the vegetation between late April and early May, water in this soil compartment is depleted by the vines throughout their growth cycle. The perennial roots perform preferential extraction in the row, and the predominantly thin and flexible roots emitted each year, growing in soil cracks, developing dynamically, and adapting to the environment, are responsible for the consumption in the deeper compartments and between the rows (Winkler et al., 1974; Pacheco, 1989; Celette et al., 2008; Tomaz, 2012).
Figure 4. Average values of available water in the soil profile, considering 2.70 m soil depth, over the growth cycle in the VE and the CC plots,
for different irrigation treatments and between the rows. Irrigation started on July 10 and June 30, in 2007 and 2008 respectively. VE – Permanent resident vegetation; CC – Permanent sown cover crop. A - 200 mm annual irrigation supply; B - 150 mm annual irrigation supply; C - 50 mm
annual irrigation supply; SE - Rainfed.
Valores médios de água disponível no perfil de solo, considerando uma profundidade de solo de 2.70 m, ao longo do ciclo de desenvolvimento nas parcelas VE e CC, nos diferentes tratamentos de rega e nas entrelinhas. A rega teve início a 10 de julho e a 30 de junho, em 2007 e 2008, respetivamente. VE – Vegetação espontânea; CC – Cover crop semeado. A - 200 mm de dotação de rega anual; B - 150 mm de dotação de rega
anual; C - 50 mm de dotação de rega anual; SE – Sequeiro.
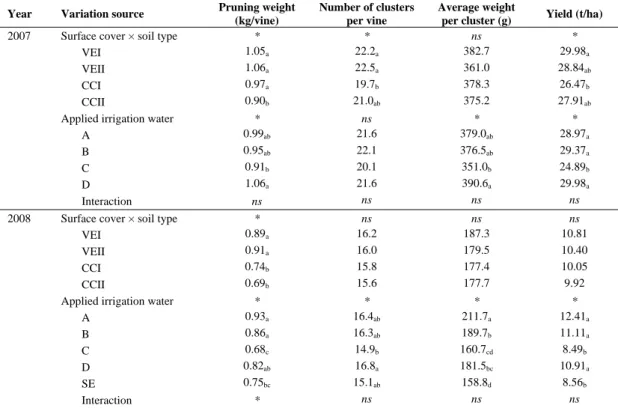
Vegetative growth and yield
Significant differences were found regarding pruning weight in both years, either due to the effect of surface cover × soil type or the effect of irrigation treatments (Table III). In 2007 and 2008, A, B and D treatments showed significantly higher values. In 2008, the amount of pruned wood in the CCI and CCII plots was significantly lower, indicating a decrease in vegetative growth resulting from competition promoted by the sown cover crop. This effect was more evident in 2008, which is in agreement with the production of the surface
vegetation biomass, discussed above. There is an interaction between the two factors that indicates that the vegetative growth of vines in sown cover crop plots increases with decreasing amounts of irrigation water. It is also possible that the lower water availability experienced by plants in 2008 as a result of a drier autumn-winter period, followed by the water extraction performed by the cover crop in the spring, induced a stronger dependence on irrigation for the vines vegetative growth.
From 2007 to 2008 there was an average reduction of 5 clusters per vine and a 190 g average decrease in
16 cluster weight. In 2007, a negative effect of surface cover × soil type on the number of clusters and in yield was confirmed in CCI plot. The number of clusters per vine was lower in the sown cover crop plots in soil I, due to the competition exerted during the early growth stages of the plants. In 2008, there
were statistical differences between irrigation treatments in both yield components as well as in yield. The greatest number of clusters per plant occurred in the deficit irrigation (D treatment), but cluster weight was lower, as also was the case with the ultra-deficit and rainfed treatments.
Table III
Effect of surface cover × soil type and of applied irrigation water on vegetative growth, on components of production and on yield. Efeito do tipo de cultivo de cobertura x tipo de solo e da dotação de rega no crescimento vegetativo, nos componentes da produção e no
rendimento.
Year Variation source Pruning weight
(kg/vine)
Number of clusters per vine
Average weight
per cluster (g) Yield (t/ha)
2007 Surface cover × soil type * * ns *
VEI 1.05a 22.2a 382.7 29.98a
VEII 1.06a 22.5a 361.0 28.84ab
CCI 0.97a 19.7b 378.3 26.47b
CCII 0.90b 21.0ab 375.2 27.91ab
Applied irrigation water * ns * *
A 0.99ab 21.6 379.0ab 28.97a
B 0.95ab 22.1 376.5ab 29.37a
C 0.91b 20.1 351.0b 24.89b
D 1.06a 21.6 390.6a 29.98a
Interaction ns ns ns ns
2008 Surface cover × soil type * ns ns ns
VEI 0.89a 16.2 187.3 10.81
VEII 0.91a 16.0 179.5 10.40
CCI 0.74b 15.8 177.4 10.05
CCII 0.69b 15.6 177.7 9.92
Applied irrigation water * * * *
A 0.93a 16.4ab 211.7a 12.41a
B 0.86a 16.3ab 189.7b 11.11a
C 0.68c 14.9b 160.7cd 8.49b
D 0.82ab 16.8a 181.5bc 10.91a
SE 0.75bc 15.1ab 158.8d 8.56b
Interaction * ns ns ns
Different letters indicate statistically significant differences at p < 0.05 by Tukey’s test; * - significance at p < 0.05; ns - no significance at p < 0.05. VEI – Permanent resident vegetation x Soil type I; VEII – Permanent resident vegetation x Soil type II; CCI – Permanent sown cover crop x Soil type I; CCII – Permanent sown cover crop x Soil type II. A - 200 mm annual irrigation supply; B - 150 mm annual irrigation supply; C - 50 mm annual irrigation supply; D - 100 mm annual irrigation supply; SE – Rainfed.
With respect to the yield results, in both years there was a positive effect of the amount of water applied in irrigation, but the effect of surface cover × soil type was only present in 2007, with yield being significantly higher in the resident vegetation plots. From the first to the second year, the yield dropped by more than half. Compared to the typical productivity values of ‘Aragonez’ grapevines – the average yield should be around 8 to 15 tons per hectare (INRB, 2011) – in 2007 there was overproduction even in the ultra-deficit treatment. In 2008, the excessive biomass produced by the sown cover crop possibly caused an imbalance in the
vegetative growth of the vines, with consequences for the yield.
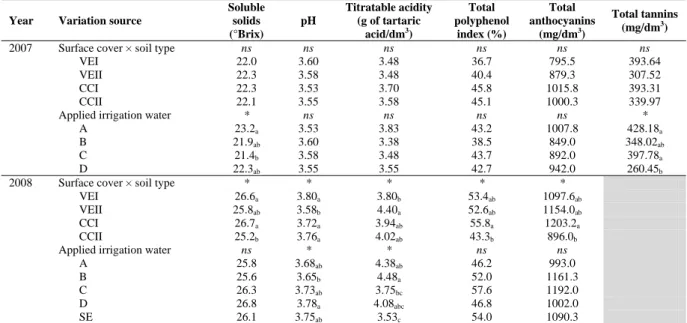
Fruit composition
There was an increase of soluble solids in the berries in 2008 compared to 2007 (Table IV). In the first year, there was a positive effect of the amount of irrigation water in the sense of an increasing quantity of soluble solids with the increase in water supply. That is, according to our results, no direct relationship between water stress and Brix degree can be effectively established, as was also found by Ojeda et
al. (2002) in their study on the effects of water stress
17 Hera Orts et al. (2005), when studying the effect of moderate irrigation on ‘Monastrell’ grapes
composition.
Table IV
Effect of surface cover × soil types and of applied irrigation water on berry composition. Efeito do tipo de cultivo de cobertura x tipo de solo e da dotação de rega na composição dos frutos.
Year Variation source
Soluble solids (°Brix) pH Titratable acidity (g of tartaric acid/dm3) Total polyphenol index (%) Total anthocyanins (mg/dm3) Total tannins (mg/dm3)
2007 Surface cover × soil type ns ns ns ns ns ns
VEI 22.0 3.60 3.48 36.7 795.5 393.64
VEII 22.3 3.58 3.48 40.4 879.3 307.52
CCI 22.3 3.53 3.70 45.8 1015.8 393.31
CCII 22.1 3.55 3.58 45.1 1000.3 339.97
Applied irrigation water * ns ns ns ns *
A 23.2a 3.53 3.83 43.2 1007.8 428.18a
B 21.9ab 3.60 3.38 38.5 849.0 348.02ab
C 21.4b 3.58 3.48 43.7 892.0 397.78a
D 22.3ab 3.55 3.55 42.7 942.0 260.45b
2008 Surface cover × soil type * * * * *
VEI 26.6a 3.80a 3.80b 53.4ab 1097.6ab
VEII 25.8ab 3.58b 4.40a 52.6ab 1154.0ab
CCI 26.7a 3.72a 3.94ab 55.8a 1203.2a
CCII 25.2b 3.76a 4.02ab 43.3b 896.0b
Applied irrigation water ns * * ns ns
A 25.8 3.68ab 4.38ab 46.2 993.0
B 25.6 3.65b 4.48a 52.0 1161.3
C 26.3 3.73ab 3.75bc 57.6 1192.0
D 26.8 3.78a 4.08abc 46.8 1002.0
SE 26.1 3.75ab 3.53c 54.0 1090.3
Different letters indicate statistically significant differences at p < 0.05 by Tukey’s test; * - significance at p < 0.05; ns - no significance at p < 0.05. VEI – Permanent resident vegetation x Soil type I; VEII – Permanent resident vegetation x Soil type II; CCI – Permanent sown cover crop x Soil type I; CCII – Permanent sown cover crop x Soil type II. A - 200 mm annual irrigation supply; B - 150 mm annual irrigation supply; C - 50 mm annual irrigation supply; D - 100 mm annual irrigation supply; SE – Rainfed.
The results for the pH and titratable acidity in berries showed that significant differences were found only in the second year. Significantly lower pH values and higher titratable acidity values were found in B irrigation treatment.
The total polyphenol index and total anthocyanin content showed similar pattern of variation. There was an increase in the values of both parameters from the first year to the second one. The results point to an inverse relationship between yield and phenolic composition in grapes, since although there was a decrease in yield in 2008, total polyphenol index and total anthocyanin content was higher in this year of the experiment. Significant differences were found only in 2008 with respect to the effect of surface cover. Both the polyphenol and the anthocyanin contents were higher in sown cover crop plots on soil type I. The amount of anthocyanins increased with increasing skin/pulp ratio. The vine growth conditions varied between the two years, with the different distribution of rainfall, reduced soil water availability, increased biomass production of the surface cover, reduced vine vegetative growth and consequent modification of leaf exposure to radiation, as referred
by Keller (2010), influenced in a positive way the synthesis of these phenolic compounds.
No significant differences were found with respect to the effect of surface cover and soil type on the concentration of tannins. With respect to the amount of irrigation water applied, the tannin concentration was higher in A and C treatments. Since no data were available in 2008, it was not possible to verify whether this trend changed in the following year with the decrease in the size of the berries, and the consequent reduction in the skin/pulp ratio.
Wine composition
The parameters assayed in the wine were more influenced by the type of surface cover than by the amount of water applied for irrigation, particularly in 2008 (Table V). In 2007, significantly differences were only found in the wine pH and volatile acidity, as an effect of the surface cover x soil type. Wine quality parameters were not significantly affected by the irrigation treatments.Between 2007 and 2008, there was a slight increase in the values of alcohol content and pH, as expected given the results for the yield and berry composition parameters.
18 The highest values of alcohol content were registered in the plots with sown cover crop on soil type I. The wine from these plots also presented significantly higher titratable acidity and lower pH. Simultaneously, the lowest values of titratable acidity were found on both soil type II plots, regardless the surface cover vegetation. Thus, the results are contradictory and not in accordance to the ones found
in grapes. As for the effect of the irrigation supply, the least acidic wines of 2008 came from the rainfed vines, where the significantly lower values of titratable acidity were registered. These results can be explained by an increased berry exposure in the vines with lower vegetative growth in the SE treatments, causing a reduction on titratable acidity.
Table V
Effect of surface cover × soil types and of applied irrigation water on wine composition. Efeito do tipo de cultivo de cobertura x tipo de solo e da dotação de rega na composição do vinho.
Year Variation source Alcohol content
(%) pH
Titratable acidity (g of tartaric acid/dm3)
Volatile acidity (g of acetic acid/dm3)
2007 Surface cover × soil type ns * ns *
VEI 12.0 3.53ab 5.88 0.525ab
VEII 11.9 3.53ab 5.93 0.530a
CCI 12.1 3.48b 6.15 0.400b
CCII 12.1 3.65a 5.73 0.428ab
Applied irrigation water ns ns ns ns
A 12.3 3.53 5.90 0.448
B 11.8 3.53 5.98 0.473
C 11.8 3.53 5.95 0.490
D 12.3 3.60 5.85 0.473
2008 Surface cover × soil type * * * *
VEI 14.8ab 3.98a 5.72b 0.414a
VEII 14.9ab 4.00a 5.32c 0.298b
CCI 15.0a 3.89b 6.16a 0.494a
CCII 14.1b 4.00a 5.38c 0.296b
Applied irrigation water ns ns * ns
A 14.4 3.93 5.70ab 0.338
B 14.6 3.98 5.85a 0.335
C 15.2 3.97 5.65ab 0.440
D 14.7 3.99 5.60ab 0.355
SE 14.7 3.97 5.43b 0.410
Different letters indicate statistically significant differences at p < 0.05 by Tukey’s test; * - significance at p < 0.05; ns - no significance at p < 0.05. VEI – Permanent resident vegetation x Soil type I; VEII – Permanent resident vegetation x Soil type II; CCI – Permanent sown cover crop x Soil Type I; CCII – Permanent sown cover crop x Soil Type II. A - 200 mm annual irrigation supply; B - 150 mm annual irrigation supply; C - 50 mm annual irrigation supply; D - 100 mm annual irrigation supply; SE – Rainfed.
CONCLUSIONS
The contribution of irrigation to the vineyard yield depends on the intra-annual distribution of the rainfall and its effectiveness in wetting the soil volume with the potential of contributing to the water supply to the vine. When the spring rains are insufficient to supply the entire soil profile, as occurred in the second year of the experiment, irrigation plays an important role in ensuring maintenance of the grapevines yield.
Water consumption in the interrows took place throughout the growth cycle. Therefore, the vines do not suspend water uptake in this soil compartment after the start of irrigation.
The statistical analysis showed that significantly higher values of pruning weight, yield, and cluster weight were found in A, B and D irrigation
treatments, showing a positive effect of irrigation, despite the contrasting characteristics of the two years with regards to yield. The vegetative growth and yield were, in general, lower in the presence of a permanent sown cover crop in the interrows, as compared to permanent resident vegetation. In the second year of the experiment, an excessive biomass production of the permanent sown cover crop caused an imbalance in the vegetative growth of the vines, with consequences for the yield, that dropped to about half in comparison to the first year.
Overall, the results showed that the parameters assayed in the fruit composition were more influenced by the type of surface cover than by the amount of water applied for irrigation, a trend that was also observed in the wine parameters, especially in 2008. The composition of the berries and the wine was particularly affected this year, with the better
19 performance in terms of phenolic compounds found in the grapevines growing in plots with sown cover crop.
ACKNOWLEDGMENTS
This study took place as part of a Portuguese research project entitled “Deficit irrigation in vineyard - Criteria for irrigation management compatible with the quality of production.” financed by the IV Priority Axis of the European Union – PEDIZA II (Integrated Development of the Alqueva Region), Action: Experimentation and demonstration of new cultural practices related to irrigation. We thank all the team members of the project. Special thanks are due to team members belonging to the National Institute for Agricultural and Veterinary Research (INIAV – Dois Portos) of Portugal, responsible for the analytical determinations on the grapes and wine.
REFERENCES
Afonso, J. M., Monteiro, A. M., Lopes, C. M., Lourenço, J., 2003. Enrelvamento do solo em vinha na região dos vinhos verdes. Três anos de estudo na casta ‘Alvarinho'. Ciência Téc. Vitiv., 18, 47-63. Barroso J.M., 2002. A rega da vinha. Uma oportunidade ou um perigo para a qualidade do vinho do Alentejo? Vinea – Revista do vinho do Alentejo, 0, 10-13.
Cabrita M.J., Ricardo-da-Silva J., Laureano O., 2003. Os compostos polifenólicos das uvas e dos vinhos. In: Proceedings of I Seminário Internacional de Vitivinicultura, 24 - 25 September 2003, Ensenada, México, 61-101.
Carbonneau A., 2004. Incidência do stress hídrico e do calor sobre a fisiología da vinha e sobre a maturação da uva. Infowine, Internet J. Vitic. Enol. [accessed 10 September 2011 in
www.infowine.com]
Celette F., Gaudin R., Gary C., 2008. Spatial and temporal changes to the water regime of a Mediterranean vineyard due to the adopting of cover cropping. Europ. J. Agronomy, 29, 153-162. Celette F., Wery J., Chantelot E., Celette J., Gary C., 2005. Belowground interactions in a vine (Vitis vinifera L.) - tall fescue (Festuca arundinacea Shreb.) intercropping system: water relations and growth. Plant and Soil, 276, 205-217.
Cifre J., Bota J., Escalona J. M., Medrano H., Flexas J., 2005. Physiological tools for irrigation scheduling in grapevine (Vitis vinifera L.). An open gate to improve water-use efficiency? Agric. Ecosyst. Environ., 106, 159-170.
Cruz A., Botelho M., Silvestre J., Castro R., 2012. Soil management: introduction of tillage in a vineyard with a long-term natural cover. Ciência Téc. Vitiv., 27, 27-38.
De La Hera Orts, M.L., Martínez-Cutillas, A., López-Roca, J.M., Gómez-Plaza, E., 2005. Effect of moderate irrigation on grape composition during ripening. Span. J. Agric. Res., 3, 352-361. Deloire A., Vaudour E., Carey V., Bonnardot V., Van LeeuWen C, 2005. Grapevine responses to terroir: a global approach. J. Int. Sci. Vigne Vin, 39, 149-162.
Esteban M.A., Villanueva M.J., Lisarrague J.R., 2002. Relationships between different berry components in Tempranillo (Vitis vinifera L.) grapes from irrigated and non-irrigated vines during ripening. J. Sci. Food Agric., 82, 1136-1146.
Flexas J., Galmés J., Gallé A., Gulías J., Pou A., Ribas-Carbo M., Medrano H., 2010. Improving water use efficiency in grapevines: potential physiological targets for biotechnological improvement. Aust. J. Grape Wine Res., 16, 106-121.
Furie J.C., 2010. Soil management in the Breede River Valley wine grape region, South Africa. 1. Cover crop performance and weed control. S. Afr. J. Enol. Vitic., 31, 14-21.
Girona J., Gelly M., Mata M., Arbonés A., Rufat J., Marsal J., 2005. Peach tree response to single and combined deficit irrigation regimes in deep soils. Agric. Water Manag., 72, 97-108.
Goodwin I., 2002. Managing water stress in grape vines in Greater Victoria. Agriculture Notes, November 2002. 4 p. Department of primary Industries, Victoria.
Gouveia J., Lopes C.M., Pedroso V., Martins S., Rodrigues P., Alves I., 2012. Effect of irrigation on soil water depletion, vegetative growth, yield and berry composition of the grapevine variety Touriga Nacional. Ciência Téc. Vitiv., 27, 115-122. INRB – Instituto Nacional de Recursos Biológicos, 2011. Aragonez. [accessed 7 September 2011 in http://www.inrb.pt] Keller M., 2005. Estratégias de irrigação de uvas brancas e tintas. 33rd Annual New York Wine Industry Workshop. Infowine, Internet J. Vitic. Enol. [accessed 10 September 2011 in
www.infowine.com]
Keller M., 2010. Managing grapevines to optimize fruit development in a challenging environment: a climate change primer for viticulturists. Aust. J. Grape Wine Res., 16, 56-69. Koundouras S., Marinos V., Gkoulioti A., Kotseridis Y., Van Leeuwen C., 2006. Influence of vineyard location and vine water status on fruit maturation on nonirrigated Cv. Agiorgitiko (Vitis vinifera L.). Effects on wine phenolic and aroma components. J. Agric. Food Chem., 54, 5077-5086.
Laget F., Tondut J. L., Deloire A., Kelly M. T., 2008. Climate trends in a specific Mediterranean viticultural area between 1950 and 2006. J. Int. Sci. Vigne Vin, 42, 113-123.
Lopes C.M., Monteiro A., Machado J.P., Fernandes N., Araújo A., 2008. Cover cropping in a sloping non-irrigated vineyard: II – Effects on vegetative growth, yield, berry and wine quality of ‘Cabernet Sauvignon’ grapevines. Ciência Téc. Vitiv., 23, 37-43. Lopes C.M., Santos T.P., Monteiro A., Rodrigues M.L., Costa J.M., Chaves M.M., 2011. Combining cover cropping with deficit irrigation in a Mediterranean low vigor vineyard. Sci. Hortic., 129, 603-612.
Malheiro A.C., Santos J.A., Fraga H., Pinto J., 2010. Climate change scenarios applied to viticultural zoning in Europe. Clim. Res., 43, 163-177.
Martínez-Cutillas A., Romero P., Fernández J.I., 2007. Técnicas de riego deficitario en el cultivo de la vid. Vida Rural, 244.
Medrano H., Escalona J.M., Cifre J., Bota J., Flexas J., 2003. A ten-year study on the physiology of two Spanish grapevine cultivars under field conditions: effects of wáter availability from leaf photosynthesis to grape yield and quality. Funct. Plant Biol.,
30, 607-619.
Monteiro A., Lopes C. M., 2007. Influence of cover crop on water use and performance of vineyard in Mediterranean Portugal. Agric. Ecosyst. Environ., 121, 336-342.
20 Miller D. E., 1986. Root systems in relation to stress tolerance. HortScience, 21, 963-970.
OIV, 2008. World Statistics. OIV Report on the state of the vitivinivulture world market. Organisation International de la Vigne et du Vin, Paris.
OIV, 2014. Compendium of International Methods of Analysis of Wines and Musts (2 vol.). Organisation Internationale de la Vigne et du Vin, Paris.
Ojeda H., 2007a. Riego cualitativo de precisión en la vid. Revista Enologia, 1, 14-17.
Ojeda H., 2007b. Como se relaciona la calidad de la uva y del vino con el rendimiento del viñedo? Revista Enologia, 6.
Ojeda H., Andary C., Kraeva E., Carbonneau A., Deloire A., 2002. Influence of pre and postveraison water deficit on synthesis and concentration of skin phenolic compounds during berry growyh of Vitis vinifera cv. Shiraz. Am. J. Enol. Vitic., 53, 261-267.
Olesen J.O., Bindi M., 2002. Consequences of climate change for European agricultural productivity, land use and policy. Europ. J. Agronomy, 16, 239-262.
Oliveira M., 1995. Efeitos da disponibilidade de água no solo nas produções da casta Touriga Francesa na Região Demarcada do Douro (Cima-Corgo). Ciência Tec. Vitiv., 12, 59-71.
Pacheco C.A., 1989. Influência de técnicas de não mobilização e de mobilização sobre aspectos estruturais e hídricos de solos com vinha, bem como sobre o respectivo sistema radical. Consequências das relações hídricas solo-vinha na produção. 423 p. Ph.D Dissertation, Instituto Superior de Agronomia, Universidade Técnica de Lisboa.
Payan J.C., Salançon E., 2004. Definir o regime hídrico das parcelas. Infowine, Internet J. .Vitic. Enol. [accessed 10 September 2011 in www.infowine.com]
Pellegrino A., Gozé E., Lebon E., Wery J., 2006. A model-based diagnosis tool to evaluate the water stress experienced by grapevine in field sites. Europ. J. Agronomy, 25, 49-59.
Reynolds A.G., Naylor A.P., 1994. ‘Pinot noir’ and ‘Riesling’ grapevines respond to water stress duration and soil water-holding capacity. Hortic.Sci., 29, 1505-1510.
Tomaz A., 2012. La alimentación hídrica de la variedad Aragonez (Vitis vinífera L.) en vertissuelos regados, con y sin cultivo de cobertura: efectos del riego en la producción y en la dinámica de extracción de agua. 196 p. Ph.D Dissertation, Universidad de Extremadura.
Tonietto J., Carbonneau A., 2004. A multicriteria climatic classification system for grape-growing regions worldwide. Agric. Forest Meteo., 124, 81-97.
Trambouze W., Voltz M., 2001. Measurement and modelling of the transpiration of a Mediterranean vineyard. Agric. Forest Meteo.,
107, 153-166.
Wample R. L., Smithyman R., 2002. Regulated deficit irrigation as a water management strategy in Vitis vinifera production. In: Deficit Irrigation Practices. 89-100. Water Report, 22. Rome: Food and Agriculture Organization of the United Nations.
Wheaton A. D., McKenzie B. M., Tisdall J. M., 2008. Management to increase the depth of soft soil improves soil conditions and grapevine performance in an irrigated Vineyard. Soil Till. Res., 98, 68-80.
Williams L.E., Grimes D.W., Phene C.J., 2010. The effects of applied water at various fractions of measured evapotranspiration on reproductive growth and water productivity of Thompson Seedless grapevines. Irrig. Sci., 28, 233-243.
Winkler A.J., Cook J.A., Kliewer W.M., Lider L.A., 1974. General viticulture. Revised and enlarged edition. 710 p. University of California Press, London.