Business Intelligence for Detection of Anomalies in
Records of Fueling
A case study on automobiles used for illegal fuel storage in Bolivia
Vanessa Adriana Gironda Aquize1 orcid.org/0000-0001-9792-0396
Mailson Melo dos Santos Filho2 orcid.org/0000-0001-5727-2427
1 Escola Politécnica de Pernambuco, Universidade de Pernambuco, Recife, Brasil. 2 Fábrica de Negócios – Analytics & Data Mining, Recife, Pernambuco, Brasil.
E-mail do autor principal: vanessa.gironda@gmail.com
Abstract
At present, in any organization it is necessary to make decisions, very strategic meetings to achieve a satisfactory development. It is the case of the National Hydrocarbon Agency of Bolivia (ANH), that due the smuggling of fuel, implemented the RFID technology in order to register the records of fueling of all fleet vehicular. From this, a model of Anomaly Detection in records of fueling was proposed trough machine learning techniques. Nevertheless, the huge volume of information about anomalies scores in a local and global level needs to analyzed and take decisions (e.g. strict control in some risk zones according variables analyzed). The collection and analysis of this information, given its heterogeneous character and its volume, usually become a problem for the government institution and this is where Business Intelligence (BI) intervenes, through the Systems of Support of "human decision-making". Today there are many BI solutions, being the Open Source Pentaho Business Intelligence platform one of the most used currently. This management platform covers data analysis and reporting operations, making this a flexible solution to cover our study case: "Anomaly Detection in Records of Fueling in automobiles used for illegal fuel storage in Bolivia". So, in this paper, this technological platform will be applied making some adjustments in the anomaly scores context. The principal contribution is design and development a BI solution responsible of analyze in large amount of records of anomalies in Bolivia and in this way to allow to make better decisions of control of fuel smuggling, having the right information in the right place at the right time.
1 Introduction
Bolivia subsidizes more than 50 % of the fuel costs currently giving rise to the existence of unscrupulous people that are dedicated to the smuggling of this re-source. To address this problem, the institution in charge of regulating, controlling and supervising all the activities of the hydrocarbon in (National Agency of Hydrocarbons, ANH for its acronym in Spanish), implemented the called B-SISA system in which it records the fuel supply of each vehicle through a Radio Frequency Identification (RFID) technology as a control action.
In this context, Buarque et al. [1] develop a computational approach for Anomaly Detection based in records of fueling in order to determinate scores of anomalies and in this way identify possible cases of illegal storage via profiling and unsupervised clustering algorithms. However, the massive volumes of stored records after processing the model need to be analyzed and from this to make decisions. The collection and analysis of this information, given its heterogeneous character and its volume, usually become a problem for organizations and this is where Business Intelligence (BI) intervenes, through the Systems of Sup-port of "human decision-making". Today there are many BI solutions, being the Open Source Pentaho Business Intelligence platform one of the most used currently. The platform proposed covers data analysis and reporting operations, making this a flexible solution to cover our study case.
On the one hand, the strategic objective of the ANH is based on: Intelligently manage resources from the model proposed in [1] also its implementation in a framework open source flexible to needs of the institution, and in this way achieve maximum operational efficiency, to improve the control of fuel smuggling in the all country.
On the other hand, it is clear that the strategic role that the ANH must assume is to have an updated anomaly in records of fueling and also fuel sales control, which can be guided by the anomalies that vehicles re-fuel most.
Therefore, this paper faced with the challenge of efficiently accomplishing strategic activities, is opportunely evaluated on the use of information technologies for the extraction, transformation, loading and exploitation of the data stored in the company databases in order to adopt the best strategic improvement decisions.
2 Theoretical background
2.1 Business Intelligence (BI)
BI systems ensure obtaining of useful, correct and in-time information, usually taken from disparate data sources. They close the gap between the huge amount of data available to the decision factor, and the report analysis presented in a suggestive way that should sup-port the decision-making process [3]. BI offers sophisticate information analysis and information discovery technologies such as Data Warehouse, On-line Analytical Processing (OLAP), Data Mining, etc. BI solutions arrived to the third generation BI, providing access to information, advanced graphical and web-based OLAP, in-formation mining tools and prepackaged applications that exploit the power of those tools [4].
A BI system has four major components: a data warehouse (with its data source), business analytics (a collection of tools for manipulating, mining and analyzing the data from the warehouse), business performance management (for monitoring and analyzing performance) and a user interface (connecting to the system via a browser) [5].
A data warehouse is the core component of a BI infrastructure. The dimensional model of a data warehouse consists in numeric measures, dimensions and fact tables. Related measures are collected into fact tables. The measures can be looked upon in different ways, those ways being called dimensions. A dimension is a particular area of interest such as time, geographic position, category and so on [4].
An OLAP instrument is a combination of analytical processing procedures and graphic presentations [5]. OLAP uses the word cube to describe what in the relational world would be the integration of the fact table with dimension tables [4]. It generally includes a calculation engine for adding complex analytical logic to the cube, and a query language. Because the standard relational query language (SQL) is not well suited to work with cubes, Multidimensional Expression (MDX), an OLAP-specific query language, has been developed.
Data mining is a technology that uses complex algorithms for data analyzing and discovering valuable in-formation for the decision maker [5].
The emphasis is on data’s quality to be valid, previously unknown, comprehensible and actionable.
When designing the data scheme of the warehouse, the following types of schemes may be used: star, snow-flake or constellation [6].
This paper presents a practical solution implemented in a suite of open source Business Intelligence products called Pentaho Business Analytics, providing data integration, OLAP services, reporting, dashboarding, data mining and ETL capabilities.
2.2 Pentaho
Pentaho, founded in 2004, has an open source heritage and provides commercial professional and enterprise editions of its Pentaho Business Analytics technologies through a subscription model as well as open source versions. Along with reporting, interactive data discovery, and predictive analytics capabilities, Pentaho also provides data access and integration. Built to meet demand for ad hoc discovery, visualization, and exploration of large and diverse big data source [7].
The collection of analysis components in Pentaho Business Analytics enables visualizations of data trends by creating static reports from an analysis data source, traversing an analysis cube, showing how data points compare by using charts, and monitoring the status of certain trends and thresholds with dashboards.
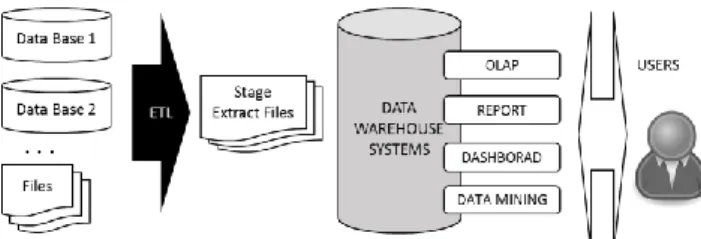
The process starts by using any client tools, consolidating data from disparate sources into one canonical source and optimizing it for the metrics wanted to be analyzed; creating an analysis schema to describe the data; iteratively improve that schema so that it meets the users' needs; and create aggregation tables for frequently computed views [7]. The architecture of an Open Source BI solution is depicted in Figure 1 [8].
Figure1 - Layer of Information Business Information. The Pentaho User Console, includes:
(i) Interactive Reporting for quick and easy
data-driven reports;
(ii) Pentaho Analyzer an interactive analysis
tool that provides a rich Web-based, drag-and-drop user interface;
(iii) Pentaho Dashboard Designer, a layout
template, theme, and the content are design.
3 Preliminaries
3.1 About the Anomalies
For clarity, we now introduce some definitions and assumptions to refer the previous model evaluated in [1]. This is also used as axiom for our proposed anomaly detection method.
For smuggling fuel, fraudsters accumulate this re-source by making several high purchases in short periods of time (e.g. fifteen times per day). This activity is considerate as irregular fuel supplies since those purchases are above the average consumption referring his own history consumption or historical of vehicles with similar characteristics.
Figure 2 shows an example of a sequence of records that are considered as anomaly due to increased fueling amount in a short period of time, compared to its own historic. (e.g. 350 – 400 liters of fueling in just two days is not normal in reference to its historical behavior). We define these anomaly as “Local Anomaly”: vehicles that have irregular fueling records according to its historical data.
Figure 2 - Fuel supply with consumption approximation and illegal fuel storage.
On the other hand, the anomaly explained before could be considerate as a normal in reference to others vehicles from similar characteristics like: (1) Type of vehicle (e.g. track, van, motorcycle, etc.), (2) Monthly consumption behavior (e.g. constant, variable, high or low), (3) Area of fuel consumption (e.g. rural, urban), (4) Type of fuel (e.g. diesel, gasoline, vehicular natural gas or combinations).
We define these characteristics such as “context variables” that can influence in the anomaly determination for a set of vehicles. Depending of the context variable the anomaly can be different in reference with Local Anomaly. Thus, we define as “Global Anomaly” to the anomalies of vehicles corresponding to the context variables.
3.2 About the Data
The data provided by the government institution refer to 190.456 records from vehicles samples in a random way. The vehicles correspond to locations in all Bolivia and after cleaning process, we have the following attributes:
Frame 1 - Atributtes of vehicles.
No Attribute Original Type Values
1 Id Categorical 1000 different id
2 Type of
vehicle Categorical 10 different type 3 Brand of vehicle Categorical 82 different brands 4 Location of
fueling Categorical 9 Locations 5 Fuel Type Categorical 4 Fuel type 6 Services Station Categorical 638 different GS 7 Amount of fueling Numeric From 0 to 4480 8 Time of fueling data During 2015–2016
3.3 About the Anomaly Detection
in Records of Fueling Model
Figure 3 - Anomaly Detection in Records of Fueling Model.
According with Buarque et al. [1], the Anomaly Detection in Records of Fueling (ADRF) uses Local and Global information grouped in four-step process, A-D as is showed in Figure 3. The flowchart starts in step A, in which "Fuel Consumption Profiling" (FCP) computes fuel consumption profiles of a set of vehicles that are expected to be influenced similarly by the same context variables such as location, season, weeks, etc. Thus, the FCP refer to clustering techniques based in contextual information that serves as profiling algorithm. With the profiles predetermined, the step B performs a particular and novel "Representation of Knowledge" (RK) based in historic of fueling records, in order to extracts features using a sliding overlapping window from the historic of fueling per: (1) each vehicle and (2) group profile. The RK is responsible for compute the principal features of what irregular patterns of consumption would mean by the case study.
After the processing performed by the RK, the step C called "Local and Global Scores" (LGS) is activated in order to score each window corresponding to the knowledge that had already been acquired both locally and globally on the last step. This step is responsible for quantifying the level of the anomaly for each fueling record in reference to the historic in fueling records per each vehicle and each profile. The algorithm that score the level of anomalies employ technologies of clustering in order to associate similar patterns corresponding to the historic fueling records. So, it has the objective of favoring the recognition of irregular patterns, besides promoting an analysis of divergences and similarities between patterns. During this step, the memorized values act as an organized repository of anomaly knowledge, storing prototypes that represent the behavior of each vehicle and each profile. This one provides a base set of information that allows the LGS to retrieve irregular patterns making it possible to explain how the final score computed was built by the model.
So, the model compute two important scores by each record of fueling for each vehicle: the first one is the Local Anomaly Score (LAS) and the second one Global Anomaly Score (GAS).
In a proof of use of the model, the results of the accuracy are 82.75 % for Local Anomalies and 99.7 % for Global Anomalies. These results represent a good performance of the proposal due
that 4.314 of 4.433 record of fueling were labeled correctly for the Global Case and 3.583 of 4.433were labeled correctly for the Local Case.
4 Methodology Proposed
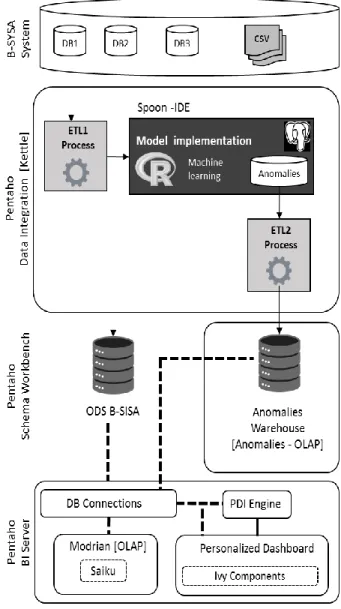
Both the B-SISA system and the implementation of ADFR model work with information, data that is enriched by online transactions, data that needs to be purified, to incorporate a visualization personalized that allows analysis in order to help the institution to manage the decision-making process. In this context, we propose a methodology based on the architecture of Business Intelligence (i.e. transactional systems, management system technologies and management systems interfaces). Note that we used Pentaho as the framework for the BI solution.
To achieve this goal, we start from a point of origin that are all transactional systems, next we go integrating, debugging and visualizing. For this, the following steps are described, which are also shown in Figure 4:
•Transactions originated by the B-SISA system (fuel supplies of 1000400 vehicles in 638 service stations) depends on other applications dispersed in different systems (i.e. DB1, DB2, DB3).So, it is extracted, transformed and loaded in a large data warehouse to normalize and create the Operational Data Store of the B-SISA (ODS-B-SISA) through a tool called ETL (implemented in the Pentaho Data Integration specifically in the Spoon application of the Pentaho platform).
•The model that refers to the ADRF is implemented in order to compute the global and local anomalies scores corresponding to each of the B-SISA transaction records. This implementation requires a variety of statistical and machine learning tools available in the R environment. So, we integrate R with Pentaho Data Integration (PDI).The results are deposited in a database that will allow per-forming the following ETL.
•An ETL2 is built which after a dimensional modeling is responsible for extracting, loading and trans-forming available metadata to generate datamarts in order to analyze anomalies.
•Next, we design the Schema that refer to the data warehouses as large structured data responsible for constructing datamarts. In this
step the Online Analytical Processing (OLAP) analyzing large quantities of data in real-time (deals with data in bulk) andemploying a technique called Multidi-mensional. We explain the details of this analyze in the experiments section.
•Finally, a customized dashboard is developed after of: (1) connect the Pentaho Server with database created, (2) create of some queries according with specific needs of the specialist (3) verifying these queries trough a plugin Sayku. The dashboard refers to the databases, PDI, OLAP created. We used the IvyDashboad Components as Plugin to create more user-friendly interfaces.
5 Experiments and Results
In a general way, this section describes different experiments during the implementation of the methodology proposed that will allow to have a support system of decision for the ANH’s specialists in order to resolve the problems to analyze large amounts of anomalies scores and in this way to have control of fuel consumption in the Bolivian state.
To perform the tests of our approach, we describe steps implemented from de methodology in the next subsections.
5.1 Multidimensional Modeling
According with Ralph Kimballto in [3] and in order to perform the Multidimensional modeling, we described the formulation of the steps of the business to analyze (i.e our study case) through the flow chart showed in Figure 5. In it 4 steps are described. (A) The ADRF refer to the implementation of the model proposed by [1], The supervisors of each location want to analyze which vehicles are extremely abnormal (locally and globally), at what gas stations or locations. (B)Level of detail define the granularity that have to able in the dimensional model,(C) Dimensions refer the answer to the following questions: Which vehicle has the most local and global anomalies scores? Which department has more anomalies scores? in which gas stations have more anomalies scores?In this context this refer to the time, vehicle type, locations and the vehicle type (these dimensions are re-quired by the ANH institution),(D) Indicators refer two principal measures: sum and maximum of anomaly scores (both of them considering the Local and Global scores).
Figure 5 - Flow Chart of the process of business in the Anomalies context.
5.2 ETL 1
As the methodology refer, the ETL1 integrate three data sources from B-SISA system. They were extracted from the Vehicle Registration Application (i.e. " Motorized Kardex "),Sales Record Application (i.e. "Consumption Details") and Geospatial Information of Services Stations according to the ANH Raw Data. This tree data sources are integrated in order to implement the ADRF model.
The Figure 6 show the design and test of ETL1 trough the graphical tool Spoon (part of Pentaho Data Integration solution). In it, we show the different transformations and jobs contemplated by the model (i.e. De-termination of Profiling Groups, Formulations of knowledge and Local and Global Detection). Note that each icon in the Figure refer to an step from the ADRF and could represent as well as just an execution ofR script (e.g. A_DeterminationProfilingGroup) or a conjunct of transformations, called Jobs in the Spoon tool (e.g. ANH_DetectionStep_Job and ANH_TrainingStep_Job).
The R scripts refer the application of machine learning techniques (e.g. Unsupervised learning from SOM net-works and hierarchal clustering) in order to compute the scores of anomalies based in [1].
5.3 ETL 2
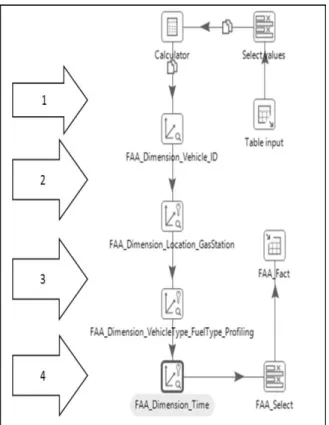
After a multidimensional modeling, the ETL2 de-scribe refer to the extraction, transformation and loading of each dimension established according with the needs of our study case. The Figure 7 shows the design and test of ETL2. Each number refer to the metadata generated for the different dimensions of the cube.
5.4 Anomalies Data Warehouse
The Anomalies Data Warehouse is constructed after the ADFR implemented through R environment and its integration with Pentaho Data Integration (PDI). The data is stored over multiple dimension tables as the star schema is showed in the Figure 8. Note that these dimensions were created according with the needs of the ANH institution. They want to analyze the vehicles with more and maximum anomalies scores during a specific time, modifying the vehicle type, the location and also visualizing the current anomalies of each vehicle in a map referring the Geo Position of the service station.
Figure 7- ETL of Anomalies Fact.
Figure 8 - Star Schema design for Anomalies Fact.
5.5 OLAP
The OLAP designed employs the Multidimensional modeling explained before. It consists of four dimensions (i.e. Time, Vehicle Type, Locations, Vehicle Id). For better understanding, Figure 9 shows and example of a cube with three of the four dimensions. Dimension of “Time” in the x-axis, dimension of “Vehicle Type” in the y-axis, dimension of “location” in the z-axis.
Figure 9 - Star Schema design for Anomalies Fact.
5.6 Dashboard Customized
Dashboards increase the analytical power of the visualization by allowing multiple perspectives on the dataset in the same location. For our approach we used the Community Dashboard Editor (CDE) and the plugin Ivy in order to have the graphical interface more friendly for the end users (i.e. specialist of the
ANH institution). We create the layout, components and data source panels based in Charts, Data Tables, and Files created before using the Analysis or Report features.
When creating a dashboard, the Data Table content type allows a tabular representation of a database query in a dashboard. It also allows the manipulation of the data, directly from the dashboard.
In the Figure 10, the final dashboard to analyze anomalies in Boliviais showed.
Figure 10 - LastDashboard to analyze anomalies in Bolivia.
Next, seven macro components were designed, numbered from 0 to 6:
0- Initial Settings. At the first time, it is able for the
user to give initial information: (a) corresponds
to the measure (i.e. Sum of Anomaly Scores and Maximum Anomaly Scores for the Local and Global levels), (b) corresponds the year of analyze and (c) is the limit to visualize the top “n” vehicles with high measures
1 - Select Vehicle Type. The specialist can visualize
the percent of amount anomalies (maximum or sum of them) per vehicle type.
2 - Select Locations. The specialist can visualize the
percent of amount anomalies (maximum or sum of them) per location
3 - Top Consumers with high Anomalies. Also the
user will visualize the top 10 vehicles respect to the vehicle type and the location selected.
4 - Vehicle Monthly Scores. Also the data is updated
if the specialist chooses one of the top 10 vehicles in order to know the fuel consumption by month.
5 - Map of Bolivia geo referring to all Service Station.
As reference the total service station this map show all of them.
6 - Map of Bolivia geo referring just the Service
Station with the anomalies and also it is showed the record of real fueling by each vehicle with respect to those Service Station. This is the tool more significant by the specialist because he can know the regions of lot of anomalies in order to make strict control in the sales from some ser-vice stations. To have reference the real fueling of the anomaly cases permit to verify the anomalies scores.
With whatever change of visualization by the user, with just a click in whatever macro-component, all the data is updated.
5.7 Analyze of Anomalies from
Dashboard
With the sampled data which was implemented this paper shows the following analysis:
● The Maximum departmental anomalies represent LA PAZ corresponding to the vehicles ID: 3001-FSA, 3034-GHK and other eight.
● The maximum anomalies per service station are the ones that are located in the border with Peru.
The maximum consumption per month is in the December.
6 Conclusions
It was possible to design and develop the consultations for the necessary dashboard and thus having a better structure of information in the anomaly detection context.
Also it was possible to analyze, design and construct the technologies from an BI solution (i.e. ETL, OLAP, Cubes, and customize and Dashboard), thus achieving weaknesses in the ANH.
In general, a BI architecture provided the con-cepts in order to implement a open source BI solution based in the compute of anomalies scores trough a machine learning techniques.
References
[1] AQUIZE, Vanessa Gironda; EMERY, Eduardo;
DE LIMA NETO, Fernando Buarque. Self-organizing maps for anomaly detection in fuel consumption. Case study: Illegal fuel storage in
Bolivia. In: IEEE LATIN AMERICAN CONFERENCE
ON COMPUTATIONAL INTELLIGENCE LA-CCI, 4., 2017, Peru. Proceedings… Peru: IEEE, 2017. p.1-6. Available in:
<https://ieeexplore.ieee.org/abstract/document/8 285697/>
[2] STODDER, David. Data visualization and
discovery for better business decisions.
[E-book] TDWI Research,2013. p.30-31. Available in: <http://solutiondesignteam.com/wp- content/uploads/data-visualization-discovery-better-business-decisions-106672.pdf>
[3] TARNAVEANU, Diana; MUNTEAN, Mihaela. Free Business Intelligence – An Easy and Reliable Alternative. Mathematical Models & Methods
in Applied Sciences, WSEAS Press, p. 158-164,
9 Set. 2012. Available in:
<https://papers.ssrn.com/sol3/papers.cfm?abstr act_id=2143945>
[4] MUTEAN, Mihaela; BRANDAS, Claudio. Business Intelligence Support Systems and Infrastructures. Economy Informatics, n. 7, p. 100-104, 2007.
[5] BUTUZA, Antoanela et al. Increasing the Business Performance using Business Intelligence. Analele Universităţii Eftimie
Murgu Reşiţa, Fascilua de Ingenerie, v. 18.,
n.3 , p. 67-72, 2011.
[6] MIRCEA, Marinela et. Al. Agile Development for Service Oriented Business Intelligence Solutions. Database Systems Journal, v. 2., n.1, p. 43-56, 2011.
[7] PENTAHO. Big Data Integration and Analytics. Disponível em:
<http://www.pentaho.com/>
[8] GOLFARELLI, Matteo. Open Source BI Platforms: a Functional and Architectural Comparison. In: INTERNATIONAL CONFERENCE ON DATA WAREHOUSING AND KNOWLEDGE DISCOVERY, 11., 2009, Berlin. Proceedings… Berlim: Springer, 2009. p. 287 – 297.