arXiv:1511.00502v2 [hep-ex] 27 Jan 2016
EUROPEAN ORGANISATION FOR NUCLEAR RESEARCH (CERN)
Submitted to: Phys. Lett. B CERN-PH-EP-2015-227
28th January 2016
Dijet production in
√ s = 7 TeV pp collisions with large rapidity
gaps at the ATLAS experiment
The ATLAS Collaboration
Abstract
A 6.8 nb−1sample of pp collision data collected under low-luminosity conditions at √s = 7 TeV by the ATLAS detector at the Large Hadron Collider is used to study diffractive dijet production. Events containing at least two jets with pT> 20 GeV are selected and analysed
in terms of variables which discriminate between diffractive and non-diffractive processes. Cross sections are measured differentially in ∆ηF, the size of the observable forward region
of pseudorapidity which is devoid of hadronic activity, and in an estimator, ˜ξ, of the fractional momentum loss of the proton assuming single diffractive dissociation (pp → pX). Model comparisons indicate a dominant non-diffractive contribution up to moderately large ∆ηF
and small ˜ξ, with a diffractive contribution which is significant at the highest ∆ηF and the lowest ˜ξ. The rapidity-gap survival probability is estimated from comparisons of the data in this latter region with predictions based on diffractive parton distribution functions.
c
2016 CERN for the benefit of the ATLAS Collaboration.
1 Introduction
Diffractive dissociation (e.g. pp → pX) contributes a large fraction of the total inelastic cross section [1] at the Large Hadron Collider (LHC). The inclusive process has been studied using the earliest LHC data in samples of events in which a large gap is identified in the rapidity distribution of final-state hadrons [2,
3]. In the absence of hard scales, the understanding of these data is based on phenomenological methods rather than the established theory of the strong interaction, quantum chromodynamics (QCD).
A subset of diffractive dissociation events in which hadronic jets are produced as components of the dissociation system, X, was first observed at the SPS [4], a phenomenon which has since been studied extensively at HERA [5,6] and the Tevatron [7]. The jet transverse momentum provides a natural hard scale for perturbative QCD calculations, making the process sensitive to the underlying parton dynamics of diffraction and colour-singlet exchange. A model [8] in which the hard scattering is factorised from a colourless component of the proton with its own partonic content (diffractive parton distribution func-tions, DPDFs), corresponding to the older concept of a pomeron [9], has been successful in describing diffractive deep inelastic scattering (ep → eX p) at HERA [10]. The DPDFs have been extracted from fits to HERA data in the framework of next-to-leading-order QCD, revealing a highly gluon-dominated structure [11,12].
The success of the factorisable approach breaks down when DPDFs from ep scattering are applied to hard diffractive cross sections in photoproduction [13,14] or at hadron colliders. Tevatron data [7] show a suppression of the measured cross section by a factor of typically 10 relative to predictions. A sim-ilar ‘rapidity-gap survival probability’ factor, usually denoted by S2, was suggested by the first results from the LHC [15]. This factorisation breaking is usually attributed to secondary scattering from beam remnants, also referred to as absorptive corrections, and closely related to the multiple-scattering effects which are a primary focus of underlying-event studies [16–18]. Understanding these effects more deeply is an important step towards a complete model of diffractive processes at hadronic colliders and may point the way towards a reconciliation of the currently very different theoretical treatments of soft and hard strong interactions.
In this paper, the ATLAS technique for finding large rapidity gaps, first introduced in Ref. [2], is de-veloped further and applied to events in which a pair of high transverse momentum (pT) jets is identified.
The resulting cross sections are measured as a function of the size of the rapidity gap and of an estimator of the fractional energy loss of the intact proton. The results are interpreted through comparisons with Monte Carlo models which incorporate DPDF-based predictions with no modelling of multiple scattering. Comparisons between the measurements and the predictions thus provide estimates of the rapidity-gap survival probability applicable to single dissociation processes at LHC energies.
2 Models and simulations
Monte Carlo (MC) simulations using leading-order (LO) calculations in perturbative QCD are used in unfolding the data to correct for experimental effects and in the comparison of the measurements with theoretical models. The PYTHIA 8.165 (hereafter referred to as PYTHIA8) general-purpose LO MC gen-erator [19] is used to model dijet production in non-diffractive (ND) events, as well as in single diffractive dissociation (SD, pp → X p) and double diffractive dissociation (DD, pp → XY). An alternative model of
the SD process is provided by POMWIG (version 2.0β) [20], whilst an alternative next-to-leading-order (NLO) model of the ND process is provided by POWHEG (version 1.0) [21,22].
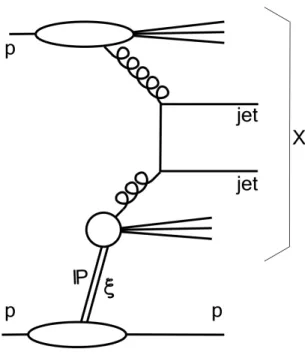
Figure 1: Illustration of hard single-diffractive scattering, in which partons from a pomeron (IP) and from a proton enter a hard sub-process. The rapidity gap appears between the system X and the intact proton.
In both PYTHIA8 and POMWIG, hard scattering in diffractive processes takes place through the factor-isable pomeron mechanism [8] illustrated in Fig.1. A pomeron couples to an incoming proton, acquiring a fraction ξ of the proton’s longitudinal momentum. The proton either scatters elastically (SD) or dis-sociates to form a higher-mass system (DD). A parton from the pomeron (as described by DPDFs) then undergoes a hard scattering with a parton from the dissociating proton at a scale set by the transverse momenta of the resulting jets. The dissociation system X has an invariant mass MX, such that ξ = MX2/s
at a proton–proton centre-of-mass energy √s.
POMWIG is based on a standard implementation of hard diffractive scattering with a factorisable pomeron, in which both the pomeron flux and the DPDFs are taken from the results of the H1 2006 DPDF fit B1 [11] and the proton PDF set is CTEQ61 [23]. In contrast, PYTHIA8 provides a simultaneous model of hard and soft diffraction [24], in which a soft diffractive model inherited from PYTHIA6 [25] is smoothly interfaced to a hard diffractive model similar to that in POMWIG. The probability of using the hard model depends on MX. The H1 2006 DPDF fit B is again used for the partonic content of the pomeron and the
proton partonic structure is taken from the CT10 PDFs [26]. Several different pomeron flux paramet-erisations are available in PYTHIA8. In addition to the default Schuler and Sjöstrand (S-S) model [27], alternative parameterisations by Donnachie and Landshoff (D-L) [28] and Berger and Streng [29,30], as well as the Minimum Bias Rockefeller (MBR) model [31], are also considered in this analysis. These
1The H1 Fit B DPDFs correspond to the sum of the SD process and the component of the DD process where the lower of the
models differ primarily in their predictions for the ξ dependence of the cross section [24]. The DD pro-cess in PYTHIA8 is modelled similarly to the SD propro-cess. Neither of the diffractive models considered here take rapidity-gap destruction effects into account, i.e. they set the rapidity gap survival probability
S2 ≡ 1.
An alternative for ND processes is provided by the POWHEG NLO generator. As described in Ref. [22], the ‘hardest emission cross section’ approach used in POWHEG avoids the pathological behaviour observed in calculating cross sections with symmetric jet cuts in fixed-order NLO calculations. Here, NLO dijet production in the DGLAP formalism is interfaced with PYTHIA 8 to resum soft and collinear emissions using the parton shower approximation.
PYTHIA8 adopts the Lund String model [32] for hadronisation in each of the ND, SD and DD channels. It also contains an underlying-event model based on multiple parton interactions (MPI). POMWIG is derived from HERWIG [33] and thus inherits its fragmentation and cluster-based hadronisation models. For the purposes of this paper, the POWHEG ND simulation is interfaced to PYTHIA8 for fragmentation and hadronisation. All considered models based on the PYTHIA hadronisation model include pT-ordered
parton showering, while those based on HERWIG use angular-ordered parton showering.
The default MC combination used for the data unfolding for detector effects is a mixture of PYTHIA8 samples of ND, SD and DD dijets, with the “ATLAS AU2-CT10” set of tuned parameters (tune) [34] for the underlying event. In this tune, the fraction of the total cross section attributed to the SD pro-cess is reduced relative to the default by 10% and that to DD by 12%, to better match early LHC data. The Berger–Streng parameterisation, which has a very similar ξ dependence to D-L, is chosen for the pomeron flux factor. Finally, the interaction of the particles with the ATLAS detector is simulated using a GEANT4-based program [35,36].
3 The ATLAS detector
The ATLAS detector is described in detail elsewhere [37]. The beam-line is surrounded by a tracking system, which covers the pseudorapidity2 range |η| < 2.5, consists of silicon pixel, silicon strip and straw tube detectors and is immersed in the 2 T axial magnetic field of a superconducting solenoid. The calorimeters lie outside the tracking system. A highly segmented electromagnetic (EM) liquid-argon sampling calorimeter covers the range |η| < 3.2. The EM calorimeter also includes a presampler covering
|η| < 1.8. The hadronic end-cap (HEC, 1.5 < |η| < 3.2) and forward (FCAL, 3.1 < |η| < 4.9) calorimeters
also use liquid argon for their sensitive layers, but with reduced granularity. Hadronic energy in the central region is reconstructed in a steel/scintillator-tile calorimeter. The shapes of the cell noise distributions in the calorimeters are well described by Gaussian distributions, with the exception of the tile calorimeter, where the noise has extended tails, and which is thus excluded from the rapidity gap finding aspects of the analysis. Minimum-bias trigger scintillator (MBTS) detectors are mounted in front of the end-cap calorimeters on both sides of the interaction point and cover the pseudorapidity range 2.1 < |η| < 3.8. The MBTS is divided into inner and outer rings, both of which have eight-fold segmentation. In the analysis, two trigger systems are used at Level-1 (L1), namely the MBTS which efficiently collects low-pT jets,
and the calorimeter-based trigger (L1Calo) which concentrates on higher-pT jets. In 2010, the luminosity
2In the ATLAS coordinate system, the z-axis points in the direction of the anti-clockwise beam viewed from above. Polar
angles θ and transverse momenta pTare measured with respect to this axis. The pseudorapidity η = − ln tan(θ/2) is a good
approximation to the rapidity of a particle whose mass is negligible compared with its energy and is used here, relative to the nominal z = 0 point at the centre of the apparatus, to describe regions of the detector.
was measured by monitoring the activity in forward detector components, with calibration determined through van der Meer beam scans [38,39].
4 Experimental method
To study rapidity-gap production, the experiment needs to operate at very low luminosities such that there is on average much less than one collision per bunch crossing (i.e. negligible ’pile-up’). This requirement has to be balanced against the need to collect adequate numbers of events with large rapidity gaps. The analysis therefore uses data from an early 2010 LHC run, with a total integrated luminosity of 6.8 nb−1. The average number of collisions per bunch crossing is 0.12.
The jet selection follows that used in the ATLAS 2010 dijet analysis [40]. Jets with pT>20 GeV and |η| <
4.4 are reconstructed by applying the anti-ktalgorithm [41] to topological clusters at the standard ATLAS
jet energy scale. For comparisons, in particle-level MC models, jets are formed with the anti-ktalgorithm
from stable (cτ > 10 mm) final-state particles. The analysis is performed with jets of two different radius parameters R = 0.4 and R = 0.6. Approximately twice as many jets are reconstructed with the R = 0.6 than with the R = 0.4 requirement in the kinematic range covered here.
The calorimeter-based jet trigger (’L1Calo’) is used with the lowest available pTthreshold in phase-space
regions where its efficiency is determined to be greater than 60%. This criterion is satisfied for central jets at all pseudorapidities in the range |η| < 2.9 with pT >29 (34) GeV for jets with R = 0.4 (0.6). At lower
transverse momenta, or where the jets are beyond the L1Calo η range, the MBTS trigger is used, with the requirement of a signal in at least one segment. The MBTS trigger is fully efficient for dijet events, but has a substantial time-dependent prescale (which is taken into account in the off-line analysis), reducing the effective luminosity for forward and low-pTjets to 0.303 nb−1.
At least two jets are required, with jet barycentres satisfying |η| < 4.4 and with pT > 20 GeV. These
requirements correspond to the region in which the jet energy scale and resolution are well known and in which the jets are fully contained within the detector.
Several sources of background were investigated. To reject contributions from beam interactions with residual gas in the beampipe, muons from upstream proton interactions travelling as a halo around the proton beam, and cosmic-ray muons, events are required to have a primary vertex constructed from at least two tracks and consistent with the beam spot position. In-time pile-up, caused by multiple interactions in one bunch crossing, is suppressed by requiring that there be no further vertices with two or more associated tracks. Out-of-time pile-up, caused by overlapping signals in the detector from neighbouring bunch crossings, was investigated and found to be negligible at the large bunch spacings (> 5 µs) of the chosen runs. Once an event is triggered and the dijet selection criteria are met, the requirement on the primary vertex removes 0.3% and 0.2% of events in the L1Calo- and MBTS-triggered data, respectively, while the in-time pile-up suppression cuts remove 9.4% and 6.5%, respectively. The latter values are used to scale the cross sections to account for the corresponding losses. Residual background occurs due to the limited position resolution of the vertex reconstruction, which typically merges pairs of vertices with ∆z . 1 cm into a single vertex. The size of this effect is estimated by extrapolation to lower values of the ∆z distribution for pairs of vertices which are resolved and its influence is evaluated by randomly overlaying minimum-bias events on the selected sample. The effect is smaller than 0.5% in all bins of the measured distributions. The residual beam-induced background is studied using ‘unpaired’ bunch
crossings in which only one bunch of protons passes through the ATLAS detector and is found to be negligible.
Each event is characterised in terms of pseudorapidity regions which are devoid of hadronic activity (’rapidity gaps’) using a method very similar to that first introduced in Ref. [2]. Rapidity gaps are defined using the tracking (|η| < 2.5 and pT > 200 MeV) and calorimetric (|η| < 4.8) information within the
ATLAS detector acceptance. Full details of the track selection can be found in Ref. [42]. Following Ref. [2], the clustering algorithm accepts calorimeter cells as cluster seeds if their measured response is approximately five standard deviations above the root-mean-square noise level, with a small dependence of the threshold on pseudorapidity. Cells neighbouring the seed cell are included in the cluster if their measured energies exceed smaller threshold requirements defined by the standard ATLAS topological clustering method. The particle-level gap definition is determined by the region of pseudorapidity with an absence of neutral particles with p > 200 MeV and charged particles with either p > 500 MeV or pT > 200 MeV. These momentum and transverse momentum requirements match the ranges over
which the simulation indicates that particles are likely to be recorded in the detectors, accounting for the axial magnetic field in the inner detector. The treatment of calorimeter information in the rapidity-gap determination follows the procedure introduced in Ref. [43], such that the requirement pT > 200 MeV
for calorimeter clusters from the previous rapidity-gap analysis [2] is removed. Since this transverse momentum requirement corresponds to a very high momentum at large pseudorapidities, the modified approach more completely exploits the capabilities of ATLAS to detect low-momentum particles in the calorimeters. The total numbers of selected events in the L1Calo and MBTS samples with R = 0.6 are 285191 and 44372, respectively.
The variable characterising forward rapidity gaps, ∆ηF, is defined by the larger of the two empty pseu-dorapidity regions extending between the edges of the detector acceptance at η = 4.8 or η = −4.8 and the nearest track or calorimeter cluster passing the selection requirements at smaller |η|. No requirements are placed on particle production at |η| > 4.8 and no attempt is made to identify gaps in the central re-gion of the detector. In this analysis, the size of the rapidity gap relative to η = ±4.8 lies in the range 0 < ∆ηF < 6.5. For example ∆ηF = 6.5 implies that there is no reconstructed particle with (transverse)
momentum above threshold in one of the regions −4.8 < η < 1.7 or −1.7 < η < 4.8.
For events which are of diffractive origin, the Monte Carlo studies indicate that the rapidity-gap defin-ition selects processes in which one of the incoming protons either remains intact (SD) or is excited to produce a system with mass M < 7 GeV (DD). In the second case, the system is typically restricted to a pseudorapidity region beyond the acceptance of the ATLAS detector. In both cases, the other incoming proton dissociates to produce a hadronic system of larger invariant mass MX. The gap size, ∆ηF, grows
approximately logarithmically with 1/MX, the degree of correlation being limited by event-to-event
had-ronisation fluctuations.
In this analysis, measurements of the energy deposits in each event are used to construct a variable, ˜ξ which is closely correlated with ξ and is similar to that used in Ref. [15]. Neglecting any overall transverse momentum of the system X, the relation
MX2 = √sXpTe±η , (1)
holds for cases where the intact proton travels in the ±z direction. In other words, if the forward rapidity gap starts at η = +4.8 (-4.8), the exponential function takes the positive (negative) sign. Here, the sum runs over all particles constituting the system X. This relation has the attractive feature that the sum is relatively insensitive to particles in the X system travelling in the very forward direction, i.e. those which
are produced at large pseudorapidities beyond the detector acceptance. Correspondingly, the variable ˜ξ is defined as ˜ξ ≃ M2 X/s = X pTe±η/√s . (2)
At the detector level, the sum in Eq.(2) runs over calorimeter clusters in the region |η| < 4.8. To best
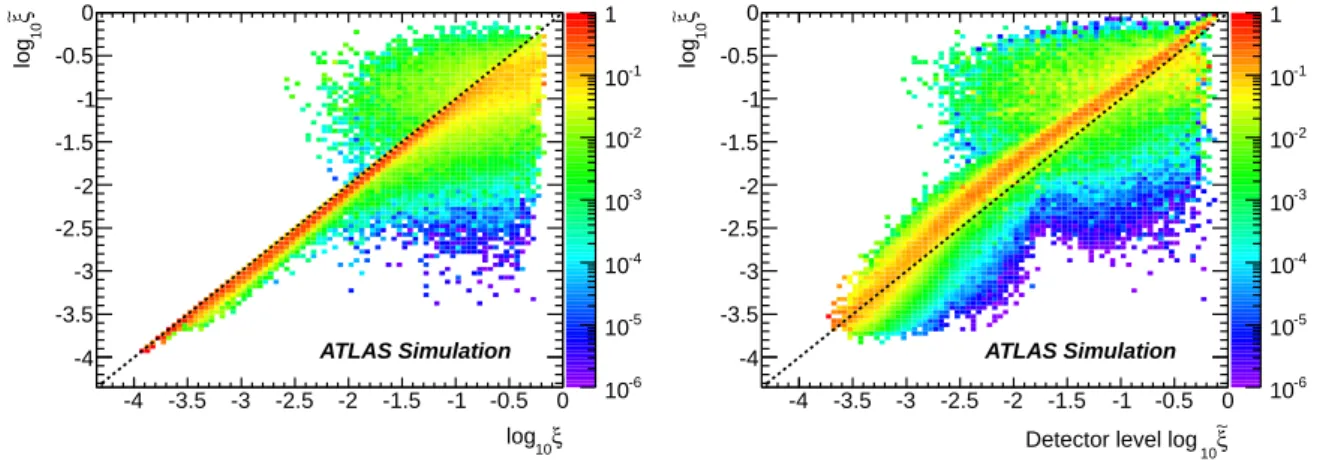
match this requirement, the corrected cross section is defined in terms of neutral particles with p > 200 MeV and charged particles with p > 500 MeV in the same pseudorapidity range. The correlation at the particle level between ˜ξ and the true ξ (the latter obtained from elastically scattered protons) in the PY-THIA8 MC model of SD events with two jets, is shown in Fig.2(a). For log10ξ <
∼ −2, there is a clear correlation between the fiducial ˜ξ variable and ξ, which continues to larger ξ, but with a progressively worse correspondence as some components of the dissociation system which are included in the ξ calcu-lation fail the fiducial requirement |η| < 4.8 applied in the ˜ξ calcucalcu-lation. At low values, ˜ξ is systematically slightly smaller than ξ, due to the exclusion of low-momentum particles from the ˜ξ definition. Figure2(b) shows the correlation between the reconstructed and particle-level determinations of ˜ξ. According to the MC models, the resolution in the absolute value of log10˜ξ varies from around 0.07 at large ˜ξ values to around 0.14 at small ˜ξ. -6 10 -5 10 -4 10 -3 10 -2 10 -1 10 1 ξ 10 log -4 -3.5 -3 -2.5 -2 -1.5 -1 -0.5 0 ξ ∼ 10 log -4 -3.5 -3 -2.5 -2 -1.5 -1 -0.5 0 ATLAS Simulation -6 10 -5 10 -4 10 -3 10 -2 10 -1 10 1 ξ ∼ 10 Detector level log -4 -3.5 -3 -2.5 -2 -1.5 -1 -0.5 0 ξ ∼ 10 log -4 -3.5 -3 -2.5 -2 -1.5 -1 -0.5 0 ATLAS Simulation
Figure 2: (a) Particle-level correlation between the ξ variable extracted from the diffractively scattered proton and ˜ξ calculated from particles selected as defined in the text, using the PYTHIA8 SD MC model. (b) Correlation between the particle-level ˜ξ and detector-level ˜ξ calculated from clusters selected as defined in the text, using the sum of PYTHIA8 ND, SD and DD contributions. In both plots, the distributions are normalised to unity in each column.
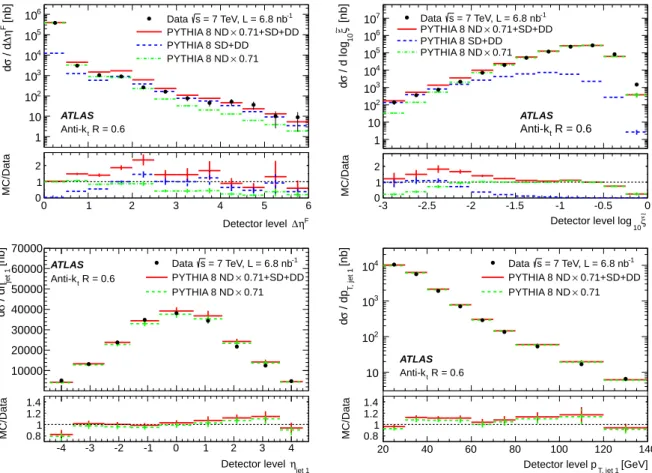
The quality of the description of the uncorrected data by the PYTHIA8 Monte Carlo model is shown for several variables in Fig.3. Here, the default ND component of PYTHIA8 is fixed to match the data in the first bin of the ∆ηFdistribution, requiring a normalisation factor of 0.71. The SD and DD contributions are shown without any adjustment of their normalisation. Satisfactory descriptions are obtained of the
∆ηFand ˜ξ variables, and also of the pseudorapidity and transverse momentum distributions of the lead-ing jet, indicatlead-ing that a combination of the diffractive and the non-diffractive PYTHIA8 components is appropriate for use in the unfolding of experimental effects.
The data distributions in ∆ηFand ˜ξ are corrected for detector acceptance and migrations between meas-urement bins due to finite experimental resolution using Iterative Dynamically Stabilised (IDS) unfolding [44]. This procedure corrects for migrations between the particle and detector levels based on an ‘un-folding’ matrix, constructed from a combination of PYTHIA8 ND, SD and DD samples, as shown in
[nb] F η∆ / d σ d 1 10 2 10 3 10 4 10 5 10 6 10 Data s = 7 TeV, L = 6.8 nb-1 0.71+SD+DD × PYTHIA 8 ND PYTHIA 8 SD+DD 0.71 × PYTHIA 8 ND ATLAS R = 0.6 t Anti-k F η ∆ Detector level 0 1 2 3 4 5 6 MC/Data 0 1 2 [nb] ξ ∼ 10 / d log σ d 1 10 2 10 3 10 4 10 5 10 6 10 7 10 Data s = 7 TeV, L = 6.8 nb-1 0.71+SD+DD × PYTHIA 8 ND PYTHIA 8 SD+DD 0.71 × PYTHIA 8 ND ATLAS R = 0.6 t Anti-k ξ ∼ 10
Detector level log
-3 -2.5 -2 -1.5 -1 -0.5 0 MC/Data 01 2 [nb] jet 1 η / d σ d 10000 20000 30000 40000 50000 60000 70000 -1 = 7 TeV, L = 6.8 nb s Data 0.71+SD+DD × PYTHIA 8 ND 0.71 × PYTHIA 8 ND ATLAS R = 0.6 t Anti-k jet 1 η Detector level -4 -3 -2 -1 0 1 2 3 4 MC/Data 0.8 1 1.2 1.4 [nb] T , je t 1 / dp σ d 10 2 10 3 10 4 10 Data s = 7 TeV, L = 6.8 nb-1 0.71+SD+DD × PYTHIA 8 ND 0.71 × PYTHIA 8 ND ATLAS R = 0.6 t Anti-k [GeV] T, jet 1 Detector level p 20 40 60 80 100 120 140 MC/Data 0.8 1 1.2 1.4
Figure 3: Comparisons of dijet cross sections from uncorrected data with a combination of PYTHIA8 diffractive
and non-diffractive contributions at detector level based on jets found by the anti-ktalgorithm with R = 0.6. The
MC distributions are normalised to the integrated luminosity of the data after first applying a factor of 0.71 to the
ND contribution. The error bars correspond to the statistical uncertainties. In addition to the measured (a) ∆ηFand
(b) ˜ξ variables, the distributions in (c) the leading-jet pseudorapidity and (d) transverse momentum are also shown. The lower panels show ratios of the MC models to the data where the error bars indicate the sum in quadrature of the statistical uncertainties arising from the data and the MC simulation.
Fig.2(b). The MC combination is optimised in a simple fitting procedure in which scaling factors are applied to the ND and (SD+DD) components to best match the data. The IDS unfolding is performed in two dimensions, corresponding to the pT of the leading jet and the target distribution (either ∆ηF or ˜ξ).
The results of the IDS procedure depend in general on the number of iterations used. A fast convergence is achieved for both measured distributions and the fourth iteration is chosen as nominal since it optimises the balance between the systematic and statistical uncertainty arising from the unfolding procedure. The unfolding procedure is stable against variations in binning, number of iterations and the scaling factors applied to the diffractive and non-diffractive contributions in the PYTHIA8 model, as discussed further in Section5.
5 Systematic uncertainties
The procedures for handling many of the sources of systematic uncertainty follow from previous ATLAS measurements. The full list of uncertainties considered is given below. Further details of the uncertainties affecting jets (sources 1–5 below) can be found in Ref. [40], while those affecting diffractive variables (sources 7–9) are elaborated in Ref. [2,43].
1. Jet energy scale: the largest source of uncertainty arises from the determination of the jet en-ergy scale. This is obtained following the procedure in Ref. [40], where relative shifts are applied between the particle-level and detector-level response as a function of η and pT. This accounts for
all effects playing a role in evaluating jet transverse momenta, including dead material, electronic noise, the different responses of the LAr and Tile calorimeters, the simulation of particle showers in the calorimeters, pile-up effects and the models of fragmentation used by different MC generators [45]. Studies in the context of the current analysis show that the inclusive treatment is also appro-priate for diffractive processes. As in Ref. [40], the dominant component of this uncertainty comes from the inter-calibration of jets in η. The total resulting uncertainty in the differential cross sec-tions measured here varies from 20% for small gaps to ∼ 40% for very large gaps, a region which is dominated by diffractive events with relatively small transverse momentum or large pseudorapidity of jets.
2. Jet energy resolution: this is determined from data using in situ techniques and MC simulation [46]. The resulting uncertainty on the cross-section measurements is evaluated by smearing the pT
of the reconstructed jets in MC simulation using a Gaussian distribution to match the resolution uncertainty found in data. The resulting effect is below 6% in all kinematic regions.
3. Jet angular resolution: this was determined using the same techniques as for the jet energy resol-ution. Following the procedure in Ref. [40] leads to an uncertainty on the differential cross sections which is typically around 1–2% and largest for jets at the largest |η|.
4. Jet reconstruction efficiency: the efficiency for reconstructing jets from the calorimeter
informa-tion is determined by reference to a sample of ‘track jets’ reconstructed from inner-detector tracks. Following Ref. [40], the uncertainty is taken from the difference between the results of this pro-cedure using data and MC simulation, with extrapolation to the η range not covered by the tracker. This results in systematic uncertainties in the measured cross sections which are smaller than 2% in all kinematic regions.
5. Jet cleaning efficiency: the fraction of jets that match the standard quality criteria, designed to
remove jets associated with spurious calorimeter response, was studied using a tag-and-probe tech-nique [40]. The corresponding systematic uncertainties are obtained by applying looser and tighter selections to the tag jet and propagate to at most 8% in the cross sections measured here.
6. Trigger efficiency: the trigger efficiency is evaluated as a function of leading-jet transverse
mo-mentum in various pseudorapidity ranges using either an independently triggered data sample or the MC mixture used in Fig.3. The rise near the threshold of the efficiency in each pTinterval is
parameterised based on a fit with free parameters. The efficiency is taken from the data, while the uncertainty is taken as the difference between two MC distributions: one assuming 100% trigger efficiency and the other rescaled by trigger efficiencies found in this MC sample in the same η and pT ranges as in the data. The resulting uncertainties are smaller than 3.5% for all measured bins.
A further parameterisation uncertainty, evaluated by varying the fit parameters within their uncer-tainties, is less than 0.7% for all measurements. An additional uncertainty, below 0.5% in all bins, is obtained from the differences in the simulated efficiencies from the ND, SD and DD processes. 7. Cluster energy scale: the uncertainty on the energy scale of the individual calorimeter clusters
used to determine ˜ξ is evaluated in an η-dependent manner as described in Ref. [43]. The resulting uncertainty in the cross sections differential in ˜ξ is typically 10%.
8. Cell significance threshold: the significance thresholds applied to suppress calorimeter clusters which are consistent with noise fluctuations, are shifted up and down by 10% to determine the cor-responding systematic uncertainties. The weakened requirements on particle (transverse) momenta applied here compared with Ref. [2] increase the sensitivity to the threshold shifts, particularly in the forward regions, resulting in uncertainties on the differential cross sections of typically 10–20%. 9. Track reconstruction efficiency: the uncertainty on the track reconstruction efficiency is taken
from Ref. [42], resulting in a negligible effect on the differential cross sections.
10. Luminosity: the uncertainty on the luminosity is taken from the luminosity determination for the year 2010 [39], resulting in a ±3.5% normalisation uncertainty on all measurements.
11. Reconstructed vertex requirement: the uncertainty on the efficiency of the vertex multiplicity requirement is evaluated by loosening it in data to include events with no vertices. This changes the differential cross sections by less than 1% in all bins.
12. Dead material: the effect of possible inaccuracies in the detector dead material simulation was studied in Ref. [2] using dedicated MC samples with modified material budgets (±10% around the
central value) in the inner detector, services and calorimeters. The largest effect on any bin in that analysis was 3%, which is applied as a symmetric shift in each bin of the current measurement. 13. Unfolding procedure: the uncertainty associated with modelling bias introduced by the
unfold-ing procedure is estimated usunfold-ing a data-driven procedure whereby the particle-level distributions of the MC sample are reweighted such that the corresponding detector-level distributions match the uncorrected data in the two-dimensional (∆ηF, ˜ξ)-space. The reweighted detector-level MC distribution is then unfolded using the same procedure as is applied to the data. The systematic un-certainty in each bin is taken to be the difference between the unfolded reweighted MC distribution and the reweighted particle-level MC distribution. The resulting unfolding uncertainty is typically around 15% for the ∆ηF distribution (rising to 25% in the bin for the largest gaps) and is smaller than 10% in the case of the ˜ξ distribution. Since the factors used to scale the ND and (SD+DD) processes to best describe the data before unfolding are different for the ∆ηFand ˜ξ distributions, a further uncertainty of up to around 5% is ascribed by swapping these factors between the two distributions.
The total systematic uncertainty is defined as the sum in quadrature of the uncertainties described above. The dominant contribution arises from the jet energy scale uncertainty, followed by the unfolding uncer-tainty, the cell significance threshold uncertainty (for the ∆ηF distribution) and the cluster energy scale uncertainty (for ˜ξ). The overall uncertainty varies between bins in the range 20% to 45%. There are strong correlations between the systematic uncertainties in neighbouring measurement intervals of both the ∆ηFand ˜ξ distributions.
6 Results
In this section, particle-level dijet cross sections are presented differentially in the variables ∆ηFand ˜ξ, both of which have discriminatory power to separate diffractive and non-diffractive contributions. The cross sections correspond to events with at least two jets with pT > 20 GeV in the region |η| < 4.4. The
particle-level gap is defined by the region of pseudorapidity with an absence of neutral particles with
p > 200 MeV and charged particles with either p > 500 MeV or pT>200 MeV. The conclusions are not
strongly dependent on the choice of R parameter in the anti-kt jet algorithm, although the cross-section
normalisations are about two times larger for R = 0.6 than for R = 0.4. The data shown here correspond to R = 0.6. The results with both cone sizes can be found in tabular form in Ref. [47].
[nb] F η∆ / d σ d 1 10 2 10 3 10 4 10 5 10 6 10 7 10 -1 = 7 TeV, L = 6.8 nb s Data
Total exp. uncertainty PYTHIA 8 SD, D-L PYTHIA 8 SD+DD, D-L PYTHIA 8 ND+SD+DD, D-L ATLAS R = 0.6 t Anti-k > 20 GeV T p F η ∆ 0 1 2 3 4 5 6 MC/Data 0.50 1 1.52 [nb] ξ ∼ 10 / d log σ d 10 2 10 3 10 4 10 5 10 6 10 7 10 Data s = 7 TeV, L = 6.8 nb-1 Total exp. uncertainty PYTHIA 8 SD, D-L PYTHIA 8 SD+DD, D-L PYTHIA 8 ND+SD+DD, D-L ATLAS R = 0.6 t Anti-k > 20 GeV T p ξ ∼ 10 log 3 − −2.5 −2 −1.5 −1 −0.5 0 MC/Data 0 0.51 1.52 2.5
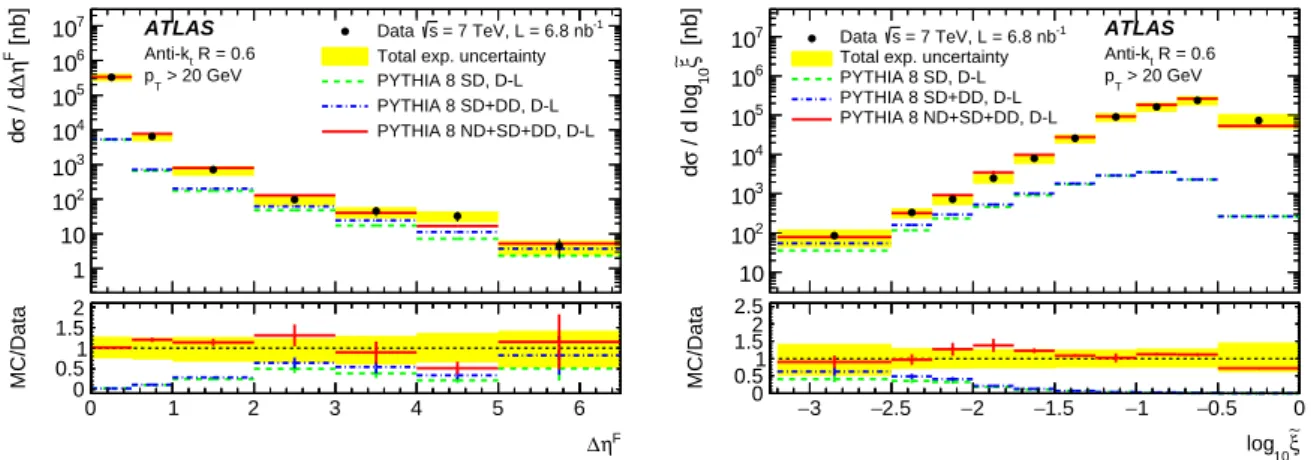
Figure 4: The differential dijet cross sections in (a) ∆ηFand (b) ˜ξ, compared with the particle-level PYTHIA8 model
of the SD, sum of diffractive components SD and DD, and sum of all three ND, SD and DD components. The Donnachie–Landshoff pomeron flux model is used for the diffractive components. The error bars on the data and the MC models indicate their respective statistical uncertainties, while the yellow bands show the total uncertainties
on the data. The ND contribution is normalised to match the data in the first ∆ηFbin. The lower panels show ratios
of the MC models to the data where the error bars indicate the sum in quadrature of the statistical uncertainties arising from the data and the MC simulation.
Figures4(a) and4(b) show the dijet cross section differentially in ∆ηFand ˜ξ for R = 0.6 jets. In contrast to related distributions in inclusive rapidity-gap measurements [2], the data in these figures do not show any significant diffractive plateau at large gap sizes. This difference is of kinematic origin, resulting from the reduced phase space at large gap sizes or small ˜ξ when high-pT jets are required. Both distributions are
compared with predictions from the PYTHIA8 MC model, decomposed into ND, SD and DD compon-ents, with the D-L flux choice. The normalisation of the ND contribution in both distributions is fixed to match the data in the first bin of ∆ηF, where this component is expected to be heavily dominant, requiring a multiplicative factor of 1/1.4. The SD and DD normalisations are left unchanged from their defaults in PYTHIA8. This MC combination results in a satisfactory description of both distributions. The ND component is at least an order of magnitude larger than the SD and DD contributions for relatively small
∆ηF . 1 and large ˜ξ & 0.1. As ∆ηFgrows or ˜ξ falls, the diffractive components of the models become increasingly important, such that the ND and (SD+DD) components are approximately equal at ∆ηF∼ 3 or log10˜ξ ∼ −2. At the largest gaps (∆ηF & 5) and smallest ˜ξ ( ˜ξ . 0.003), the model suggests that the
diffractive components are approximately twice as large as the ND contribution.
level cross-section definitions are slightly different in terms of the η, p and pT ranges of the particles
considered and the jet R parameter. Nonetheless, the measured cross sections are similar in magnitude and both analyses lead to the conclusion that a non-negligible ND contribution extends to relatively large
∆ηFand small ˜ξ.
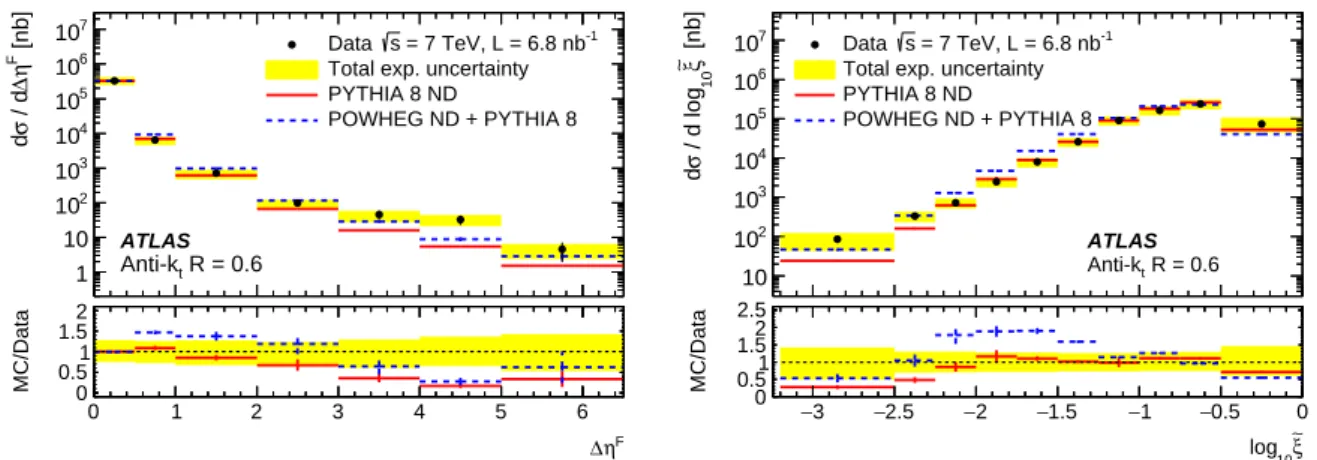
The predicted ND contribution at large gap sizes is sensitive to the modelling of rapidity and transverse momentum fluctuations in the hadronisation process, which are not yet well constrained. To establish the presence of a diffractive contribution, it is therefore necessary to investigate the likely range of ND predictions. In Fig.5, the dijet cross sections differential in ∆ηFand ˜ξ are compared with the PYTHIA8 ND contribution and also with an NLO calculation of non-diffractive dijet production in the POWHEG framework, with hadronisation modelled using PYTHIA8, as described in Section2. Each of the ND predictions is separately normalised in the first bin of the ∆ηFdistribution. The range spanned by the ND predictions suggests a substantial uncertainty in the probability of producing gaps through hadronisation fluctuations, such that for ∆ηF.4, it is not possible to draw conclusions on the presence or absence of an
additional diffractive contribution. However, in both of the models, the ND prediction falls significantly short of the data for ∆ηF & 4. A similar conclusion is reached at the lowest ˜ξ. This region is therefore investigated in more detail in the following.
[nb] F η∆ / d σ d 1 10 2 10 3 10 4 10 5 10 6 10 7 10 -1 = 7 TeV, L = 6.8 nb s Data
Total exp. uncertainty PYTHIA 8 ND POWHEG ND + PYTHIA 8 ATLAS R = 0.6 t Anti-k F η ∆ 0 1 2 3 4 5 6 MC/Data 0.50 1 1.52 [nb] ξ ∼ 10 / d log σ d 10 2 10 3 10 4 10 5 10 6 10 7 10 -1 = 7 TeV, L = 6.8 nb s Data
Total exp. uncertainty PYTHIA 8 ND POWHEG ND + PYTHIA 8 ATLAS R = 0.6 t Anti-k ξ ∼ 10 log 3 − −2.5 −2 −1.5 −1 −0.5 0 MC/Data 0.50 1 1.52 2.5
Figure 5: The dijet cross sections differential in (a) ∆ηF and (b) ˜ξ, compared with the PYTHIA8 ND MC model
as well as an ND model using the NLO POWHEG generator with hadronisation based on PYTHIA8. Each of the
models is separately normalised to match the data in the first ∆ηFbin. The error bars on the data and the MC models
indicate their respective statistical uncertainties, while the yellow bands show the total uncertainties on the data. The lower panels show ratios of the MC models to the data where the error bars indicate the sum in quadrature of the statistical uncertainties arising from the data and the MC simulation.
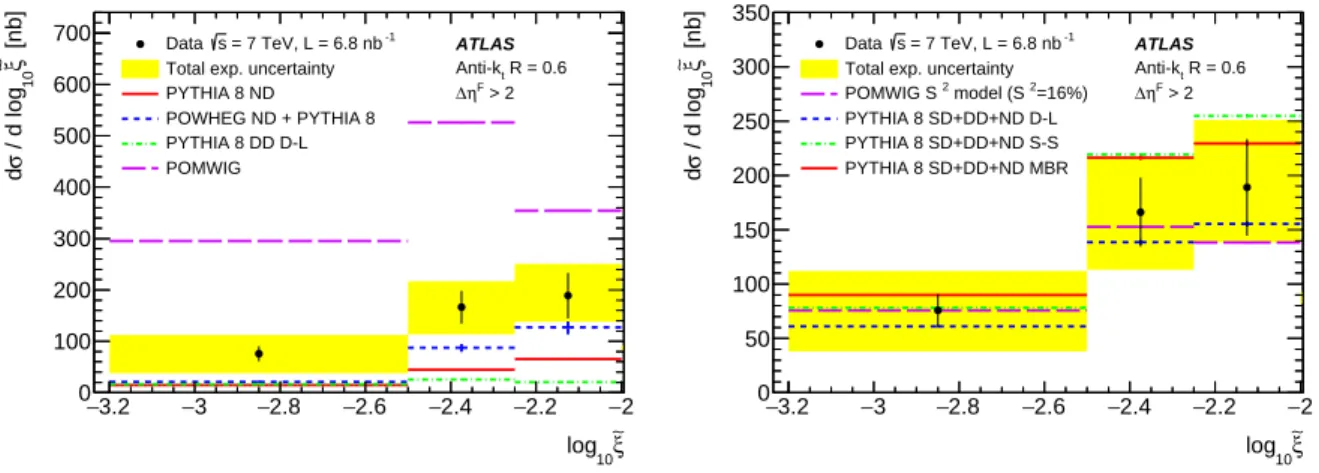
Since the diffractive contribution is characterised by both large ∆ηFand small ˜ξ, it can be separated most cleanly by placing requirements on both variables simultaneously. In Fig.6, the ˜ξ distribution is shown after applying the requirement ∆ηF > 2. This restricts the accessible kinematic range to ˜ξ . 0.01, and suppresses the ND contributions considerably. As shown in Fig.6(a), the ND contribution in the lowest ˜ξ bin (−3.2 < log10˜ξ < −2.5) is smaller than 25% according to all models considered, allowing for a
quantitative investigation of the diffractive contribution.
The data are compared with various models of diffractive dijet production with no rapidity-gap survival probability factors applied. The PYTHIA8 ND+SD+DD model is shown in Fig.6(b) for three different choices of pomeron flux, Schuler–Sjöstrand (S-S), Donnachie-Landshoff (D-L) and Minimum Bias
Rock-efeller (MBR), as described in Section2. The SD contribution dominates in this kinematic region, as can be inferred by comparing the PYTHIA8 predictions in Fig.6(b) with the PYTHIA8 ND and PYTHIA8 DD contributions in Fig.6(a). There is some dependence of the predicted cross section on the choice of flux, but all three PYTHIA8 predictions are compatible with the data without the need for a rapidity-gap survival probability factor, the D-L flux giving the best description. In contrast, the POMWIG model of the SD contribution alone lies above the data by around a factor of three in the low ˜ξ, large ∆ηFregion (Fig.6(a)). ξ ∼ 10 log 3.2 − −3 −2.8 −2.6 −2.4 −2.2 −2 [nb] ξ ∼ 10 / d log σ d 0 100 200 300 400 500 600 700 -1 = 7 TeV, L = 6.8 nb s Data
Total exp. uncertainty PYTHIA 8 ND POWHEG ND + PYTHIA 8 PYTHIA 8 DD D-L POMWIG ATLAS R = 0.6 t Anti-k > 2 F η ∆ ξ ∼ 10 log 3.2 − −3 −2.8 −2.6 −2.4 −2.2 −2 [nb] ξ ∼ 10 / d log σ d 0 50 100 150 200 250 300 350 -1 = 7 TeV, L = 6.8 nb s Data
Total exp. uncertainty =16%) 2 model (S 2 POMWIG S PYTHIA 8 SD+DD+ND D-L PYTHIA 8 SD+DD+ND S-S PYTHIA 8 SD+DD+ND MBR ATLAS R = 0.6 t Anti-k > 2 F η ∆
Figure 6: The differential cross section as a function of ˜ξ for events satisfying ∆ηF>2. The same data are shown in
(a) and (b), and are compared with models as described in the text. The error bars on the data and the MC models indicate their respective statistical uncertainties, while the yellow bands show the total uncertainties on the data.
The ’POMWIG S2’ model represents the sum of PYTHIA ND and POMWIG, with POMWIG multiplied by 0.16
and scaled by 1/1.23 and by the (SD+DD)/SD ratio from PYTHIA8.
Both PYTHIA8 and POMWIG are based on implementations of DPDFs as measured at HERA. POM-WIG is a straightforward implementation of a standard factorisable Pomeron model with standard matrix elements, specifically intended for use in comparison with diffractive hard scattering processes such as that measured in this paper. PYTHIA8 is intended to describe diffraction inclusively. It contains a com-plex transition between the hard (DPDF-based) and soft models, and the corresponding mechanisms for generating final-state particles. The large difference here between the predictions of PYTHIA8 and POMWIG may be a consequence of this difference in basic approach. The quality of the description of the data by PYTHIA8 is not altered significantly if the modelling of multi-particle interactions, colour reconnections, or initial- or final-state radiation are varied.
Attributing the POMWIG model’s excess over the data in the most sensitive region to absorptive effects, the data are compared quantitatively with POMWIG to determine the rapidity-gap survival probability S2 appropriate to this model. The value of S2 is determined from the region where the poorly known ND contribution is smallest, i.e. integrated over the range −3.2 < log10 ˜ξ < −2.5 after imposing the
rapidity-gap requirement ∆ηF > 2 as in Fig. 6. The estimate of S2 is obtained from the ratio of data to the SD contribution in the POMWIG model after subtracting from the data the ND contribution as modelled by PYTHIA8 and the DD contribution assuming the SD/(SD+DD) ratio from PYTHIA8. No gap survival factors are applied to the subtracted ND and DD contributions. The size of these corrections can be inferred from the PYTHIA8 ND and DD contributions as indicated in Fig.6(a). A correction factor 1.23 ± 0.16 [48] is applied to S2to account for the fact that the H1 2006 Fit B DPDFs used in POMWIG
include proton dissociation contributions ep → eXY where the proton excitation has a mass MY < 1.6
GeV, in addition to the SD process.
The resulting extracted value of the rapidity-gap survival probability appropriate to the mixed POMWIG
/ PYTHIA8 model is
S2= 0.16 ± 0.04 (stat.) ± 0.08 (exp. syst.) ,
where the statistical (stat.) and experimental systematic (exp. syst.) uncertainties are propagated from the data. This model is shown as ‘POMWIG S2Model’ in Fig.6(b). No attempt has been made to fully assess the model-dependence uncertainty, although changing the ND contribution in the extraction from PYTHIA8 to POWHEG + PYTHIA8 results in an S2 of 0.15 and indications from elsewhere [14, 15] suggest that S2 might be smaller if NLO models were used. The result is compatible with the values of 0.12 ± 0.05 and 0.08 ± 0.04, obtained by CMS in LO and NLO analyses, respectively, using the region 0.0003 < eξ < 0.002 and a jet R parameter of 0.5 [15]. The result is also compatible with that obtained at lower centre-of-mass energy at the Tevatron [7], which was re-evaluated in a subsequent NLO analysis [49] to be between 0.05 and 0.3, depending on the fraction of the pomeron momentum carried by the parton entering the hard scattering. Theoretical predictions for S2 at the LHC [50, 51] are also compatible with the result here, although the predicted decrease with increasing centre-of-mass energy is not yet established.
7 Conclusions
An ATLAS measurement of the cross section for dijet production in association with forward rapidity gaps is reported, based on 6.8 nb−1low pile-up 7 TeV pp collision data taken at the LHC in 2010. The data are characterised according to the size of the forward rapidity gap, quantified by ∆ηFand ˜ξ, which for the single-diffractive case approximates the fractional longitudinal momentum loss of the scattered proton using the information available within the detector acceptance. Non-diffractive Monte Carlo models are capable of describing the data over a wide kinematic range. However, a diffractive component is also required for a more complete description of the data, particularly when both large ∆ηFand small ˜ξ are required. The PYTHIA8 model gives the best description of the shape and normalisation of this contribution.
The rapidity-gap survival probability is estimated by comparing the measured cross section for events with both large ∆ηFand small ˜ξ with the leading-order POMWIG Monte Carlo model of the diffractive
contri-bution, derived from diffractive parton distribution functions extracted in deep inelastic ep scattering. This determination is limited by the uncertainties associated with the non-diffractive and double-dissociation contributions, the result being S2= 0.16 ± 0.04 (stat.) ± 0.08 (exp. syst.).
Acknowledgements
We thank CERN for the very successful operation of the LHC, as well as the support staff from our institutions without whom ATLAS could not be operated efficiently.
We acknowledge the support of ANPCyT, Argentina; YerPhI, Armenia; ARC, Australia; BMWFW and FWF, Austria; ANAS, Azerbaijan; SSTC, Belarus; CNPq and FAPESP, Brazil; NSERC, NRC and
CFI, Canada; CERN; CONICYT, Chile; CAS, MOST and NSFC, China; COLCIENCIAS, Colombia; MSMT CR, MPO CR and VSC CR, Czech Republic; DNRF, DNSRC and Lundbeck Foundation, Den-mark; IN2P3-CNRS, CEA-DSM/IRFU, France; GNSF, Georgia; BMBF, HGF, and MPG, Germany; GSRT, Greece; RGC, Hong Kong SAR, China; ISF, I-CORE and Benoziyo Center, Israel; INFN, Italy; MEXT and JSPS, Japan; CNRST, Morocco; FOM and NWO, Netherlands; RCN, Norway; MNiSW and NCN, Poland; FCT, Portugal; MNE/IFA, Romania; MES of Russia and NRC KI, Russian Feder-ation; JINR; MESTD, Serbia; MSSR, Slovakia; ARRS and MIZŠ, Slovenia; DST/NRF, South Africa; MINECO, Spain; SRC and Wallenberg Foundation, Sweden; SERI, SNSF and Cantons of Bern and Geneva, Switzerland; MOST, Taiwan; TAEK, Turkey; STFC, United Kingdom; DOE and NSF, United States of America. In addition, individual groups and members have received support from BCKDF, the Canada Council, CANARIE, CRC, Compute Canada, FQRNT, and the Ontario Innovation Trust, Canada; EPLANET, ERC, FP7, Horizon 2020 and Marie Skłodowska-Curie Actions, European Union; Investisse-ments d’Avenir Labex and Idex, ANR, Region Auvergne and Fondation Partager le Savoir, France; DFG and AvH Foundation, Germany; Herakleitos, Thales and Aristeia programmes co-financed by EU-ESF and the Greek NSRF; BSF, GIF and Minerva, Israel; BRF, Norway; the Royal Society and Leverhulme Trust, United Kingdom.
The crucial computing support from all WLCG partners is acknowledged gratefully, in particular from CERN and the ATLAS Tier-1 facilities at TRIUMF (Canada), NDGF (Denmark, Norway, Sweden), CC-IN2P3 (France), KIT/GridKA (Germany), INFN-CNAF (Italy), NL-T1 (Netherlands), PIC (Spain), ASGC (Taiwan), RAL (UK) and BNL (USA) and in the Tier-2 facilities worldwide.
References
[1] ATLAS Collaboration,
Measurement of the inelastic proton–proton cross-section at √s = 7 TeV with the ATLAS detector,
Nature Commun. 2 (2011) 463, arXiv:1104.0326 [hep-ex].
[2] ATLAS Collaboration,
Rapidity gap cross sections measured with the ATLAS detector in pp collisions at √s = 7 TeV,
Eur. Phys. J. C 72 (2012) 1926, arXiv:1201.2808 [hep-ex].
[3] CMS Collaboration,
Measurement of diffraction dissociation cross sections in pp collisions at √s = 7 TeV,
Phys. Rev. D92 (2015) 012003, arXiv:1503.08689 [hep-ex].
[4] R. Bonino et al. (UA8 Collaboration), Evidence for Transverse Jets in High Mass Diffraction,
Phys. Lett. B211 (1988) 239.
[5] C. Adloff et al. (H1 Collaboration),
Diffractive jet production in deep inelastic e+p collisions at HERA,
Eur. Phys. J. C20 (2001) 29–49, arXiv:hep-ex/0012051 [hep-ex].
[6] F. D. Aaron et al. (H1 Collaboration),
Diffractive Dijet Photoproduction in ep Collisions at HERA, Eur. Phys. J. C70 (2010) 15–37,
arXiv:1006.0946 [hep-ex].
[7] T. Affolder et al. (CDF Collaboration),
Diffractive dijets with a leading antiproton in ¯pp collisions at √s = 1800 GeV,
[8] G. Ingelman and P. Schlein, Jet Structure in High Mass Diffractive Scattering,
Phys. Lett. B152 (1985) 256.
[9] E. Feinberg and I. Pomeranchuk, High-energy inelastic diffraction phenomena, Suppl. Nuovo Cimento 3 (1956) 652.
[10] P. Newman and M. Wing, The Hadronic Final State at HERA, Rev. Mod. Phys. 86 (2014) 1037, arXiv:1308.3368 [hep-ex].
[11] A. Aktas et al. (H1 Collaboration), Measurement and QCD analysis of the diffractive
deep-inelastic scattering cross-section at HERA, Eur. Phys. J. C48 (2006) 715–748,
arXiv:hep-ex/0606004 [hep-ex].
[12] S. Chekanov et al. (ZEUS Collaboration), A QCD analysis of ZEUS diffractive data,
Nucl.Phys. B831 (2010) 1–25, arXiv:0911.4119 [hep-ex].
[13] A. Aktas et al. (H1 Collaboration), Tests of QCD factorisation in the diffractive production of
dijets in deep-inelastic scattering and photoproduction at HERA,
Eur. Phys. J. C51 (2007) 549–568, arXiv:hep-ex/0703022 [hep-ex].
[14] V. Andreev et al., Diffractive Dijet Production with a Leading Proton in ep Collisions at HERA,
JHEP 05 (2015) 056, arXiv:1502.01683 [hep-ex].
[15] CMS Collaboration, Observation of a diffractive contribution to dijet production in proton–proton
collisions at √s = 7 TeV, Phys. Rev. D 87 (2013) 012006, arXiv:1209.1805 [hep-ex].
[16] ATLAS Collaboration, Measurement of underlying event characteristics using charged particles
in pp collisions at √s = 900 GeV and 7 TeV with the ATLAS detector,
Phys. Rev. D 83 (2011) 112001, arXiv:1012.0791 [hep-ex].
[17] ATLAS Collaboration, Measurement of the underlying event in jet events from 7 TeV
proton–proton collisions with the ATLAS detector, Eur. Phys. J. C 74 (2014) 2965,
arXiv:1406.0392 [hep-ex].
[18] ATLAS Collaboration, Measurement of distributions sensitive to the underlying event in inclusive
Z-boson production in pp collisions at √s = 7 TeV with the ATLAS detector,
Eur. Phys. J. C 74 (2014) 3195, arXiv:1409.3433 [hep-ex].
[19] T. Sjöstrand, S. Mrenna and P. Z. Skands, A Brief Introduction to PYTHIA 8.1,
Comput. Phys. Commun. 178 (2008) 852–867, arXiv:0710.3820 [hep-ph].
[20] B. E. Cox and J. R. Forshaw, POMWIG: HERWIG for diffractive interactions,
Comput. Phys. Commun. 144 (2002) 104–110, arXiv:hep-ph/0010303 [hep-ph].
[21] P. Nason, A New method for combining NLO QCD with shower Monte Carlo algorithms,
JHEP 0411 (2004) 040, arXiv:hep-ph/0409146 [hep-ph].
[22] S. Alioli et al., Jet pair production in POWHEG, JHEP 1104 (2011) 081, arXiv:1012.3380 [hep-ph].
[23] D. Stump et al., Inclusive jet production, parton distributions, and the search for new physics,
JHEP 0310 (2003) 046, arXiv:hep-ph/0303013 [hep-ph].
[24] S. Navin, Diffraction in Pythia (2010), arXiv:1005.3894 [hep-ph]. [25] T. Sjöstrand, S. Mrenna and P. Z. Skands, PYTHIA 6.4 Physics and Manual,
[26] H.-L. Lai et al., New parton distributions for collider physics, Phys. Rev. D82 (2010) 074024, arXiv:1007.2241 [hep-ph].
[27] G. A. Schuler and T. Sjöstrand,
Hadronic diffractive cross-sections and the rise of the total cross-section,
Phys. Rev. D49 (1994) 2257–2267.
[28] A. Donnachie and P. Landshoff, Elastic Scattering and Diffraction Dissociation,
Nucl. Phys. B244 (1984) 322.
[29] E. L. Berger et al., Diffractive Hard Scattering, Nucl. Phys. B286 (1987) 704.
[30] K. Streng, Hard QCD scatterings in diffractive reactions at HERA, CERN-TH-4949 (1988). [31] R. Ciesielski and K. Goulianos, MBR Monte Carlo Simulation in PYTHIA8,
PoS ICHEP2012 (2013) 301, arXiv:1205.1446 [hep-ph].
[32] B. Andersson et al., Parton Fragmentation and String Dynamics, Phys. Rept. 97 (1983) 31–145. [33] G. Marchesini et al., HERWIG: A Monte Carlo event generator for simulating hadron emission
reactions with interfering gluons. Version 5.1 - April 1991,
Comput. Phys. Commun. 67 (1992) 465–508.
[34] ATLAS Collaboration, Summary of ATLAS Pythia 8 tunes, ATL-PHYS-PUB-2012-003, 2012,
url:http://cds.cern.ch/record/1474107.
[35] S. Agostinelli et al., GEANT4: A simulation toolkit, Nucl. Instrum. Meth. A506 (2003) 250. [36] ATLAS Collaboration, The ATLAS Simulation Infrastructure, Eur. Phys. J. C 70 (2010) 823,
arXiv:1005.4568 [hep-ex].
[37] ATLAS Collaboration, The ATLAS Experiment at the CERN Large Hadron Collider,
JINST 3 (2008) S08003.
[38] ATLAS Collaboration,
Luminosity determination in pp collisions at √s = 7 TeV using the ATLAS detector at the LHC,
Eur. Phys. J. C 71 (2011) 1630, arXiv:1101.2185 [hep-ex].
[39] ATLAS Collaboration, Improved luminosity determination in pp collisions at √s = 7 TeV using
the ATLAS detector at the LHC, Eur. Phys. J. C 73 (2013) 2518, arXiv:1302.4393 [hep-ex].
[40] ATLAS Collaboration, Measurement of inclusive jet and dijet production in pp collisions at
√
s = 7 TeV using the ATLAS detector, Phys. Rev. D 86 (2012) 014022,
arXiv:1112.6297 [hep-ex].
[41] M. Cacciari, G. P. Salam and G. Soyez, The Anti-k(t) jet clustering algorithm,
JHEP 0804 (2008) 063, arXiv:0802.1189 [hep-ph].
[42] ATLAS Collaboration,
Charged-particle multiplicities in pp interactions measured with the ATLAS detector at the LHC,
New J. Phys. 13 (2011) 053033, arXiv:1012.5104 [hep-ex].
[43] ATLAS Collaboration, Measurements of the pseudorapidity dependence of the total transverse
energy in proton–proton collisions at √s = 7 TeV with ATLAS, JHEP 1211 (2012) 033,
arXiv:1208.6256 [hep-ex].
[44] B. Malaescu, An Iterative, Dynamically Stabilized(IDS) Method of Data Unfolding(2011), arXiv:1106.3107 [physics.data-an].
[45] ATLAS Collaboration, Jet energy measurement and its systematic uncertainty in proton–proton
collisions at √s = 7 TeV with the ATLAS detector, Eur. Phys. J. C 75 (2015) 17,
arXiv:1406.0076 [hep-ex].
[46] ATLAS Collaboration, Jet energy resolution in proton–proton collisions at √s = 7 TeV recorded
in 2010 with the ATLAS detector, Eur. Phys. J. C 73 (2013) 2306, arXiv:1210.6210 [hep-ex].
[47] HepData (2015), url:hepdata.cedar.ac.uk.
[48] A. Aktas et al. (H1 Collaboration),
Diffractive deep-inelastic scattering with a leading proton at HERA,
Eur. Phys. J. C48 (2006) 749–766, arXiv:hep-ex/0606003 [hep-ex].
[49] M. Klasen and G. Kramer, Survival probability for diffractive dijet production in p anti-p
collisions from next-to-leading order calculations, Phys. Rev. D80 (2009) 074006,
arXiv:0908.2531 [hep-ph].
[50] A. Kaidalov et al., Factorization breaking in diffractive dijet production,
Phys. Lett. B559 (2003) 235–238, arXiv:hep-ph/0302091 [hep-ph].
[51] V. A. Khoze, A. D. Martin and M. Ryskin,
Soft diffraction and the elastic slope at Tevatron and LHC energies: A MultiPomeron approach,
The ATLAS Collaboration
G. Aad85, B. Abbott113, J. Abdallah151, O. Abdinov11, R. Aben107, M. Abolins90, O.S. AbouZeid158, H. Abramowicz153, H. Abreu152, R. Abreu116, Y. Abulaiti146a,146b, B.S. Acharya164a,164b ,a,
L. Adamczyk38a, D.L. Adams25, J. Adelman108, S. Adomeit100, T. Adye131, A.A. Affolder74, T. Agatonovic-Jovin13, J. Agricola54, J.A. Aguilar-Saavedra126a,126f, S.P. Ahlen22, F. Ahmadov65,b, G. Aielli133a,133b, H. Akerstedt146a,146b, T.P.A. Åkesson81, A.V. Akimov96, G.L. Alberghi20a,20b, J. Albert169, S. Albrand55, M.J. Alconada Verzini71, M. Aleksa30, I.N. Aleksandrov65, C. Alexa26b,
G. Alexander153, T. Alexopoulos10, M. Alhroob113, G. Alimonti91a, L. Alio85, J. Alison31, S.P. Alkire35, B.M.M. Allbrooke149, P.P. Allport18, A. Aloisio104a,104b, A. Alonso36, F. Alonso71, C. Alpigiani138, A. Altheimer35, B. Alvarez Gonzalez30, D. Álvarez Piqueras167, M.G. Alviggi104a,104b, B.T. Amadio15,
K. Amako66, Y. Amaral Coutinho24a, C. Amelung23, D. Amidei89, S.P. Amor Dos Santos126a,126c, A. Amorim126a,126b, S. Amoroso48, N. Amram153, G. Amundsen23, C. Anastopoulos139, L.S. Ancu49, N. Andari108, T. Andeen35, C.F. Anders58b, G. Anders30, J.K. Anders74, K.J. Anderson31,
A. Andreazza91a,91b, V. Andrei58a, S. Angelidakis9, I. Angelozzi107, P. Anger44, A. Angerami35, F. Anghinolfi30, A.V. Anisenkov109 ,c, N. Anjos12, A. Annovi124a,124b, M. Antonelli47, A. Antonov98, J. Antos144b, F. Anulli132a, M. Aoki66, L. Aperio Bella18, G. Arabidze90, Y. Arai66, J.P. Araque126a, A.T.H. Arce45, F.A. Arduh71, J-F. Arguin95, S. Argyropoulos63, M. Arik19a, A.J. Armbruster30, O. Arnaez30, H. Arnold48, M. Arratia28, O. Arslan21, A. Artamonov97, G. Artoni23, S. Asai155, N. Asbah42, A. Ashkenazi153, B. Åsman146a,146b, L. Asquith149, K. Assamagan25, R. Astalos144a, M. Atkinson165, N.B. Atlay141, K. Augsten128, M. Aurousseau145b, G. Avolio30, B. Axen15, M.K. Ayoub117, G. Azuelos95,d, M.A. Baak30, A.E. Baas58a, M.J. Baca18, C. Bacci134a,134b,
H. Bachacou136, K. Bachas154, M. Backes30, M. Backhaus30, P. Bagiacchi132a,132b, P. Bagnaia132a,132b, Y. Bai33a, T. Bain35, J.T. Baines131, O.K. Baker176, E.M. Baldin109,c, P. Balek129, T. Balestri148, F. Balli84, W.K. Balunas122, E. Banas39, Sw. Banerjee173, A.A.E. Bannoura175, L. Barak30,
E.L. Barberio88, D. Barberis50a,50b, M. Barbero85, T. Barillari101, M. Barisonzi164a,164b, T. Barklow143, N. Barlow28, S.L. Barnes84, B.M. Barnett131, R.M. Barnett15, Z. Barnovska5, A. Baroncelli134a, G. Barone23, A.J. Barr120, F. Barreiro82, J. Barreiro Guimarães da Costa57, R. Bartoldus143,
A.E. Barton72, P. Bartos144a, A. Basalaev123, A. Bassalat117, A. Basye165, R.L. Bates53, S.J. Batista158, J.R. Batley28, M. Battaglia137, M. Bauce132a,132b, F. Bauer136, H.S. Bawa143,e, J.B. Beacham111, M.D. Beattie72, T. Beau80, P.H. Beauchemin161, R. Beccherle124a,124b, P. Bechtle21, H.P. Beck17, f, K. Becker120, M. Becker83, M. Beckingham170, C. Becot117, A.J. Beddall19b, A. Beddall19b, V.A. Bednyakov65, C.P. Bee148, L.J. Beemster107, T.A. Beermann30, M. Begel25, J.K. Behr120,
C. Belanger-Champagne87, W.H. Bell49, G. Bella153, L. Bellagamba20a, A. Bellerive29, M. Bellomo86, K. Belotskiy98, O. Beltramello30, O. Benary153, D. Benchekroun135a, M. Bender100, K. Bendtz146a,146b, N. Benekos10, Y. Benhammou153, E. Benhar Noccioli49, J.A. Benitez Garcia159b, D.P. Benjamin45, J.R. Bensinger23, S. Bentvelsen107, L. Beresford120, M. Beretta47, D. Berge107,
E. Bergeaas Kuutmann166, N. Berger5, F. Berghaus169, J. Beringer15, C. Bernard22, N.R. Bernard86, C. Bernius110, F.U. Bernlochner21, T. Berry77, P. Berta129, C. Bertella83, G. Bertoli146a,146b,
F. Bertolucci124a,124b, C. Bertsche113, D. Bertsche113, M.I. Besana91a, G.J. Besjes36, O. Bessidskaia Bylund146a,146b, M. Bessner42, N. Besson136, C. Betancourt48, S. Bethke101, A.J. Bevan76, W. Bhimji15, R.M. Bianchi125, L. Bianchini23, M. Bianco30, O. Biebel100,
D. Biedermann16, S.P. Bieniek78, N.V. Biesuz124a,124b, M. Biglietti134a, J. Bilbao De Mendizabal49, H. Bilokon47, M. Bindi54, S. Binet117, A. Bingul19b, C. Bini132a,132b, S. Biondi20a,20b, D.M. Bjergaard45, C.W. Black150, J.E. Black143, K.M. Black22, D. Blackburn138, R.E. Blair6, J.-B. Blanchard136,
G.J. Bobbink107, V.S. Bobrovnikov109 ,c, S.S. Bocchetta81, A. Bocci45, C. Bock100, M. Boehler48, J.A. Bogaerts30, D. Bogavac13, A.G. Bogdanchikov109, C. Bohm146a, V. Boisvert77, T. Bold38a, V. Boldea26b, A.S. Boldyrev99, M. Bomben80, M. Bona76, M. Boonekamp136, A. Borisov130, G. Borissov72, S. Borroni42, J. Bortfeldt100, V. Bortolotto60a,60b,60c, K. Bos107, D. Boscherini20a, M. Bosman12, J. Boudreau125, J. Bouffard2, E.V. Bouhova-Thacker72, D. Boumediene34,
C. Bourdarios117, N. Bousson114, S.K. Boutle53, A. Boveia30, J. Boyd30, I.R. Boyko65, I. Bozic13, J. Bracinik18, A. Brandt8, G. Brandt54, O. Brandt58a, U. Bratzler156, B. Brau86, J.E. Brau116, H.M. Braun175,∗, W.D. Breaden Madden53, K. Brendlinger122, A.J. Brennan88, L. Brenner107, R. Brenner166, S. Bressler172, T.M. Bristow46, D. Britton53, D. Britzger42, F.M. Brochu28, I. Brock21, R. Brock90, J. Bronner101, G. Brooijmans35, T. Brooks77, W.K. Brooks32b, J. Brosamer15, E. Brost116, P.A. Bruckman de Renstrom39, D. Bruncko144b, R. Bruneliere48, A. Bruni20a, G. Bruni20a,
M. Bruschi20a, N. Bruscino21, L. Bryngemark81, T. Buanes14, Q. Buat142, P. Buchholz141,
A.G. Buckley53, S.I. Buda26b, I.A. Budagov65, F. Buehrer48, L. Bugge119, M.K. Bugge119, O. Bulekov98, D. Bullock8, H. Burckhart30, S. Burdin74, C.D. Burgard48, B. Burghgrave108, S. Burke131,
I. Burmeister43, E. Busato34, D. Büscher48, V. Büscher83, P. Bussey53, J.M. Butler22, A.I. Butt3, C.M. Buttar53, J.M. Butterworth78, P. Butti107, W. Buttinger25, A. Buzatu53, A.R. Buzykaev109 ,c,
S. Cabrera Urbán167, D. Caforio128, V.M. Cairo37a,37b, O. Cakir4a, N. Calace49, P. Calafiura15, A. Calandri136, G. Calderini80, P. Calfayan100, L.P. Caloba24a, D. Calvet34, S. Calvet34,
R. Camacho Toro31, S. Camarda42, P. Camarri133a,133b, D. Cameron119, R. Caminal Armadans165, S. Campana30, M. Campanelli78, A. Campoverde148, V. Canale104a,104b, A. Canepa159a, M. Cano Bret33e, J. Cantero82, R. Cantrill126a, T. Cao40, M.D.M. Capeans Garrido30, I. Caprini26b, M. Caprini26b,
M. Capua37a,37b, R. Caputo83, R.M. Carbone35, R. Cardarelli133a, F. Cardillo48, T. Carli30,
G. Carlino104a, L. Carminati91a,91b, S. Caron106, E. Carquin32a, G.D. Carrillo-Montoya30, J.R. Carter28, J. Carvalho126a,126c, D. Casadei78, M.P. Casado12, M. Casolino12, E. Castaneda-Miranda145a,
A. Castelli107, V. Castillo Gimenez167, N.F. Castro126a,g, P. Catastini57, A. Catinaccio30, J.R. Catmore119, A. Cattai30, J. Caudron83, V. Cavaliere165, D. Cavalli91a, M. Cavalli-Sforza12, V. Cavasinni124a,124b, F. Ceradini134a,134b, B.C. Cerio45, K. Cerny129, A.S. Cerqueira24b, A. Cerri149, L. Cerrito76, F. Cerutti15, M. Cerv30, A. Cervelli17, S.A. Cetin19c, A. Chafaq135a, D. Chakraborty108, I. Chalupkova129,
Y.L. Chan60a, P. Chang165, J.D. Chapman28, D.G. Charlton18, C.C. Chau158, C.A. Chavez Barajas149,
S. Cheatham152, A. Chegwidden90, S. Chekanov6, S.V. Chekulaev159a, G.A. Chelkov65,h, M.A. Chelstowska89, C. Chen64, H. Chen25, K. Chen148, L. Chen33d,i, S. Chen33c, S. Chen155, X. Chen33f, Y. Chen67, H.C. Cheng89, Y. Cheng31, A. Cheplakov65, E. Cheremushkina130, R. Cherkaoui El Moursli135e, V. Chernyatin25 ,∗, E. Cheu7, L. Chevalier136, V. Chiarella47,
G. Chiarelli124a,124b, G. Chiodini73a, A.S. Chisholm18, R.T. Chislett78, A. Chitan26b, M.V. Chizhov65, K. Choi61, S. Chouridou9, B.K.B. Chow100, V. Christodoulou78, D. Chromek-Burckhart30,
J. Chudoba127, A.J. Chuinard87, J.J. Chwastowski39, L. Chytka115, G. Ciapetti132a,132b, A.K. Ciftci4a, D. Cinca53, V. Cindro75, I.A. Cioara21, A. Ciocio15, F. Cirotto104a,104b, Z.H. Citron172, M. Ciubancan26b, A. Clark49, B.L. Clark57, P.J. Clark46, R.N. Clarke15, C. Clement146a,146b, Y. Coadou85,
M. Cobal164a,164c, A. Coccaro49, J. Cochran64, L. Coffey23, J.G. Cogan143, L. Colasurdo106, B. Cole35, S. Cole108, A.P. Colijn107, J. Collot55, T. Colombo58c, G. Compostella101, P. Conde Muiño126a,126b, E. Coniavitis48, S.H. Connell145b, I.A. Connelly77, V. Consorti48, S. Constantinescu26b, C. Conta121a,121b, G. Conti30, F. Conventi104a , j, M. Cooke15, B.D. Cooper78, A.M. Cooper-Sarkar120, T. Cornelissen175, M. Corradi20a, F. Corriveau87 ,k, A. Corso-Radu163, A. Cortes-Gonzalez12, G. Cortiana101, G. Costa91a, M.J. Costa167, D. Costanzo139, D. Côté8, G. Cottin28, G. Cowan77, B.E. Cox84, K. Cranmer110, G. Cree29, S. Crépé-Renaudin55, F. Crescioli80, W.A. Cribbs146a,146b, M. Crispin Ortuzar120, M. Cristinziani21, V. Croft106, G. Crosetti37a,37b, T. Cuhadar Donszelmann139, J. Cummings176, M. Curatolo47, J. Cúth83, C. Cuthbert150, H. Czirr141, P. Czodrowski3, S. D’Auria53, M. D’Onofrio74,
M.J. Da Cunha Sargedas De Sousa126a,126b, C. Da Via84, W. Dabrowski38a, A. Dafinca120, T. Dai89, O. Dale14, F. Dallaire95, C. Dallapiccola86, M. Dam36, J.R. Dandoy31, N.P. Dang48, A.C. Daniells18, M. Danninger168, M. Dano Hoffmann136, V. Dao48, G. Darbo50a, S. Darmora8, J. Dassoulas3,
A. Dattagupta61, W. Davey21, C. David169, T. Davidek129, E. Davies120,l, M. Davies153, P. Davison78, Y. Davygora58a, E. Dawe88, I. Dawson139, R.K. Daya-Ishmukhametova86, K. De8, R. de Asmundis104a, A. De Benedetti113, S. De Castro20a,20b, S. De Cecco80, N. De Groot106, P. de Jong107, H. De la Torre82, F. De Lorenzi64, D. De Pedis132a, A. De Salvo132a, U. De Sanctis149, A. De Santo149,
J.B. De Vivie De Regie117, W.J. Dearnaley72, R. Debbe25, C. Debenedetti137, D.V. Dedovich65, I. Deigaard107, J. Del Peso82, T. Del Prete124a,124b, D. Delgove117, F. Deliot136, C.M. Delitzsch49, M. Deliyergiyev75, A. Dell’Acqua30, L. Dell’Asta22, M. Dell’Orso124a,124b, M. Della Pietra104a, j, D. della Volpe49, M. Delmastro5, P.A. Delsart55, C. Deluca107, D.A. DeMarco158, S. Demers176, M. Demichev65, A. Demilly80, S.P. Denisov130, D. Derendarz39, J.E. Derkaoui135d, F. Derue80, P. Dervan74, K. Desch21, C. Deterre42, K. Dette43, P.O. Deviveiros30, A. Dewhurst131, S. Dhaliwal23, A. Di Ciaccio133a,133b, L. Di Ciaccio5, A. Di Domenico132a,132b, C. Di Donato104a,104b, A. Di Girolamo30, B. Di Girolamo30, A. Di Mattia152, B. Di Micco134a,134b, R. Di Nardo47, A. Di Simone48, R. Di Sipio158, D. Di Valentino29, C. Diaconu85, M. Diamond158, F.A. Dias46, M.A. Diaz32a, E.B. Diehl89, J. Dietrich16,
S. Diglio85, A. Dimitrievska13, J. Dingfelder21, P. Dita26b, S. Dita26b, F. Dittus30, F. Djama85, T. Djobava51b, J.I. Djuvsland58a, M.A.B. do Vale24c, D. Dobos30, M. Dobre26b, C. Doglioni81, T. Dohmae155, J. Dolejsi129, Z. Dolezal129, B.A. Dolgoshein98 ,∗, M. Donadelli24d, S. Donati124a,124b, P. Dondero121a,121b, J. Donini34, J. Dopke131, A. Doria104a, M.T. Dova71, A.T. Doyle53, E. Drechsler54, M. Dris10, E. Dubreuil34, E. Duchovni172, G. Duckeck100, O.A. Ducu26b,85, D. Duda107, A. Dudarev30, L. Duflot117, L. Duguid77, M. Dührssen30, M. Dunford58a, H. Duran Yildiz4a, M. Düren52,
A. Durglishvili51b, D. Duschinger44, B. Dutta42, M. Dyndal38a, C. Eckardt42, K.M. Ecker101, R.C. Edgar89, W. Edson2, N.C. Edwards46, W. Ehrenfeld21, T. Eifert30, G. Eigen14, K. Einsweiler15, T. Ekelof166, M. El Kacimi135c, M. Ellert166, S. Elles5, F. Ellinghaus175, A.A. Elliot169, N. Ellis30, J. Elmsheuser100, M. Elsing30, D. Emeliyanov131, Y. Enari155, O.C. Endner83, M. Endo118, J. Erdmann43, A. Ereditato17, G. Ernis175, J. Ernst2, M. Ernst25, S. Errede165, E. Ertel83, M. Escalier117, H. Esch43, C. Escobar125, B. Esposito47, A.I. Etienvre136, E. Etzion153, H. Evans61, A. Ezhilov123, L. Fabbri20a,20b, G. Facini31, R.M. Fakhrutdinov130, S. Falciano132a, R.J. Falla78, J. Faltova129, Y. Fang33a,
M. Fanti91a,91b, A. Farbin8, A. Farilla134a, T. Farooque12, S. Farrell15, S.M. Farrington170, P. Farthouat30, F. Fassi135e, P. Fassnacht30, D. Fassouliotis9, M. Faucci Giannelli77, A. Favareto50a,50b, L. Fayard117, O.L. Fedin123,m, W. Fedorko168, S. Feigl30, L. Feligioni85, C. Feng33d, E.J. Feng30, H. Feng89, A.B. Fenyuk130, L. Feremenga8, P. Fernandez Martinez167, S. Fernandez Perez30, J. Ferrando53, A. Ferrari166, P. Ferrari107, R. Ferrari121a, D.E. Ferreira de Lima53, A. Ferrer167, D. Ferrere49, C. Ferretti89, A. Ferretto Parodi50a,50b, M. Fiascaris31, F. Fiedler83, A. Filipˇciˇc75, M. Filipuzzi42, F. Filthaut106, M. Fincke-Keeler169, K.D. Finelli150, M.C.N. Fiolhais126a,126c, L. Fiorini167, A. Firan40, A. Fischer2, C. Fischer12, J. Fischer175, W.C. Fisher90, N. Flaschel42, I. Fleck141, P. Fleischmann89, G.T. Fletcher139, G. Fletcher76, R.R.M. Fletcher122, T. Flick175, A. Floderus81, L.R. Flores Castillo60a, M.J. Flowerdew101, A. Formica136, A. Forti84, D. Fournier117, H. Fox72, S. Fracchia12, P. Francavilla80, M. Franchini20a,20b, D. Francis30, L. Franconi119, M. Franklin57, M. Frate163, M. Fraternali121a,121b, D. Freeborn78, S.T. French28, F. Friedrich44, D. Froidevaux30, J.A. Frost120, C. Fukunaga156,
E. Fullana Torregrosa83, B.G. Fulsom143, T. Fusayasu102, J. Fuster167, C. Gabaldon55, O. Gabizon175, A. Gabrielli20a,20b, A. Gabrielli15, G.P. Gach18, S. Gadatsch30, S. Gadomski49, G. Gagliardi50a,50b, P. Gagnon61, C. Galea106, B. Galhardo126a,126c, E.J. Gallas120, B.J. Gallop131, P. Gallus128, G. Galster36, K.K. Gan111, J. Gao33b,85, Y. Gao46, Y.S. Gao143,e, F.M. Garay Walls46, F. Garberson176, C. García167, J.E. García Navarro167, M. Garcia-Sciveres15, R.W. Gardner31, N. Garelli143, V. Garonne119, C. Gatti47, A. Gaudiello50a,50b, G. Gaudio121a, B. Gaur141, L. Gauthier95, P. Gauzzi132a,132b, I.L. Gavrilenko96,