EUROPEAN ORGANIZATION FOR NUCLEAR RESEARCH (CERN)
CERN-EP-2018-037 2018/09/25
CMS-B2G-17-013
Search for a heavy resonance decaying into a Z boson and a
Z or W boson in 2
`
2q final states at
√
s
=
13 TeV
The CMS Collaboration
∗Abstract
A search has been performed for heavy resonances decaying to ZZ or ZW in 2`2q
final states, with two charged leptons (` =e, µ) produced by the decay of a Z boson,
and two quarks produced by the decay of a W or Z boson. The analysis is sensitive to resonances with masses in the range from 400 to 4500 GeV. Two categories are de-fined based on the merged or resolved reconstruction of the hadronically decaying vector boson, optimized for high- and low-mass resonances, respectively. The search is based on data collected during 2016 by the CMS experiment at the LHC in
proton-proton collisions with a center-of-mass energy of √s = 13 TeV, corresponding to an
integrated luminosity of 35.9 fb−1. No excess is observed in the data above the
stan-dard model background expectation. Upper limits on the production cross section of heavy, narrow spin-1 and spin-2 resonances are derived as a function of the resonance
mass, and exclusion limits on the production of W0bosons and bulk graviton particles
are calculated in the framework of the heavy vector triplet model and warped extra dimensions, respectively.
Published in the Journal of High Energy Physics as doi:10.1007/JHEP09(2018)101.
c
2018 CERN for the benefit of the CMS Collaboration. CC-BY-4.0 license
∗See Appendix A for the list of collaboration members
1
1
Introduction
The validity of the standard model (SM) of particle physics is corroborated by a wide set of pre-cise experimental results with an impressive level of accuracy. Nonetheless, there are several open points where the SM fails to provide an explanation, either for experimental observations, as in the case of the presence of dark matter in the universe, or for theoretical questions, such as the omission of gravity from the SM, and the hierarchy problem.
Several SM extensions addressing the open questions of the SM predict the presence of new heavy particles with an enhanced branching fraction for decays into pairs of vector bosons. The existence of heavy spin-2 gravitons (G) is predicted in the Randall–Sundrum model with warped extra spatial dimensions (WED) [1–3]. In the bulk scenario [4, 5], the main free parame-ters are the mass of the first Kaluza–Klein graviton excitation (the bulk graviton mass), and the
ratioeκ ≡κ/MPl, where κ is a curvature parameter of the WED metric and MPl≡ MPl/
√ 8π is
the reduced Planck mass. The introduction of a spin-1 triplet of Z0 and W0 bosons is described
in the heavy vector triplet (HVT) model [6], which generalizes a large number of explicit
mod-els in terms of a small set of parameters: cH, controlling the interactions of the triplet with the
SM vector and Higgs bosons; cF, which describes the direct interaction with fermions; and gV,
which represents the overall strength of the new vector boson triplet interactions.
A variety of searches for heavy resonances decaying to two vector bosons have been carried out in the past. The most recent results from the CERN LHC [7–11], with no evidence of signal, have provided stringent upper limits on signal cross sections in these models.
This paper reports on the results of a search for heavy, narrow resonances (collectively indicated
as X) decaying into 2`2q final states, with two charged leptons (` = e, µ) produced by the
leptonic decay of a Z boson and a pair of quarks produced from the hadronic decay of a vector boson (V = W or Z). In the narrow-width assumption, the width of the heavy resonance is taken to be small in comparison to the experimental resolution. Two complementary search strategies
are defined to span the mass range 400 < mX < 4500 GeV, where mXis the mass of the heavy
resonance. The first strategy, referred to as the “high-mass analysis”, is optimized for the range
850<mX <4500 GeV by selecting events where the vector bosons have a large Lorentz boost,
resulting in the collimation of their decay products. The high-mass analysis uses dedicated leptonic reconstruction and identification techniques to reconstruct leptons in close proximity to each other in order to retain high signal efficiency, as well as jet substructure techniques to identify the hadronic decay of the W or Z boson into a pair of quarks contained in a single merged reconstructed jet. For lower resonance masses, the quarks produced by the hadronic decay of the V boson may be sufficiently separated to be reconstructed as two single narrow jets (dijet). A second strategy, referred to as the “low-mass analysis”, is therefore defined in this regime, exploiting dijet reconstruction in addition to the reconstruction of merged jets to retain
signal efficiency in the range 400 < mX < 850 GeV for those events in which no merged V
candidate is found. To increase the signal sensitivity, in the low-mass analysis a categorization based on the flavor of the jets is used, to exploit the relatively large decay branching fraction of the Z boson to pairs of b quarks.
This paper is organized as follows: in Section 2, a description of the data and simulated samples used in the analysis is provided; Section 3 briefly describes the CMS detector; Section 4 provides a description of the event reconstruction; in Section 5, the event selection is discussed; Section 6 contains the description of the signal and describes the estimation of the SM background; the systematic uncertainties affecting the analysis are presented in Section 7; and the results of the search for heavy spin-1 and spin-2 resonances are presented in Section 8. Finally, results are summarized in Section 9.
2
Data and simulated samples
This analysis uses data collected by the CMS detector during proton-proton (pp) collisions at
the LHC at√s = 13 TeV, corresponding to an integrated luminosity of 35.9 fb−1. The events
were selected online by criteria that require the presence of at least one electron or muon; these criteria are described in Sec. 5.
Simulated signal samples are used in the analysis to optimize the search for the potential pro-duction of heavy spin-1 or spin-2 resonances. For this purpose, signal samples are generated according to the HVT and WED scenarios, respectively. For both scenarios, the samples are
generated at leading order (LO) in QCD with the MADGRAPH5 [email protected] generator [12].
Two HVT models are considered as benchmarks, “model A” and “model B”, with different
values of the three defining parameters described earlier: for “model A”, gV=1, cH = −0.556,
and cF= −1.316, while for “model B”, gV=3, cH = −0.976, and cF=1.024.
Different resonance mass hypotheses are considered in the range from 400 to 4500 GeV. The
resonance width is predicted to be between 0.4 and 2.3 GeV for a W0 candidate in HVT model
A, and between 14 and 64 GeV for HVT model B, depending on the W0 mass hypothesis [6];
in the WED model with eκ = 0.1, the bulk graviton signal width is predicted to range from
3.6 to 54 GeV [13]. Since the resonance width is small in comparison with the experimental resolution, for simplicity, the width is taken to be 1 MeV in the simulation. In the case of the
spin-1 W0, the resonance is forced to decay into one Z and one W boson; additionally, the Z
boson is then forced to decay to a pair of electrons, muons, or tau leptons, while the W boson is forced to decay into a pair of quarks. The generated spin-2 bulk graviton is instead forced to decay into two Z bosons, one decaying leptonically into any pair of charged leptons, and the other Z boson decaying hadronically into a pair of quarks.
Several SM processes yielding final states with charged leptons and jets are sources of back-ground events for the analysis, and corresponding Monte Carlo (MC) simulated samples have been generated and used in the analysis.
The SM production of a Z boson in association with quarks or gluons in the final state (Z+jets)
represents the dominant background process for the analysis, having topological similarities to the signal because of the presence of a pair of charged leptons and jets. However, since the quark- and gluon-induced jets are not associated with the decay of a vector boson, the jet mass
spectrum is characterized by a smooth distribution and the distribution of the 2` +jet system
invariant mass falls exponentially, in contrast with the peaking distribution expected from the
signal in both the jet and 2` +jet mass spectra. The Z+jets MC samples are produced with
MADGRAPH5 aMC@NLOat next-to-leading order (NLO), using the FxFx merging scheme [14]
between the jets from matrix element calculations and parton showers, and normalized to the
next-to-NLO cross section computed usingFEWZv3.1 [15].
Another important source of SM background arises from processes leading to top quark pro-duction. Simulated samples describing the production of top quark pairs are generated with
MADGRAPH5 aMC@NLOat LO, with the MLM matching scheme [16]. Single top quark
pro-duction is also considered; s- and t-channel single top quark samples are produced in the
four-flavor scheme using MADGRAPH5 aMC@NLOandPOWHEGv2 [17–20], respectively, while tW
production is simulated at NLO with POWHEGin the five-flavor scheme [21]. Additional top
quark background processes, such as the associated production of a Z or W boson with pair-produced top quarks, and the production of tqZ, are also considered in the analysis and
pro-duced at NLO with MADGRAPH5 aMC@NLO.
3
the jet mass spectrum will contain a peak from the hadronic decay of W and Z bosons, like the expected jet mass spectrum for the signal; however, this process produces a smoothly falling
2` +jet invariant mass distribution. The SM production of pairs of vector bosons (WW, WZ,
and ZZ) is simulated at NLO with MADGRAPH5 aMC@NLO.
For all the simulated samples used in the analysis, the simulation of parton showering and
hadronization is described by interfacing the event generators withPYTHIA8.212 [22] with the
CUETP8M1 [23] tune, while the parton distribution functions (PDFs) of the colliding protons are given by the NNPDF 3.0 [24] PDF set. Additional pp interactions occurring in the same or nearby bunch crossings (pileup) are added to the event simulation, with a frequency distribu-tion adjusted to match that observed in data. All samples are processed through a simuladistribu-tion
of the CMS detector using GEANT4 [25], and reconstructed using the same algorithms as those
for the data collected.
3
The CMS detector
The central feature of the CMS apparatus is a superconducting solenoid of 6 m internal diam-eter, providing a magnetic field of 3.8 T. Within the solenoid volume are a silicon pixel and strip tracker, a lead tungstate crystal electromagnetic calorimeter (ECAL), and a brass and scin-tillator hadron calorimeter (HCAL), each composed of a barrel and two endcap sections. The
silicon tracker covers the pseudorapidity range|η| <2.5, while the ECAL and HCAL cover the
range|η| < 3.0. Forward calorimeters extend the coverage provided by the barrel and endcap
detectors to|η| < 5.2. Muons are detected in gas-ionization chambers embedded in the steel
flux-return yoke outside the solenoid, with detection planes made using three technologies: drift tubes, cathode strip chambers, and resistive-plate chambers.
A more detailed description of the CMS detector, together with a definition of the coordinate system used and the relevant kinematic variables, can be found in Ref. [26].
4
Event reconstruction
The event reconstruction is performed globally using a particle-flow (PF) algorithm [27], which reconstructs and identifies each individual particle with an optimized combination of informa-tion from the various elements of the CMS detector.
The reconstructed vertex with the largest value of summed physics-object p2Tis taken to be the
primary pp interaction vertex. The physics objects chosen are those that have been defined using information from the tracking detector. These objects include jets, the associated missing transverse momentum, which was taken as the negative vector sum of the transverse
momen-tum (pT) of those jets, and charged leptons.
In the silicon tracker, isolated charged particles with pT = 100 GeV and |η| < 1.4 have track
resolutions of 2.8% in pT and 10 (30) µm in the transverse (longitudinal) impact parameter
[28]. The energy of charged hadrons is determined from a combination of their momenta measured in the tracker and the matching ECAL and HCAL energy deposits, corrected for zero-suppression effects and for the response function of the calorimeters to hadronic showers. The energy of neutral hadrons is obtained from the corresponding corrected ECAL and HCAL energies.
Electrons are required to be within the range|η| < 2.5 covered by the silicon tracker, and are
the track reconstructed from the measurements determined by the inner tracker, and the energy sum of all photons spatially compatible with being bremsstrahlung from the electron track. The identification of electrons is based on selection criteria relying on the direction and momentum of the track in the inner tracker, its compatibility with the primary vertex of the event [27], and on observables sensitive to the shape of energy deposits along the electron trajectory. The
momentum resolution for electrons with pT ≈ 45 GeV from Z → ee decays ranges from 1.7%
to 4.5% [29]. It is generally better in the barrel region than in the endcaps, and also depends on the amount of bremsstrahlung emitted by the electron as it traverses the material in front of the ECAL.
Muons are reconstructed in the entire CMS muon system acceptance region of |η| < 2.4 by
combining in a global fit the information provided by the measurements in the silicon tracker and the muon spectrometer. Candidate muons are selected using criteria based on the degree of compatibility of the inner track, which is reconstructed using the silicon tracker only, and the track reconstructed using the combination of the hits in both the tracker and spectrometer. Fur-ther reconstruction requirements include the compatibility of the trajectory with the primary vertex of the event, and the number of hits observed in the tracker and muon systems. The
relative pT resolution achieved is 1.3–2.0% for muons with 20 < pT < 100 GeV in the barrel
and better than 6% in the endcaps. The pTresolution in the barrel is better than 10% for muons
with pTup to 1 TeV [30].
Both electrons and muons are required to be isolated from hadronic activity and other leptons
in the event. An isolation variable is defined as the scalar sum of the pT of charged hadrons
originating from the primary vertex, plus the scalar sums of the transverse momenta for
neu-tral hadrons and photons, in a cone of∆R=
√
(∆η)2+ (∆φ)2 < 0.3(0.4)around the electron
(muon) direction corrected to account for the contribution from neutral candidates originat-ing from pileup, where φ is the azimuthal angle in radians. In the high-mass analysis, a spe-cific muon isolation requirement is implemented to retain signal efficiency for high resonance masses, where the large Z boson boost may result in extremely close pairs of muons. For this reason, muon candidates in the high-mass analysis are retained if they pass an isolation
re-quirement based on the sum of reconstructed pT of all tracks within∆R < 0.3 from the muon
trajectory, ignoring tracks associated with other reconstructed muons.
Hadron jets are clustered from particles reconstructed by the PF algorithm using the
infrared-and collinear-safe anti-kTalgorithm [31, 32] with distance parameters of 0.4 (AK4 jets) and 0.8
(AK8 jets). The jet momentum is determined as the vectorial sum of all constituent particle momenta. Contamination from pileup is suppressed using charged hadron subtraction (CHS) which removes from the list of PF candidates all charged particles originating from vertices other than the primary interaction vertex of the event. The residual contribution from neutral and charged particles originating from pileup vertices is removed by means of an event-by-event jet-area-based correction to the jet four-momentum. Identification requirements, based on the estimation of the energy fraction carried by the different types of PF candidates clustered into a jet, along with the multiplicity of the PF candidates, are used to remove jets originating from calorimetric noise. Corrections to the jet energy are derived from the simulation, and are
confirmed with in situ measurements with the energy balance of dijet, multijet, photon+jet,
and leptonically decaying Z+jet events [33].
A jet grooming technique is used for AK8 jets in this analysis to help identify and discriminate between jets from boosted hadronic V decays, which we refer to as “merged jets”, and jets from quarks and gluons. The AK8 jets are groomed by means of the modified mass drop tagger
5
threshold zcut < 0.1, and characteristic radius R0 =0.8 [35]. The soft drop algorithm does not
fully reject contributions from the underlying event and pileup. The mass of the AK8 jet (mj) is
therefore defined as the invariant mass associated to the four-momentum of the soft drop jet, after the application of the pileup mitigation corrections provided by the pileup per particle identification (PUPPI) algorithm [36].
Discrimination between AK8 jets originating from vector boson decays and those originating from gluons and quarks is also achieved by the N-subjettiness jet substructure variable [37]. This observable exploits the distribution of the jet constituents found in the proximity of the subjet axes to determine if the jet can be effectively subdivided into a number N of subjets. The
generic N-subjettiness variable τN is defined as the pT-weighted sum of the angular distance of
all the k jet constituents from the closest subjet:
τN =
1
d0
∑
kpT,kmin(∆R1,k,∆R2,k, . . . ,∆RN,k). (1)
The normalization factor d0is defined as d0 = ∑kpT,kR0, with R0 the clustering parameter of
the original jet. In this analysis, which aims to select V → qq(0)decays, the variable that best
discriminates V boson jets from those from quarks and gluons is the ratio of the 2-subjettiness to
the 1-subjettiness: τ21 =τ2/τ1. The τ21observable is calculated for the jet before the grooming
procedure, and includes the PUPPI algorithm corrections for pileup mitigation.
For the identification of jets originating from the hadronization of bottom quarks, the combined secondary vertex (CSVv2) algorithm [38, 39] is used, either directly on the AK4 jets or on the AK8 soft drop subjets with CHS pileup mitigation applied.
Only AK4 and AK8 jets reconstructed centrally in the detector acceptance, within|η| <2.4, are
considered in the analysis.
5
Event selection
Events are selected online by requiring the reconstruction at trigger [40] level of at least one
charged lepton. For the high-mass analysis, pT thresholds of 115 (50) GeV are used for
elec-trons (muons). No isolation requirements are applied at trigger level, to retain efficiency for high-mass signals, where the large boost expected for the leptonically decaying Z boson will cause the two charged leptons to be collimated in the detector. For the low-mass analysis a
larger separation between the leptons is expected because of the lower pT of the Z boson, and
isolation requirements are included in the trigger selection, allowing the use of lower lepton
pT thresholds. The online selection for the low-mass analysis requires at least one electron
with pT > 25 GeV and|η| < 2.1 passing tight identification and isolation requirements, or at
least one muon with pT > 24 GeV and |η| < 2.4, subject to loose identification and isolation
requirements, using the variables described in Ref. [40].
To reconstruct the Z boson candidate, at least two well-identified leptons with opposite charge and the same flavor are required to be present in the event. The leading lepton in the event is required to pass more stringent selection requirements than the online thresholds to avoid inef-ficiencies induced by the trigger selections. In the high-mass analysis, the leading (subleading)
lepton is required to have pT > 135(35)GeV for electrons, and pT > 55(20)GeV for muons.
Loose isolation and identification requirements are applied to the leptons to retain high sig-nal efficiency. For electrons, we use a set of requirements that have been observed to have an efficiency of about 90% for both low and high mass points. For muons, as the CMS standard
requirements [41] only have an efficiency of about 65% for close muons, we instead use a dedi-cated selection where one of the two muons is allowed to be identified only in the tracker. The isolation variable is calculated removing the contribution of the other muon if it falls within the isolation cone, therefore recovering a signal efficiency of about 90% for high mass resonances.
For the low-mass analysis, the leading (subleading) lepton is required to have pT larger than
40(30)GeV and to fall in the range|η| <2.1(2.4).
The selection of the Z boson candidate relies on the invariant mass of the dilepton pair, m``.
This is required to satisfy 70<m``<110 GeV, except for the low-mass analysis in the resolved
category (discussed below) where the requirement is 76 < m`` < 106 GeV to enhance the
sensitivity to the signal by reducing the nonresonant contribution in the sample with b tagged jets.
Different strategies are used in the low- and high-mass analyses to identify and reconstruct the hadronically decaying V boson, as described below, to cope with the different V boson boost regimes expected for low- and high-mass signal candidates.
In the high-mass analysis a merged jet is required in the event, and its mass mjis used to select
the hadronically decaying W or Z. The signal is expected to be almost fully contained in the
mass range 65<mj <105 GeV, which is thus defined as the signal region (SR). In order to select
candidate signal events, where a heavy massive particle decays into a pair of boosted vector
bosons, both the dilepton pair and the leading jet selected in an event are required to have pT >
200 GeV; this is motivated by the pT spectrum of the V bosons observed in simulation. Events
are divided into categories depending on the flavor of the charged leptons (e or µ) and the value
of the jet τ21variable. As the signal is expected to have lower values of τ21, two different purity
categories are defined: events with τ21 < 0.35 are defined as the high-purity (HP) category,
while events with 0.35 < τ21 < 0.75 fall into a low-purity (LP) category, used to retain some
sensitivity to signal although a larger amount of background is expected with respect to the
HP category. The τ21 > 0.75 region is expected to be dominated by the background, and is
therefore not used in the high-mass analysis. In total, four exclusive categories (from the two purity and two lepton flavor categories) are defined for the high-mass analysis.
In the low-mass analysis, events are divided into two categories depending on whether the two quarks from the hadronic V decay merge into a single reconstructed jet or can be resolved
as two distinct jets. In the merged category, merged jets with pT > 200 GeV and τ21 < 0.40
are selected. The choice of a looser τ21 selection with respect to the cutoff applied in the HP
category of the high-mass analysis is driven by the higher expected signal efficiency for merged
events, which are selected in the low-mass analysis using only one τ21 category. As in the
high-mass analysis, the jet mass is required to be in the range 65 < mj < 105 GeV for the jet
to be considered a candidate W or Z boson, which is also defined as the SR for the merged low-mass analysis. The resolved category contains events that do not contain a merged V
candidate, but instead two AK4 jets, both with pT > 30 GeV that form a dijet candidate with
invariant mass mjj > 30 GeV and pT > 100 GeV. In both the merged and resolved cases, the
pT selection is determined by comparing the pTspectrum of simulated signal events with the
expected background. Both the merged and resolved categories are further split into two b tag categories. Events in the merged tagged category are required to have at least one subjet
satisfying a b tagging requirement corresponding to≈65% efficiency for b quark identification
and ≈1% light-flavor jet mistag rate; events not passing this requirement are placed in the
merged untagged category. For the resolved tagged category, events are required to have at least one jet satisfying the same b tagging requirement used in the merged category; a looser b
7
mistag rate. Events failing these requirements fall in the so-called resolved untagged category. An arbitration procedure is used to select the dijet candidate in case of events containing more than two selected narrow jets: first, if a dijet passing the b tagging requirements is selected in the event, the candidate in the b tag category is chosen; then the dijet candidate closest in mass to the Z boson mass is selected as the candidate V boson. The signal region for the low-mass
resolved category accepts events in the dijet mass range 65 < mjj < 110 GeV. Eight categories
are defined in the low-mass analysis, based on the lepton flavor, the b-tag category, and the merged or resolved reconstruction of the hadronically decaying V candidate.
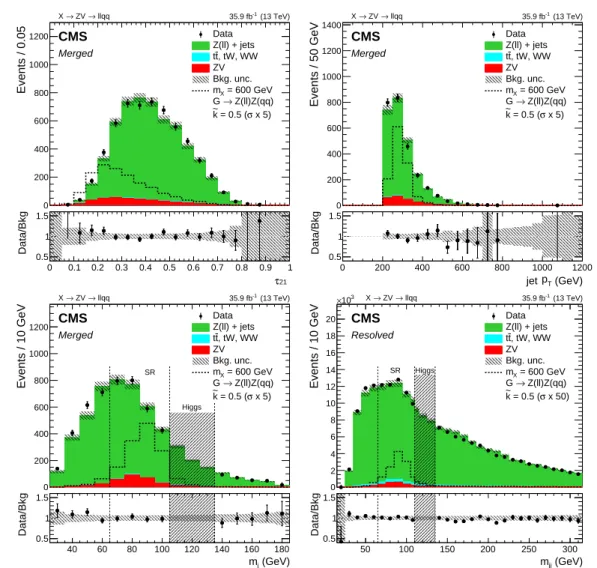
The τ21and merged jet pTdistributions of the V candidate for events selected in the merged
cat-egory of the low-mass analysis are shown in Fig. 1, where the mjand mjjdistributions for events
with a V candidate are also shown for the merged and resolved low-mass analysis categories, respectively.
6
Background estimation
6.1 High-mass analysis
The main source of background events in the final state of the analysis arises from the pro-duction of a leptonically decaying Z boson in association with quark and gluon jets. A second background source relevant for the analysis is SM diboson production, mainly ZZ and ZW, with a leptonically decaying Z boson together with a W or Z boson decaying hadronically. These diboson events are an irreducible background for the analysis, as the mass distribution of the SM V jet peaks in the same region as the signal. Finally, top quark production is con-sidered as a source of background in the analysis, despite having a much smaller contribution with respect to other SM backgrounds in the region probed by this analysis, mostly because of the Z boson invariant mass selection and the large boost required in the event.
All SM background processes are characterized by a smoothly falling distribution of the
invari-ant mass of the dilepton pair and the jet selected (mVZ), whereas the signal is instead expected
to appear as a narrow peak at a value of mVZclose to the actual value of the mass of the
reso-nance mX.
To minimize the dependency on the accuracy of the simulation, the contribution of the
domi-nant background, Z+jets SM production, is estimated using data. Two signal-depleted regions
are defined by selecting events with jet mass outside the mjsignal mass window defined in
Sec-tion 5; these are the sideband (SB) regions. A lower sideband (LSB) region is defined for events
with 30 < mj < 65 GeV, close to the SR of the analysis, while a higher sideband (HSB) region
contains events with 135 < mj < 300 GeV. The region 105 < mj < 135 GeV is not used in
the analysis, to exclude events containing the hadronic decays of a SM Higgs boson, which are targeted in other CMS analyses, such as that described in [42].
The Z+jets background mVZshape and normalization are obtained by extrapolation from fits
to data in the SB regions.
The mj distribution for the SM background sources considered in the analysis is modeled by
means of analytic functions describing the spectrum of each background in the mass region
30 < mj < 300 GeV. In the LP category, the mj spectrum in Z+jets events is described by a
smoothly falling exponential distribution, while a broad structure centered around the mass of the W boson present in the HP category is modeled with an error function convolved with an exponential distribution, which is of particular importance for describing the behavior at large
0 0.1 0.2 0.3 0.4 0.5 0.6 0.7 0.8 0.9 1 Events / 0.05 0 200 400 600 800 1000 1200 Data Z(ll) + jets , tW, WW t t ZV Bkg. unc. = 600 GeV X m Z(ll)Z(qq) → G x 5) σ = 0.5 ( k ~ (13 TeV) -1 35.9 fb CMS Merged llqq → ZV → X 21 τ 0 0.1 0.2 0.3 0.4 0.5 0.6 0.7 0.8 0.9 1 Data/Bkg 0.5 1 1.5 0 200 400 600 800 1000 1200 Events / 50 GeV 0 200 400 600 800 1000 1200 1400 Data Z(ll) + jets , tW, WW t t ZV Bkg. unc. = 600 GeV X m Z(ll)Z(qq) → G x 5) σ = 0.5 ( k ~ (13 TeV) -1 35.9 fb CMS Merged llqq → ZV → X (GeV) T p jet 0 200 400 600 800 1000 1200 Data/Bkg 0.5 1 1.5 40 60 80 100 120 140 160 180 Events / 10 GeV 0 200 400 600 800 1000 1200 Higgs SR Data Z(ll) + jets , tW, WW t t ZV Bkg. unc. = 600 GeV X m Z(ll)Z(qq) → G x 5) σ = 0.5 ( k ~ (13 TeV) -1 35.9 fb CMS Merged llqq → ZV → X (GeV) j m 40 60 80 100 120 140 160 180 Data/Bkg 0.5 1 1.5 50 100 150 200 250 300 Events / 10 GeV 0 2 4 6 8 10 12 14 16 18 20 3 10 × Higgs SR Data Z(ll) + jets , tW, WW t t ZV Bkg. unc. = 600 GeV X m Z(ll)Z(qq) → G x 50) σ = 0.5 ( k ~ (13 TeV) -1 35.9 fb CMS Resolved llqq → ZV → X (GeV) jj m 50 100 150 200 250 300 Data/Bkg0.5 1 1.5
Figure 1: Upper row: distribution of the merged V candidate τ21 (left), where the τ21 < 0.4
requirement has been removed, and the jet pT (right) in data and simulation for events in the
signal region of the low-mass analysis. Lower row: V candidate mj(left) and mjj(right) in data
and simulation for events in the signal regions of the low-mass search. The points show the data while the filled histograms show the background contributions. The gray band shows the statistical and systematic uncertainties in the background, while the dashed vertical region (“Higgs”) shows the expected SM Higgs boson mass range, which is excluded from this analy-sis. A 600 GeV bulk graviton signal prediction is represented by the black dashed histogram; for visibility, the signal cross-section is increased by a factor of 5 in the merged category and 50 in
the resolved category. With the exception of the jet pT, which typically peaks at approximately
half of the resonance mass, the quantities shown have minimal dependence on the mass of the
resonance. The background normalization is derived from the final fit to the mVZobservable in
data.
of a jet from a genuine W or Z boson in the event, is described in both the LP and HP categories with a Gaussian distribution. The remaining component of the distribution, consisting of tails extending far from the SR, is modeled in the LP category with an exponential function, similarly
to the Z+jets case. In the HP category, the VV events are mostly contained in the SR, and
the small fraction of events present in the Higgs boson and LSB regions is described with an additional broad Gaussian contribution. The top quark background (tt, single top quark, tZq,
6.1 High-mass analysis 9
addition to the exponentially falling component, a Gaussian is included to model the top quark
peak appearing in the HSB for mj ≈170 GeV.
The expected yield of the Z+jets background in the SR is extracted by a fit of the mjdistribution
in the SBs taking into account all background contributions. The parameters describing the mj
shape and normalization of the subdominant background processes are fixed to those extracted
from the simulation. All the parameters used to describe the Z+jets contribution are left free to
float in the fit to the data SBs. Alternative functions modeling the mjshape of the main Z+jets
background are used to evaluate the impact of the function choice on the signal normalization.
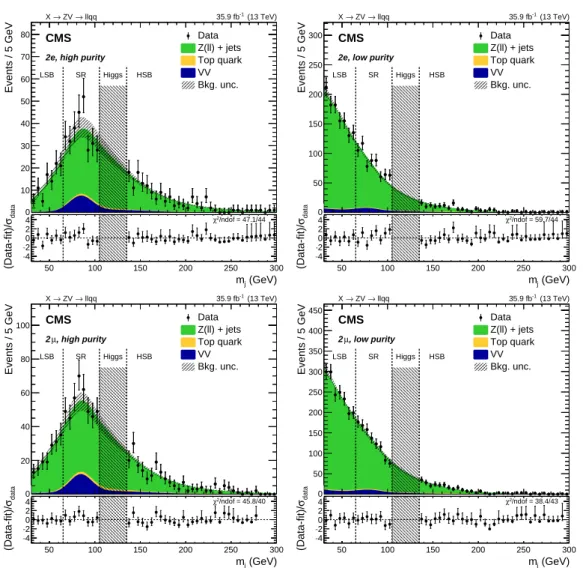
The mjdistribution for expected and observed events is shown in Fig. 2.
(GeV) j m Events / 5 GeV 0 10 20 30 40 50 60 70 80 (13 TeV) -1 35.9 fb CMS llqq → ZV → X
2e, high purity LSB SR Higgs HSB Data Z(ll) + jets Top quark VV Bkg. unc. (GeV) j m 50 100 150 200 250 300 data σ (Data-fit)/ 4 −2 −0 2 4 χ2/ndof = 47.1/44 data σ (Data-fit)/ 0 (GeV) j m Events / 5 GeV 0 50 100 150 200 250 300 (13 TeV) -1 35.9 fb CMS llqq → ZV → X
2e, low purity
LSB SR Higgs HSB Data Z(ll) + jets Top quark VV Bkg. unc. (GeV) j m 50 100 150 200 250 300 data σ (Data-fit)/ 4 −2 −0 2 4 χ2/ndof = 59.7/44 data σ (Data-fit)/ 0 (GeV) j m Events / 5 GeV 0 20 40 60 80 100 (13 TeV) -1 35.9 fb CMS llqq → ZV → X , high purity µ 2 LSB SR Higgs HSB Data Z(ll) + jets Top quark VV Bkg. unc. (GeV) j m 50 100 150 200 250 300 data σ (Data-fit)/ 4 −2 −0 2 4 χ2/ndof = 45.8/40 data σ (Data-fit)/ 0 (GeV) j m Events / 5 GeV 0 50 100 150 200 250 300 350 400 450 (13 TeV) -1 35.9 fb CMS llqq → ZV → X , low purity µ 2 LSB SR Higgs HSB Data Z(ll) + jets Top quark VV Bkg. unc. (GeV) j m 50 100 150 200 250 300 data σ (Data-fit)/ 4 −2 −0 2 4 χ2/ndof = 38.4/43 data σ (Data-fit)/ 0
Figure 2: The mj distributions of the events in data, compared to the expected background
shape, for the high-mass analysis in the electron (upper) and muon (lower) channels, and for the high-purity (left) and low-purity (right) categories. The expected background shape is
ex-tracted from a fit to the data sidebands (Z+jets) or derived from simulation (“top quark”
and “VV”). The dashed region around the background sum represents the uncertainty in the
Z+jets distribution, while the dashed vertical region (“Higgs”) shows the expected SM Higgs
boson mass range, excluded from the analysis. The bottom panels show the pull distribution
between data and SM background expectation from the fit, where σdata is the Poisson
uncer-tainty in the data.
transfer function is defined from simulation:
α(mVZ) =
fSRMC,Z+jets(mVZ) fSBMC,Z+jets(mVZ)
, (2)
where fSRMC,Z+jets(mVZ)and fSBMC,Z+jets(mVZ)are the probability density functions describing the
mVZspectrum in the SR and SBs, respectively, of the simulated Z+jets sample.
The shape of the Z+jets background in the SR is then extracted from a simultaneous fit to data
in the SBs, and to simulation in both the SR and SBs, to correct the functional form obtained
from data using the α(mVZ) ratio. The mVZ shape is described by two-parameter
exponen-tial functions for both data and simulation. The final estimate of the background mVZ shape
predicted in the SR is then given by the following relation:
NSRpred(mVZ) =NZ +jets SR f obs,Z+jets SB (mVZ)α(mVZ) +N MC,t SR f MC,t SR (mVZ) +N MC,VV SR f MC,VV SR (mVZ), (3)
where NSRpred(mVZ)is the predicted background in the SR and fobs,Z
+jets
SB (mVZ)is the probability
distribution function describing the Z+jets background in the SBs. This is obtained from a fit
of the overall background components to data in the SBs, after subtracting the subdominant
top quark and VV components, which are derived from simulation. The functions fSRMC,t(mVZ)
and fSRMC,VV(mVZ)are the probability distributions of the top quark and diboson components,
respectively, also in this case fixed to the shapes derived from the simulated samples in the SR.
The normalization of the Z+jets background in the SR, NSRZ+jets, is provided by the result of the
fit on the mjdata sidebands described above, while the normalization of the top quark and VV
backgrounds, NSRMC,tand NSRMC,VV, are fixed to the expected yields from simulation.
The α(mVZ)function accounts for differences and correlations in the transfer process from the
SB regions to the SR, and is largely unaffected by uncertainties in the overall Z+jets cross
section and distribution shapes.
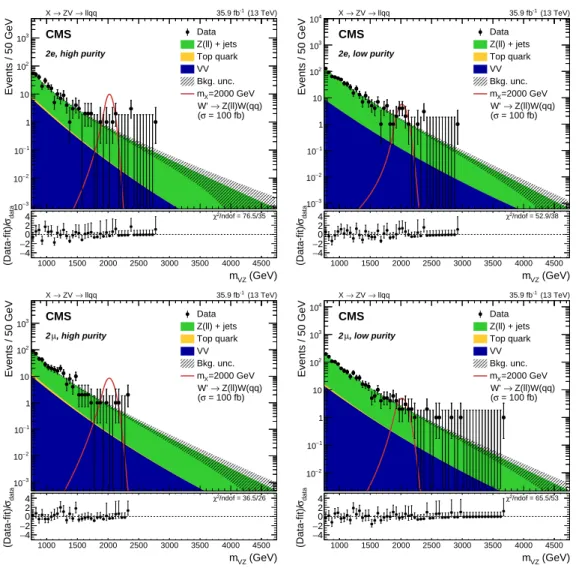
The final mVZspectra in the SR are shown in Fig. 3, compared to the expected estimated
back-ground.
The validity and robustness of the background estimation method is demonstrated by the agreement observed between the shape and normalization for events selected in an
intermedi-ate mj mass region (50 < mj < 65 GeV), corresponding to the part of the LSB shown in Fig. 2
above 50 GeV, and the prediction made using the events in the remaining part of the LSB and the full HSB regions.
The description of the signal mVZ shape is extracted from simulated signal samples. Several
signal samples generated with resonance mass ranging from 400 to 4500 GeV in the narrow width approximation are modeled independently for each channel with a Crystal Ball (CB) function [43]. The power-law component of the CB function improves the description of the
mVZsignal distribution by accounting for the small contribution from lower mVZtails
appear-ing for high signal masses. The resolution of the reconstructed mVZcan be extracted from the
Gaussian core width of the CB function, and is estimated to be 2–3.5% in the electron channel and 3–4% in the muon channel, depending on the mass of the resonance.
6.2 Low-mass analysis
For the low-mass analysis, the Z+jets background is characterized using simulated Drell–Yan+
jets events. Because of the limited number of simulated events, the mVZdistributions in the
6.2 Low-mass analysis 11 Events / 50 GeV 3 − 10 2 − 10 1 − 10 1 10 2 10 3 10 (13 TeV) -1 35.9 fb CMS llqq → ZV → X
2e, high purity
Data Z(ll) + jets Top quark VV Bkg. unc. =2000 GeV X m Z(ll)W(qq) → W' = 100 fb) σ ( (GeV) VZ m 1000 1500 2000 2500 3000 3500 4000 4500 data σ (Data-fit)/ −4 2 −0 2 4 χ2/ndof = 76.5/35 data σ (Data-fit)/ Events / 50 GeV 3 − 10 2 − 10 1 − 10 1 10 2 10 3 10 4 10 (13 TeV) -1 35.9 fb CMS llqq → ZV → X
2e, low purity
Data Z(ll) + jets Top quark VV Bkg. unc. =2000 GeV X m Z(ll)W(qq) → W' = 100 fb) σ ( (GeV) VZ m 1000 1500 2000 2500 3000 3500 4000 4500 data σ (Data-fit)/ −4 2 −0 2 4 χ2/ndof = 52.9/38 data σ (Data-fit)/ Events / 50 GeV 3 − 10 2 − 10 1 − 10 1 10 2 10 3 10 (13 TeV) -1 35.9 fb CMS llqq → ZV → X , high purity µ 2 Data Z(ll) + jets Top quark VV Bkg. unc. =2000 GeV X m Z(ll)W(qq) → W' = 100 fb) σ ( (GeV) VZ m 1000 1500 2000 2500 3000 3500 4000 4500 data σ (Data-fit)/ −4 2 −0 2 4 χ2/ndof = 36.5/26 data σ (Data-fit)/ Events / 50 GeV 2 − 10 1 − 10 1 10 2 10 3 10 4 10 (13 TeV) -1 35.9 fb CMS llqq → ZV → X , low purity µ 2 Data Z(ll) + jets Top quark VV Bkg. unc. =2000 GeV X m Z(ll)W(qq) → W' = 100 fb) σ ( (GeV) VZ m 1000 1500 2000 2500 3000 3500 4000 4500 data σ (Data-fit)/ −4 2 −0 2 4 χ2/ndof = 65.5/53 data σ (Data-fit)/
Figure 3: Expected and observed distributions of the resonance candidate mass mVZ in the
high-mass analysis, in the electron (upper) and muon (lower) channels, and separately for the high-purity (left) and low-purity (right) categories. The shaded area represents the post-fit un-certainty in the background. The bottom panels show the pull distribution between data and
post-fit SM background fit, where σdatais the Poisson uncertainty in the data. The expected
con-tribution from W0 signal candidates with mass mX = 2000 GeV, normalized to a cross section
the background modeling. It has been observed, however, that within simulation
uncertain-ties, the Z+jets mass shape is the same for events with and without b-tagged jets. Therefore,
the Z+jets shape in the b-tagged category is described using the mVZshape obtained from the
simulation without making any b tag requirements.
Sideband regions are defined depending on the mass of the hadronic V boson candidate. The
mass ranges 30 < mj < 65 GeV and 135 < mj < 180 GeV are used for the merged category,
whereas for the resolved event selection the upper mass threshold is raised to 300 GeV to take advantage of the increased number of events in that region.
In the final fit to the data, the Z+jets background normalization in the SR is constrained by the
observed yield in the SBs; this procedure is applied independently to each category. The shape
predictions from the NLO Z+jets simulation are taken as a baseline mVZshape in the SR of
every category; additionally, a family of linear correction functions:
Corr(mX, s) =1+s(mX−500 GeV)/(500 GeV), (4)
with individual members of the family defined by the slope parameter s, is considered. Figure 4
shows fits to the SB mVZ distributions where the slope parameter s, allowed to float freely,
is constrained by the observed shapes in data. The two-standard-deviation uncertainties in
the fitted linear correction functions, which are in the range from 2×10⁻⁴ to 6×10⁻⁴GeV−1,
depending on the category, are observed to cover the residual shape differences in the SBs. In the signal region fit of each category, the SB-constrained slope parameter s is treated as a
Z+jets shape systematic effect. In this way the background shape can be corrected to that
observed in data. Statistical uncertainties associated with the simulated Z+jets distributions
are also taken into account in the fit. The fits in the merged V categories include the peaking region of the background; Fig. 4 shows that the SB data in this particular region are described well by the fit.
Dilepton backgrounds that do not contain a leptonic Z boson decay are estimated from data using eµ events passing the analysis selection. This approach accounts for tt production,
WW+jets, Z → ττ+jets, single top quark, and hadrons misidentified as leptons, which we
collectively refer to as t+X. The relative yield of ee and µµ events with respect to eµ events
has been estimated on a top quark–enriched control sample and shown to be consistent with
expectations. Also, the eµ mVZdistribution was compared with the prediction from simulated
background events with symmetric lepton flavor, and found to be in agreement. The
contribu-tion of this t+X background is 2% and 20% of the total background in the untagged and tagged
categories of the resolved analysis, respectively. The merged analysis has a t+X contribution
of 0.5% and 1% in the untagged and tagged categories, respectively.
The diboson background (ZZ and ZW, with Z→ ``) is estimated directly from simulation. The
contribution from these events represents 4% and 5% of the total background in the untagged and tagged categories of the resolved analysis, respectively, while in the merged analysis it is about 14% and 16% in the untagged and tagged categories, respectively.
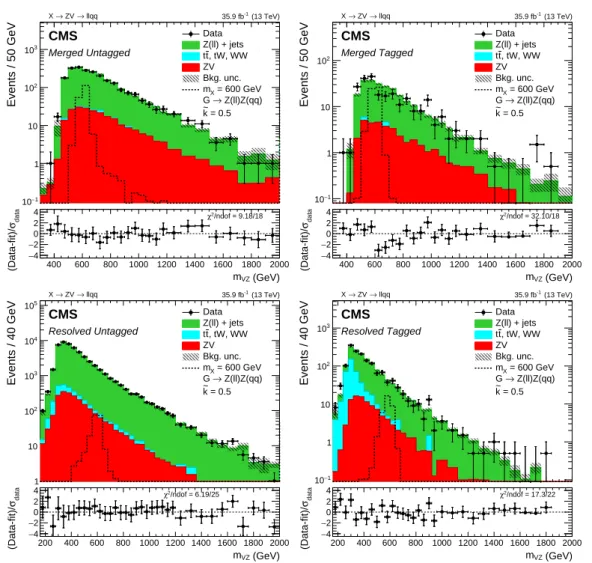
The mVZdistributions for the signal region for the merged and resolved categories are depicted
in Fig. 5.
7
Systematic uncertainties
Several sources of systematic uncertainties influence both the normalization and shape of the backgrounds and signal distributions in the analysis.
13 400 600 800 1000 1200 1400 1600 1800 2000 Events / 100 GeV 0 100 200 300 400 500 600 700 800 Data Z(ll) + jets , tW, WW t t ZV Bkg. unc. (13 TeV) -1 35.9 fb CMS Merged Untagged llqq → ZV → X (GeV) VZ m 400 600 800 1000 1200 1400 1600 1800 2000 data σ (Data-fit)/ 4 − 2 − 0 2 4 χ2/ndof = 3.26/8 400 600 800 1000 1200 1400 1600 1800 2000 Events / 100 GeV 0 10 20 30 40 50 60 Data Z(ll) + jets , tW, WW t t ZV Bkg. unc. (13 TeV) -1 35.9 fb CMS Merged Tagged llqq → ZV → X (GeV) VZ m 400 600 800 1000 1200 1400 1600 1800 2000 data σ (Data-fit)/ 4 − 2 − 0 2 4 χ2/ndof = 11.67/8 200 400 600 800 1000 1200 1400 1600 1800 2000 Events / 40 GeV 0 2 4 6 8 10 12 14 16 18 3 10 × Data Z(ll) + jets , tW, WW t t ZV Bkg. unc. (13 TeV) -1 35.9 fb CMS Resolved Untagged llqq → ZV → X (GeV) VZ m 200 400 600 800 1000 1200 1400 1600 1800 2000 data σ (Data-fit)/ 4 − 2 −0 2 4 χ2/ndof = 3.33/24 200 400 600 800 1000 1200 1400 1600 1800 2000 Events / 80 GeV 0 200 400 600 800 1000 Data Z(ll) + jets , tW, WW t t ZV Bkg. unc. (13 TeV) -1 35.9 fb CMS Resolved Tagged llqq → ZV → X (GeV) VZ m 200 400 600 800 1000 1200 1400 1600 1800 2000 data σ (Data-fit)/ 4 − 2 −0 2 4 χ2/ndof = 13.62/12
Figure 4: Sideband mVZ distributions for the low-mass search in the merged V (upper),
re-solved V (lower), untagged (left), and tagged (right) categories, after fitting the sideband data alone. The points show the data while the filled histograms show the background contribu-tions. Electron and muon categories are combined. The gray band indicates the statistical and post-fit systematic uncertainties in the normalization and shape of the background. Larger bin
widths are used at higher values of mVZ; the bin widths are indicated by the horizontal error
bars.
In the high-mass analysis, where the Z+jets background component is estimated with data, the
main systematic uncertainties in the predicted normalization for the Z+jets background arise
from the statistical uncertainties in the fit of the mjsidebands in data. Another uncertainty
af-fecting the normalization of the main background is evaluated by taking the difference between
the expected Z+jets contribution in the SR obtained by the main function used to describe the
mj spectrum, and an alternative function choice. An additional normalization uncertainty is
related to the choice of the function used to describe the mjspectrum for the subdominant top
quark and VV backgrounds, evaluated from simulation, and propagated to the Z+jets
normal-ization prediction in the SR. Overall, the Z+jets normalization uncertainties contribute from
9 to 15%, depending on the category. The main shape uncertainties in the Z+jets background
are extracted from the covariance matrix of the fit to the mVZdata SB spectrum, convolved with
the uncertainties provided by the α(mVZ)ratio, via the simultaneous fit procedure described in
400 600 800 1000 1200 1400 1600 1800 2000 Events / 50 GeV 1 − 10 1 10 2 10 3 10 Data Z(ll) + jets , tW, WW t t ZV Bkg. unc. = 600 GeV X m Z(ll)Z(qq) → G = 0.5 k ~ (13 TeV) -1 35.9 fb CMS Merged Untagged llqq → ZV → X (GeV) VZ m 400 600 800 1000 1200 1400 1600 1800 2000 data σ (Data-fit)/ 4 − 2 − 0 2 4 χ2/ndof = 9.18/18 400 600 800 1000 1200 1400 1600 1800 2000 Events / 50 GeV 1 − 10 1 10 2 10 Data Z(ll) + jets , tW, WW t t ZV Bkg. unc. = 600 GeV X m Z(ll)Z(qq) → G = 0.5 k ~ (13 TeV) -1 35.9 fb CMS Merged Tagged llqq → ZV → X (GeV) VZ m 400 600 800 1000 1200 1400 1600 1800 2000 data σ (Data-fit)/ 4 − 2 − 0 2 4 χ2/ndof = 32.10/18 200 400 600 800 1000 1200 1400 1600 1800 2000 Events / 40 GeV 1 10 2 10 3 10 4 10 5 10 Data Z(ll) + jets , tW, WW t t ZV Bkg. unc. = 600 GeV X m Z(ll)Z(qq) → G = 0.5 k ~ (13 TeV) -1 35.9 fb CMS Resolved Untagged llqq → ZV → X (GeV) VZ m 200 400 600 800 1000 1200 1400 1600 1800 2000 data σ (Data-fit)/ 4 − 2 −0 2 4 χ2/ndof = 6.19/25 200 400 600 800 1000 1200 1400 1600 1800 2000 Events / 40 GeV 1 − 10 1 10 2 10 3 10 Data Z(ll) + jets , tW, WW t t ZV Bkg. unc. = 600 GeV X m Z(ll)Z(qq) → G = 0.5 k ~ (13 TeV) -1 35.9 fb CMS Resolved Tagged llqq → ZV → X (GeV) VZ m 200 400 600 800 1000 1200 1400 1600 1800 2000 data σ (Data-fit)/ 4 − 2 −0 2 4 χ2/ndof = 17.3/22
Figure 5: The signal region mVZdistributions for the low-mass search, in the merged V (upper),
resolved V (lower), untagged (left), and tagged (right) categories, after fitting the signal and sideband regions. Electron and muon categories are combined. A 600 GeV bulk graviton signal prediction is represented by the black dashed histogram. The gray band indicates the statistical and post-fit systematic uncertainties in the normalization and shape of the background. Larger
bin widths are used at higher values of mVZ; the bin widths are indicated by the horizontal
error bars.
In the low-mass analysis, to account for background shape systematic effects not explicitly evaluated, data and simulation are compared in the sideband region, and the residual shape difference is treated as an additional uncertainty, resulting in the dominant background shape systematic uncertainty of the low-mass analysis.
The top quark and VV background components have a systematic uncertainty in the normaliza-tion arising from the degree of knowledge of the respective process producnormaliza-tion cross secnormaliza-tions. The value of the VV production cross section, taken from a recent measurement by the CMS Collaboration [44, 45], is assigned an uncertainty of 12%. The top quark background uncer-tainties are estimated differently in the low- and high-mass analyses: in the low-mass analysis,
where a dedicated eµ control region is exploited to measure the t+X background
normaliza-tion, a 4% uncertainty is estimated by comparing the yield of eµ events with ee+µµdata; in
the high-mass analysis, where the top quark production is taken from simulation, a 5% uncer-tainty in the cross section is used, which is extracted from the recent CMS measurement of top
15
quark pair production in dilepton events [46].
Uncertainties associated with the description in simulation of the trigger efficiencies, as well as the uncertainties in the efficiency for electron and muon reconstruction, identification, and isolation, are extracted from dedicated studies of events with leptonic Z decays, and amount to 1.5–3%, depending on the lepton flavor. The uncertainties in the lepton momentum and energy scales are taken into account, and propagated to the signal shapes and normalization, with a typical impact on the normalization of about 0.5–2%, depending on the lepton flavor.
Uncertainties in the jet energy scale and resolution [47] affect both the normalization and the shape of the background and signal samples. The momenta of the reconstructed jets are varied
according to the uncertainties in the jet energy scale, and the selection efficiencies and mVZ
signal shapes are reevaluated using these modified samples, resulting in a change of 0.1 to 1.8%, depending on the jet selection. The impact of the jet energy resolution is also propagated, and a smaller impact is observed compared with that due to the uncertainty in the energy scale. The dominant uncertainty in the signal selection efficiency is the uncertainty in the V boson identification efficiency, corresponding to 11% (23%) for the HP (LP) category in the high-mass analysis, and 6% for the merged category of the low-mass analysis [48]. The V boson identifica-tion efficiency, the groomed mass resoluidentifica-tion of V jets, and the related systematic uncertainty are measured in data and simulation in an almost pure selection of semileptonic tt events where boosted W bosons produced in the top quark decays are separated from the combinatorial tt background by means of a simultaneous fit to the soft drop mass. The uncertainties in the soft drop mass scale and resolution are propagated to the groomed jet mass, and the impact on the expected selection efficiency of signal and VV background is taken into account. An additional uncertainty affecting the signal normalization is included to account for the extrapolation of
the uncertainties extracted from a tt sample at typical jet pTof 200 GeV to higher regimes,
esti-mated from the differences betweenPYTHIA 8 andHERWIG++ [49] showering models,
yield-ing an uncertainty from 2.5 to 20% dependyield-ing on the category. For the high-mass analysis, the uncertainties in the V boson identification efficiency and the extrapolation are treated as anticorrelated between the low- and high-purity categories.
For the low-mass analysis, one of the largest signal selection uncertainties is the uncertainty in the b tagging efficiency for the tagged categories of the analysis. The b tagging efficiencies and their corresponding systematic uncertainties are measured in data using samples enriched in b quark content, and their propagation to the signal region of the low-mass analysis produces an uncertainty of up to 4.3%. The uncertainties in the mistag efficiency are also considered; the uncertainties in the b tagging and mistag efficiencies are treated as anticorrelated between the tagged and untagged categories.
The impact of the uncertainties in the factorization and renormalization scales is propagated
both to the normalization and the mVZshapes for signal, and for the high-mass analysis to top
quark and VV backgrounds. The corresponding scales are varied by a factor of 2 to measure the effect, resulting in an uncertainty of 2% for the diboson background normalization and 15% for top quarks. The impact on the signal acceptance is evaluated to be 0.1–3%, depending on the resonance mass and analysis category.
A systematic uncertainty associated with the choice of the set of PDFs used to generate the simulated samples is evaluated by varying the NNPDF 3.0 PDF set within its uncertainties,
and its effect is propagated to both the signal and background mVZshapes and normalization,
resulting in a measured uncertainty of approximately 1%.
the contributions of pileup events and the integrated luminosity [50] are also considered and are reported in Table 1, together with the complete list of uncertainties considered in the analy-sis. In the high-mass analysis, the typical total uncertainty in the background normalization is in the range 10–60%, depending on the signal mass, and it is 1–5%, depending on the category, in the low-mass analysis.
Table 1: Summary of systematic uncertainties, quoted in percent, affecting the normalization of background and signal samples. Where a systematic uncertainty depends on the resonance mass (for signal) or on the category (for background), the smallest and largest values are re-ported in the table. In the case of a systematic uncertainty applying only to a specific back-ground source, the source is indicated in parentheses. Systematic uncertainties too small to be
considered are written as “<0.1”, while a dash (—) represents uncertainties not applicable in
the specific analysis category.
High-mass Low-mass Low-mass Merged Merged Resolved Source Background Signal Background Signal Background Signal Electron trigger and ID 2.0–3.0 2.0 2.0
Muon trigger and ID 1.5–3.0 1.5 1.5
Electron energy scale <0.1 1.0 0.8 0.1–0.5 1.3 1.2–2.5 Muon momentum scale <0.1 0.5–2.0 0.6 0.1–0.4 1.4 0.2–2.0 Jet energy scale 0.1–0.5 0.1 1.0 0.3–0.6 1.3 0.6–1.8 Jet energy resolution <0.1 <0.1 0.6 0.1 0.2 0.1–0.2 b tag SF untagged — — 0.2 0.3–0.4 0.1 0.6 b tag SF tagged — — 2.0 2.0–2.3 3.8 4.1–4.3 Mistag SF untagged — — 0.5 0.5–0.6 0.4 0.2–0.4 Mistag SF tagged — — 1.5 0.4–0.6 4.3 0.5–1.4
SM VZ production 12 — 12 — 12 —
SM t quark production 5 — 4 (eµ) — 4 (eµ) — V identification (τ21) — 11–23 6 (VZ) 6 — — V identification (extrapolation) — 2.5–20 — 2.6–6.0 — — V mass scale 0.5–2.5 1.0–2.0 0.2 (VZ) 0.5–1.1 — — V mass resolution 5.5 5–6 5.6 (VZ) 5.7–6.0 — — Z+jets normalization 9–15 — — — — — Pileup 0.5–4.0 0.4 0.5 0.1–0.3 0.1 0.3–0.5 PDFs 0.3–1.5 0.5 — 1.5–1.6 — 0.3–1.1
Renorm./fact. scales 2 (VZ), 15 (Top) 1.0–3.0 — 0.1–0.3 — 0.2–0.3
Integrated luminosity 2.5 2.5 2.5
8
Results and interpretation
Results are extracted separately for the high- and low-mass analyses from a combined
maxi-mum likelihood fit of signal and background to the mVZdistribution, simultaneously in all the
categories used in the respective analysis. An unbinned fit is performed in the high-mass anal-ysis, while a binned fit is performed in the low-mass one; this choice is determined by the fact that in the high-mass analysis, the signal and background shapes are described with analyti-cal functions, while in the low-mass analysis, the background shapes are described by binned histograms. The systematic uncertainties discussed in Section 7 are included as nuisance pa-rameters in the maximum likelihood fit, and the background-only hypothesis is tested against the combined background and signal hypothesis [51, 52].
The largest excess of events with respect to the background-only hypothesis, with a local
sig-nificance of 2.5 standard deviations, is observed in the vicinity of mX ≈ 1.2 TeV, and arises
17
analysis.
The limit at 95% confidence level (CL) on the signal cross section for the production of a heavy
spin-1 or spin-2 resonance is set using the asymptotic modified frequentist method (CLs) [51–
54].
The results of the low- and high-mass analyses should agree for the intermediate mass range 800–900 GeV, which is accessible to both strategies with similar expected efficiencies for signal candidates. The results of the analysis are therefore presented based on the low-mass strategy
up to resonance masses mX ≤850 GeV, and based on the high-mass analysis for mX≥850 GeV.
At the intermediate mass point mX=850 GeV, the results of both strategies are presented, and
the expected limits at 95% CL of the low- and high-mass analyses on the signal cross sections
are found to be in agreement within 3 and 6% for the W0 and bulk graviton signal model,
respectively.
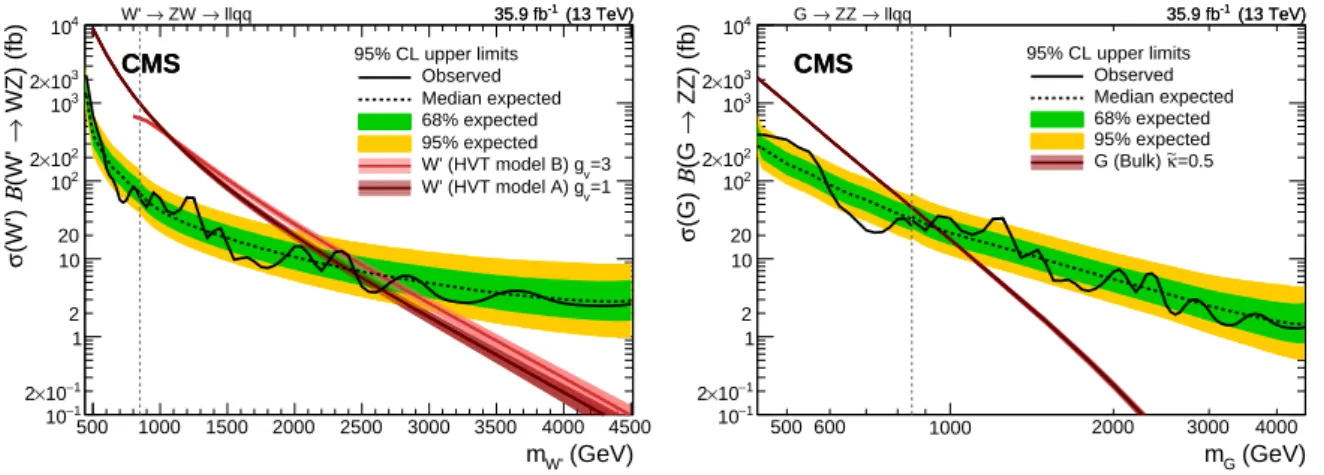
The observed upper limits on the resonance cross section, multiplied by the branching fraction
for the decay into one Z boson and a W or Z boson, σW0B(W0 → ZW)or σGB(G → ZZ), are
reported as a function of the resonance mass in Fig. 6 assuming a W0 or G produced in the
narrow-width approximation, and the local p-value [55] is shown in Fig. 7.
Based on the observed (expected) upper limits on the signal cross section, a W0 signal is
ex-cluded up to 2270 (2390) GeV in the framework of HVT model A (gV = 1), and up to 2330
(2630) GeV for HVT model B (gV = 3); a WED bulk graviton is excluded up to masses of 925
(960) GeV foreκ=0.5. (GeV) W' m 500 1000 1500 2000 2500 3000 3500 4000 4500 WZ) (fb) → (W' Β (W') σ 1 − 10 1 − 10 × 2 1 2 10 20 2 10 2 10 × 2 3 10 3 10 × 2 4 10 95% CL upper limits Observed Median expected 68% expected 95% expected =3 v W' (HVT model B) g =1 v W' (HVT model A) g llqq → ZW → W' 35.9 fb-1 (13 TeV) CMS (13 TeV) -1 35.9 fb CMS (GeV) G m 500 600 1000 2000 3000 4000 ZZ) (fb) → (G Β (G) σ 1 − 10 1 − 10 × 2 1 2 10 20 2 10 2 10 × 2 3 10 3 10 × 2 4 10 95% CL upper limits Observed Median expected 68% expected 95% expected =0.5 κ∼ G (Bulk) llqq → ZZ → G 35.9 fb-1 (13 TeV) CMS (13 TeV) -1 35.9 fb CMS
Figure 6: Observed and expected 95% CL upper limit on σW0B(W0 →ZW)(left) and σGB(G→
ZZ)(right) as a function of the resonance mass, taking into account all statistical and systematic
uncertainties. The electron and muon channels and the various categories used in the analysis are combined together. The green (inner) and yellow (outer) bands represent the 68% and 95% coverage of the expected limit in the background-only hypothesis. The dashed vertical line represents the transition from the low-mass to the high-mass analysis strategy. Theoretical
predictions for the signal production cross section are also shown: (left) W0 produced in the
framework of HVT model A with gv = 1 and model B with gv =3; (right) G produced in the
WED bulk graviton model witheκ=0.5.
9
Summary
A search for a heavy resonance decaying into a Z boson and a Z or a W boson in 2`2q final states
(GeV) W' m 500 1000 1500 2000 2500 3000 3500 4000 4500 Local p-value 3 − 10 2 − 10 1 − 10 σ 1 σ 2 σ 3 σ 4 σ 5 (13 TeV) -1 35.9 fb CMS llqq → ZW → W' (GeV) G m 500 600 1000 2000 3000 4000 Local p-value 3 − 10 2 − 10 1 − 10 σ 1 σ 2 σ 3 σ 4 σ 5 (13 TeV) -1 35.9 fb CMS llqq → ZZ → G
Figure 7: Observed local p-values for W0 (left) and G (right) narrow resonances as a function
of the resonance mass. The dashed vertical line represents the transition from the low-mass to the high-mass analysis strategy.
collisions at√s = 13 TeV during 2016 operations at the LHC, corresponding to an integrated
luminosity of 35.9 fb−1. The final state of interest consists of a Z boson decaying leptonically
into an electron or muon pair, and the decay of an additional W or Z boson into a pair of quarks. Two analysis strategies, dedicated to the low- and high-mass regimes (below and above 850 GeV, respectively), have been used to set limits in the range of resonance mass from 400 to 4500 GeV. Depending on the resonance mass, expected upper limits of 3–3000 and 1.5–400 fb
have been set on the product of the cross section of a spin-1 W0and the ZW branching fraction,
and on the product of the cross section of a spin-2 graviton and the ZZ branching fraction, respectively.
Acknowledgments
We congratulate our colleagues in the CERN accelerator departments for the excellent perfor-mance of the LHC and thank the technical and administrative staffs at CERN and at other CMS institutes for their contributions to the success of the CMS effort. In addition, we grate-fully acknowledge the computing centers and personnel of the Worldwide LHC Computing Grid for delivering so effectively the computing infrastructure essential to our analyses. Fi-nally, we acknowledge the enduring support for the construction and operation of the LHC and the CMS detector provided by the following funding agencies: BMWFW and FWF (Aus-tria); FNRS and FWO (Belgium); CNPq, CAPES, FAPERJ, and FAPESP (Brazil); MES (Bulgaria); CERN; CAS, MoST, and NSFC (China); COLCIENCIAS (Colombia); MSES and CSF (Croatia); RPF (Cyprus); SENESCYT (Ecuador); MoER, ERC IUT, and ERDF (Estonia); Academy of Fin-land, MEC, and HIP (Finland); CEA and CNRS/IN2P3 (France); BMBF, DFG, and HGF (Ger-many); GSRT (Greece); NKFIA (Hungary); DAE and DST (India); IPM (Iran); SFI (Ireland); INFN (Italy); MSIP and NRF (Republic of Korea); LAS (Lithuania); MOE and UM (Malaysia); BUAP, CINVESTAV, CONACYT, LNS, SEP, and UASLP-FAI (Mexico); MBIE (New Zealand); PAEC (Pakistan); MSHE and NSC (Poland); FCT (Portugal); JINR (Dubna); MON, RosAtom, RAS and RFBR (Russia); MESTD (Serbia); SEIDI, CPAN, PCTI and FEDER (Spain); Swiss Fund-ing Agencies (Switzerland); MST (Taipei); ThEPCenter, IPST, STAR, and NSTDA (Thailand); TUBITAK and TAEK (Turkey); NASU and SFFR (Ukraine); STFC (United Kingdom); DOE and NSF (USA).
Individuals have received support from the Marie-Curie program and the European Research Council and Horizon 2020 Grant, contract No. 675440 (European Union); the Leventis
Foun-References 19
dation; the A. P. Sloan Foundation; the Alexander von Humboldt Foundation; the Belgian Fed-eral Science Policy Office; the Fonds pour la Formation `a la Recherche dans l’Industrie et dans l’Agriculture (FRIA-Belgium); the Agentschap voor Innovatie door Wetenschap en Technologie (IWTBelgium); the F.R.S.FNRS and FWO (Belgium) under the “Excellence of Science EOS” -be.h project n. 30820817; the Ministry of Education, Youth and Sports (MEYS) of the Czech Re-public; the Lend ¨ulet (“Momentum”) Program and the J´anos Bolyai Research Scholarship of the
Hungarian Academy of Sciences, the New National Excellence Program ´UNKP, the NKFIA
re-search grants 123842, 123959, 124845, 124850 and 125105 (Hungary); the Council of Science and Industrial Research, India; the HOMING PLUS program of the Foundation for Polish Science, cofinanced from European Union, Regional Development Fund, the Mobility Plus program of the Ministry of Science and Higher Education, the National Science Center (Poland), contracts Harmonia 2014/14/M/ST2/00428, Opus 2014/13/B/ST2/02543, 2014/15/B/ST2/03998, and 2015/19/B/ST2/02861, Sonata-bis 2012/07/E/ST2/01406; the National Priorities Research Program by Qatar National Research Fund; the Programa Estatal de Fomento de la Investi-gaci ´on Cient´ıfica y T´ecnica de Excelencia Mar´ıa de Maeztu, grant MDM-2015-0509 and the Pro-grama Severo Ochoa del Principado de Asturias; the Thalis and Aristeia programs cofinanced by EU-ESF and the Greek NSRF; the Rachadapisek Sompot Fund for Postdoctoral Fellowship, Chulalongkorn University and the Chulalongkorn Academic into Its 2nd Century Project Ad-vancement Project (Thailand); the Welch Foundation, contract C-1845; and the Weston Havens Foundation (USA).
References
[1] K. Agashe, H. Davoudiasl, G. Perez, and A. Soni, “Warped gravitons at the LHC and beyond”, Phys. Rev. D 76 (2007) 036006, doi:10.1103/PhysRevD.76.036006, arXiv:hep-ph/0701186.
[2] L. Randall and R. Sundrum, “A large mass hierarchy from a small extra dimension”, Phys. Rev. Lett. 83 (1999) 3370, doi:10.1103/PhysRevLett.83.3370,
arXiv:hep-ph/9905221.
[3] L. Randall and R. Sundrum, “An alternative to compactification”, Phys. Rev. Lett. 83 (1999) 4690, doi:10.1103/PhysRevLett.83.4690, arXiv:hep-th/9906064. [4] A. L. Fitzpatrick, J. Kaplan, L. Randall, and L.-T. Wang, “Searching for the Kaluza-Klein
graviton in bulk RS models”, JHEP 09 (2007) 013,
doi:10.1088/1126-6708/2007/09/013, arXiv:hep-ph/0701150.
[5] W. D. Goldberger and M. B. Wise, “Modulus stabilization with bulk fields”, Phys. Rev. Lett. 83 (1999) 4922, doi:10.1103/PhysRevLett.83.4922,
arXiv:hep-ph/9907447.
[6] D. Pappadopulo, A. Thamm, R. Torre, and A. Wulzer, “Heavy vector triplets: Bridging theory and data”, JHEP 09 (2014) 060, doi:10.1007/JHEP09(2014)060,
arXiv:1402.4431.
[7] CMS Collaboration, “Search for heavy resonances decaying into a vector boson and a Higgs boson in final states with charged leptons, neutrinos, and b quarks”, Phys. Lett. B
[8] CMS Collaboration, “Search for massive resonances decaying into WW, WZ or ZZ
bosons in proton-proton collisions at√s =13 TeV”, JHEP 03 (2017) 162,
doi:10.1007/JHEP03(2017)162, arXiv:1612.09159.
[9] CMS Collaboration, “Combination of searches for heavy resonances decaying to WW,
WZ, ZZ, WH, and ZH boson pairs in proton-proton collisions at√s=8 and 13 TeV”,
Phys. Lett. B 774 (2017) 533, doi:10.1016/j.physletb.2017.09.083, arXiv:1705.09171.
[10] ATLAS Collaboration, “Search for heavy resonances decaying to a W or Z boson and a
Higgs boson in the q ¯q(0)b¯b final state in pp collisions at√s=13 TeV with the ATLAS
detector”, Phys. Lett. B 774 (2017) 494, doi:10.1016/j.physletb.2017.09.066, arXiv:1707.06958.
[11] CMS Collaboration, “Search for a heavy resonance decaying into a Z boson and a vector boson in the ννqq final state”, JHEP 07 (2018) 075, doi:10.1007/JHEP07(2018)075,
arXiv:1803.03838.
[12] J. Alwall et al., “The automated computation of tree-level and next-to-leading order differential cross sections, and their matching to parton shower simulations”, JHEP 07 (2014) 079, doi:10.1007/JHEP07(2014)079, arXiv:1405.0301.
[13] A. Carvalho, “Gravity particles from warped extra dimensions, predictions for LHC”, (2014). arXiv:1404.0102.
[14] R. Frederix and S. Frixione, “Merging meets matching in MC@NLO”, JHEP 12 (2012) 061, doi:10.1007/JHEP12(2012)061, arXiv:1209.6215.
[15] R. Gavin, Y. Li, F. Petriello, and S. Quackenbush, “FEWZ 2.0: A code for hadronic Z production at next-to-next-to-leading order”, Comput. Phys. Commun. 182 (2011) 2388,
doi:10.1016/j.cpc.2011.06.008, arXiv:1011.3540.
[16] J. Alwall et al., “Comparative study of various algorithms for the merging of parton showers and matrix elements in hadronic collisions”, Eur. Phys. J. C 53 (2008) 473,
doi:10.1140/epjc/s10052-007-0490-5, arXiv:0706.2569.
[17] P. Nason, “A new method for combining NLO QCD with shower Monte Carlo algorithms”, JHEP 11 (2004) 040, doi:10.1088/1126-6708/2004/11/040,
arXiv:hep-ph/0409146.
[18] S. Frixione, P. Nason, and C. Oleari, “Matching NLO QCD computations with parton shower simulations: the POWHEG method”, JHEP 11 (2007) 070,
doi:10.1088/1126-6708/2007/11/070, arXiv:0709.2092.
[19] S. Alioli, P. Nason, C. Oleari, and E. Re, “A general framework for implementing NLO calculations in shower Monte Carlo programs: the POWHEG BOX”, JHEP 06 (2010) 043, doi:10.1007/JHEP06(2010)043, arXiv:1002.2581.
[20] S. Alioli, P. Nason, C. Oleari, and E. Re, “NLO single-top production matched with shower in POWHEG: s- and t-channel contributions”, JHEP 09 (2009) 111,
doi:10.1088/1126-6708/2009/09/111, arXiv:0907.4076. [Erratum:
References 21
[21] E. Re, “Single-top Wt-channel production matched with parton showers using the POWHEG method”, Eur. Phys. J. C 71 (2011) 1547,
doi:10.1140/epjc/s10052-011-1547-z, arXiv:1009.2450.
[22] T. Sj ¨ostrand et al., “An introduction to PYTHIA 8.2”, Comput. Phys. Commun. 191 (2015) 159, doi:10.1016/j.cpc.2015.01.024, arXiv:1410.3012.
[23] CMS Collaboration, “Event generator tunes obtained from underlying event and multiparton scattering measurements”, Eur. Phys. J. C 76 (2016) 155,
doi:10.1140/epjc/s10052-016-3988-x, arXiv:1512.00815.
[24] NNPDF Collaboration, “Parton distributions from high-precision collider data”, Eur. Phys. J. C 77 (2017) 663, doi:10.1140/epjc/s10052-017-5199-5,
arXiv:1706.00428.
[25] GEANT4 Collaboration, “GEANT4: A simulation toolkit”, Nucl. Instrum. Meth. A 506 (2003) 250, doi:10.1016/S0168-9002(03)01368-8.
[26] CMS Collaboration, “The CMS experiment at the CERN LHC”, JINST 3 (2008) S08004,
doi:10.1088/1748-0221/3/08/S08004.
[27] CMS Collaboration, “Particle-flow reconstruction and global event description with the CMS detector”, JINST 12 (2017) P10003, doi:10.1088/1748-0221/12/10/P10003,
arXiv:1706.04965.
[28] CMS Collaboration, “Description and performance of track and primary-vertex reconstruction with the CMS tracker”, JINST 9 (2014) P10009,
doi:10.1088/1748-0221/9/10/P10009, arXiv:1405.6569.
[29] CMS Collaboration, “Performance of electron reconstruction and selection with the CMS
detector in proton-proton collisions at√s=8 TeV”, JINST 10 (2015) P06005,
doi:10.1088/1748-0221/10/06/P06005, arXiv:1502.02701.
[30] CMS Collaboration, “Performance of CMS muon reconstruction in pp collision events at√
s =7 TeV”, JINST 7 (2012) P10002, doi:10.1088/1748-0221/7/10/P10002,
arXiv:1206.4071.
[31] M. Cacciari, G. P. Salam, and G. Soyez, “The anti-kTjet clustering algorithm”, JHEP 04
(2008) 063, doi:10.1088/1126-6708/2008/04/063, arXiv:0802.1189.
[32] M. Cacciari, G. P. Salam, and G. Soyez, “FastJet user manual”, Eur. Phys. J. C 72 (2012) 1896, doi:10.1140/epjc/s10052-012-1896-2, arXiv:1111.6097.
[33] CMS Collaboration, “Jet energy scale and resolution in the CMS experiment in pp collisions at 8 TeV”, JINST 12 (2017) P02014,
doi:10.1088/1748-0221/12/02/P02014, arXiv:1607.03663.
[34] M. Dasgupta, A. Fregoso, S. Marzani, and G. P. Salam, “Towards an understanding of jet substructure”, JHEP 09 (2013) 029, doi:10.1007/JHEP09(2013)029,
arXiv:1307.0007.
[35] A. J. Larkoski, S. Marzani, G. Soyez, and J. Thaler, “Soft drop”, JHEP 05 (2014) 146,