Do German Corporate Accelerators Accelerate?
Examining the learning experience
and success of startups participating in corporate
accelerator programs in Germany
Marius Kramer
152415052
Dissertation written under
the supervision of professor Claudia Costa
Dissertation submitted in partial fulfillment of
requirements for the MSc in Finance, at Universidade
Católica Portuguesa
31.05.2017
Title: Do German Corporate Accelerators Accelerate?
Examining the learning experience and success of startups participating in corporate accelerator programs in Germany
Abstract
Startups gain importance in job creation and developing disruptive and highly innovative products and services. Despite the fact that startups are able to threaten business models of large companies, they often lack certain resources to further develop their business model. In this context, large corporations use the possibility to engage with highly innovative startups by setting up corporate accelerator programs. Through these programs, startups receive resources and in exchange, the corporate accelerator gains access to external innovations. The present dissertation is based on a survey conducted with alumni startups of corporate accelerator programs in Germany and measures the impact of expectations on learning throughout the program. Further, possible downsides for participating startups are considered and the subjective as well as objective outcomes are analyzed. The literature review covering corporate accelerators, learning, and investors’ decision-making theory incorporates the dissertation into the existing research landscape. Results show that expectations towards the program lead to higher learning. Hence, high expectations guarantee high learning. A negative impact of possible downsides of corporate accelerator programs on startups was not found. However, the positive and significant relation between learning and the subjective outcome, measured directly at the end of the program, was quantified. It reflected satisfaction and overall learning. Further, the programs significantly increased participants’ long-term success measures. The present dissertation adds value in this field of study, since the research landscape lacks quantitative studies focusing on the impact of corporate accelerators on alumni startups.
Resumo
As Startups ganham importância na criação de emprego e no desenvolvimento de productos e serviços disruptivos, altamente inovadores. Apesar de ameaçarem os modelos de negócios das grandes empresas, muitas vezes não possuem os recursos para desenvolver os seus próprios modelos de negócios. Neste contexto, as grandes empresascriam programas corporativos de aceleração, de modo a interagirem com elas. Através destes programas, as Startups recebem recursos e, em troca, o patrocinador do programa de aceleração ganha acesso a inovações externas. Esta dissertação é baseada em questionários feitos a alumni de programas de aceleração Alemães, e mede o impacto das expectativas de aprendizagem no programa na aprendizagem real. Além disso, consequências negativas são consideradas e o seu resultado, quer objectivo quer subjectivo, é analisado. A revisão de literatura que cobre programas de aceleração, aprendizagem e o processo de decisão da teoria do investidor incorpora a dissertação na investigação existente. Os resultados demonstram que as expectativas em relação ao programa induzem uma maior aprendizagem. Assim, maiores expectativas levam a uma maior aprendizagem. O impacto negativo de eventuais consequências adversas dos programas nas Startups não foi provado. Contudo, a relação positiva e significante entre a aprendizagem e o resultado directo subjectivo, que mede a satisfação, e a aprendizagem geral foi quantificada. Além disso, os programas aumentam significamente as medidas de sucesso a longo-prazo dos participantes. Esta dissertação acrescenta valor neste campo de estudo dado que, neste campo, existe uma ausência de estudos quantitativos focados no impacto dos programas de aceleração nas Startups participantes.
To Clarissa, my family, and my friends who continuously supported me throughout my academic career and personal life. Further, I would like to thank my supervisor professor Claudia Costa for her valuable feedback throughout the dissertation process.
Table of Content
List of Figures ... II List of Tables ... II
1. Introduction ... 1
1.1 Problem Definition and Relevance ... 1
1.2 Objective and Research Questions ... 2
2. Academic Literature Review ... 5
2.1 Learning in an Entrepreneurial Setting ... 5
2.2 Corporate Accelerator ... 7
2.3 Possible Downsides of Corporate Accelerators ... 10
2.4 Investors’ Decision-Making Criteria ... 12
3. Conceptual Framework and Hypotheses ... 13
4. Methodology and Data Collection ... 16
4.1 Research Model ... 16
4.2 Sampling ... 16
4.3 Research Instruments ... 16
4.4 Design and Procedure ... 17
4.5 Variable Descriptions ... 18
5. Analysis and Results ... 23
5.1 Sample Characterization ... 23
5.2 Model Assumptions ... 23
5.3 Main Results ... 29
5.4 Further Analysis ... 32
6. Conclusion and Implications ... 35
6.1 Theoretical Implications ... 36
6.2 Practical Implications ... 37
7. Limitations and Future Research ... 39
Appendices ... 41
List of Figures
Figure 1: Key Learning Types ... 6
Figure 2: The Corporate Accelerator ... 7
Figure 3: Key Dimensions of an Accelerator ... 8
Figure 4: Different Corporate Accelerator Types and their Primary Objectives ... 9
Figure 5: Conceptual Framework ... 13
List of Tables
Table 1: Cronbach’s Alpha Product Expectations ... 24Table 2: Cronbach's Alpha Market Expectations ... 24
Table 3: Cronbach's Alpha Market Learning ... 25
Table 4: Cronbach's Alpha Downsides ... 26
Table 5: Factor Outer Loadings ... 27
Table 6: Average Variance Extracted and Correlations ... 28
Table 7: Path Coefficients Hypothesis 1 ... 29
Table 8: Path Coefficients Hypothesis 2 ... 30
Table 9: Path Coefficients Hypothesis 3 ... 31
Table 10: Path Coefficients Hypothesis 4 ... 32
Table 11: Path Coefficients Hypothesis 5 ... 32
Table 12: Cronbach's Alpha Network ... 33
Table 13: Path Coefficients Model 1 and Model 2 ... 33
1. Introduction
1.1 Problem Definition and Relevance
“Between 1988 and 2011 companies more than five years old destroyed more jobs than they created in all but eight of those years.” (Denning, 2015, p. 1). This finding points to the growing importance of startups for the economy since new businesses account for the majority of net job creation. Besides job creation, entrepreneurship adds value through transforming technical knowledge into products and services (Denning, 2015). Further, it helps to overcome inefficiencies in the economy and is a key component in the process of change due to its innovative impact (Schumpeter, 1934).
The description of entrepreneurship is often related to a specific setting, for example small businesses or new firms, rather than to a specific concept, distinguishable from other business concepts (Shane & Venkataraman, 2000). Since the key basis of entrepreneurship is the discovery and exploitation of profitable opportunities, Shane and Venkataraman (2000) intend to give legitimacy to the field of entrepreneurship, apart from being a research setting or a teaching application. Their approach goes beyond previous definitions and instead emphasizes that entrepreneurial opportunities differ from all other opportunities concerned with profit optimization and increasing efficiency. Entrepreneurial opportunities are about new mean-ends relationships and other business opportunities are more interested in existing ones. Hereby, the asymmetry of beliefs is a requirement for an entrepreneurial opportunity. However, studying entrepreneurship is a challenge since data cannot be easily retrieved, little theory is available, and many results are comparable to other business fields. Nevertheless, reasons exist to pursue studying entrepreneurship (Shane & Venkataraman, 2000).
A recent development in entrepreneurship is that global players such as SAP, Siemens and Microsoft have launched accelerator programs to engage with promising startups in hopes to benefit from their innovations (Weiblen & Chesbrough, 2015). These corporate accelerator (CA) programs are a specific unit of analysis within the limited research on accelerator programs (Pauwels, Clarysse, Wright, & Van Hove, 2016). Despite the fact that some papers describe the CA concept (Cohen, 2013; Kanbach & Stubner, 2016; Kohler, 2016), little research sheds light on the startups participating in such a CA program. Especially, the quantitative point of view covering intention to participate, hence expectations towards the
program, and the learning throughout the program is scarcely considered. Additionally, authors such as Crichton (2014) list various possible downsides of CA programs for startups. For example, a very close relation between the program and the startup might harm the new venture’s development and fit for the open market. However, the lack of research into these downsides necessitates further investigation.
1.2 Objective and Research Questions
The majority of studies on CA is of exploratory and qualitative nature (Bauer, Obwegeser, & Avdagic, 2016). Therefore, the author aims to explore the research topic from a quantitative perspective while applying the already existing research. Firstly, the influence of expectations towards the CA program on the learning throughout the program will be explored. Secondly, the further development and progress of CA alumni start-ups will be analyzed. Furthermore, investor selection criteria of potential startups are used to determine relevant items for the analysis in order to ensure that the present study focuses on the aspects, which investors consider as success factors.
To the best of the author’s knowledge, the present dissertation provides a new approach to the yet limited research landscape. It provides a deeper understanding of the value CA programs add to new ventures (Kanbach & Stubner, 2016). Further, relevant success factors including specific program elements from an entrepreneurial point of view are investigated (Becker & Gassmann, 2006; Hochberg, 2016). Due to the fact that the second largest number of CA programs worldwide is located in Germany (Kanbach & Stubner, 2016), the study focuses on German programs. Within the scope of this dissertation, only alumni startups of the thirteen German CA programs are considered. Please see Appendix I with a detailed list of the programs and the contacted startups.
The objective of this dissertation is to provide quantitative results from the entrepreneur’s point of view including the expectations during the application process, the learning throughout the program, and the state of the venture after the CA program.
Therefore, the following research questions are addressed:
The first research question aims to understand the impact of expectations while applying for a CA program on perceived learning throughout the program. Firstly, it explores the startups’ expectations towards the program and, secondly, the obtained learning within different areas. Hereby, the study allows quantifying the impact of expectations on learning.
RQ 2: How does perceived learning impact the startups’ satisfaction with the CA program? Focusing on perceived learning throughout the CA program and on overall satisfaction, the second research question helps to identify the impact of perceived learning on program satisfaction.
RQ 3: Does the structure of the CA program fulfill the startups’ expectations?
This research question matches the startups’ expectations with the actual learning experience encountered throughout the program. It provides information if the CA targets the startups’ needs and meets expectations.
RQ 4: What is the long-term impact of a CA program?
The goal of this research question is to explore if a CA program enhances the startups’ success. Or, if the program stands for itself and does not have a considerable impact on the time period after the program.
RQ 5: Does a CA program have downsides for participants?
This research question addresses possible disadvantages for startups associated with their participation in a CA program. Further, it considers the research on downsides of such programs due to the differences in size and development stage of large corporations and startups (Doz, 1987; Dushnitsky & Lenox, 2005; Weiblen, 2015). Addressing the issue from a quantitative and thus new perspective adds to the existing research.
Since the study focuses on the early stage of a startup’s development, the object of analysis is not only the startup itself but also the employees, mostly the founders and co-founders, who participated in the program. In the early stage of a new venture, the mentioned objects startup, founder and co-founder can be used interchangeably.
1.3 Thesis Structure
The dissertation is comprised of seven chapters. The first chapter contains an introduction to the underlying problem and a description of the dissertation’s structure. The academic literature review in the subsequent chapter outlines the existing research landscape and puts the dissertation into the appropriate context. In the third chapter, the conceptual framework visualizes the study and hypotheses follow. The fourth chapter encompasses the analysis and the study results and is followed by the conclusion and implications in the sixth chapter. The dissertation ends with its limitations and avenues for future research, summarized in chapter seven.
2. Academic Literature Review
To incorporate the study into the existing research landscape, an academic literature review of learning in an entrepreneurial setting, corporate accelerators, possible downsides of corporate accelerators and investors’ decision-making criteria is presented in the following sections.
2.1 Learning in an Entrepreneurial Setting
Knowledge is an outcome of experiencing success and failure after applying certain actions. Dependent on the obtained outcome, an action is categorized and its probability to be applied to solve a specific situation increases or decreases. However, this does not necessarily lead to an optimal strategy, since an inferior action which randomly leads to a positive outcome is associated with positive expectations and beliefs as well (Minniti & Bygrave, 2001).
Learning is understood as a dynamic process throughout which “a subjective stock of knowledge is accumulated on the basis of past experience” (Minniti & Bygrave, 2001, p. 5). Hence, entrepreneurs learn by continuously updating their decision-making process based on experiences, gained information and mistakes (p. 14). In fact, the learning throughout the entrepreneurial activity comprises the process between the initial moment of spotting an opportunity and the final developed product or service. These self-reinforcing learning cycles are fundamental for the innovation process in startups to develop a holistic business model (Ravasi & Turati, 2005).
Wang and Chugh (2014) describe entrepreneurial learning using a combination of entrepreneurship and organizational learning literature. Entrepreneurial learning explores the content behind the learning experience and the occurring learning processes taking place during the creation of a venture (Cope, 2005). Wang and Chugh (2014) define three pairs of key learning types including “individual and collective” learning, “exploratory and exploitative” learning, as well as “intuitive and sensing” learning. Whereas intuitive and sensing learning are enshrined in knowing relationships of facts, individual and collective learning focus on the process of how knowledge is gained. Exploratory learning entails a learning process designed to increase variance to draw valuable results, while exploitative learning includes a learning process, which incorporates a directed search to find average
solutions and to decrease variance (Wang & Chugh, 2014). Figure 1 outlines a detailed description of key learning types within entrepreneurial learning.
Intuitive Learning
Learning by knowing relationships of facts through
discovering possibilities (abstract, conceptual thinking)
(Felder & Silverman, 1988)
Sensing Learning
Learning by knowing facts or details based on external contacts
through sights, sounds and physical sensations (concrete,
analytical thinking) (Felder & Silverman, 1988)
Individual Learning
The process in which individuals acquire data, information, skill or
knowledge.
Collective Learning
“a social process of cumulative knowledge, based on a set of
shared rules and procedures which allow individuals to coordinate their actions in search
for problem solutions” (Capello, 1999, p. 354)
Exploratory Learning
Focus on discovery through enactment and interpretation to generate enough variations that some will prove ex post to yield
desirable results (variance-seeking learning that increases
performance variance) (McGrath, 2001)
Exploitative Learning
Emphasis on directed search that is amenable to ex ante planning
and control to limit variety achieved by honing in on and
deepening initial insights as experience increases (mean-seeking learning that improves mean performance and decreases
variance) (McGrath, 2001)
Figure 1: Key Learning Types
Source: adapted from Wang and Chugh (2014)
Startups are substantially affected if there is a lack of resources. A high level of uncertainty at the beginning of the venture creation process and the need of contributions such as financial resources, skills and competencies underline the special characteristics of the entrepreneurial learning process (Ravasi & Turati, 2005).
Since learning is critical for the success of new ventures, different programs exist to support startups throughout their learning process. In the next section, a definition of the CA program and its characteristics are presented.
2.2 Corporate Accelerator
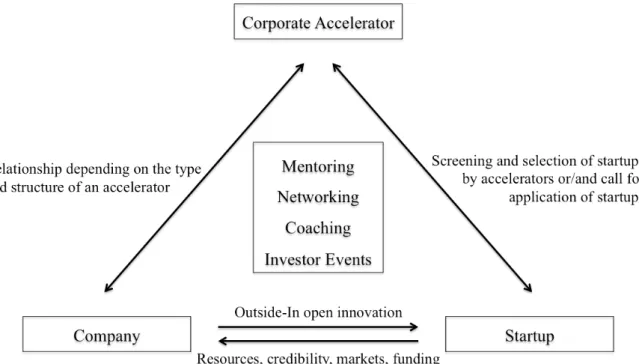
CA programs are initiated by a sponsoring corporate entity whose main business does not include the investment in startups (Kanbach & Stubner, 2016). It is often a time-limited program of approximately three months. During the program, a group, called cohort or batch, of early stage startups is supported to enhance its new venture process through mentoring, learning and resources provided by the sponsoring entity (Kohler, 2016; Weiblen & Chesbrough, 2015). Provided resources include for example funding and co-location (Weiblen & Chesbrough, 2015). Interested ventures participate in an open application process if their product or technology meets certain criteria e.g. a specific industry focus (Kohler, 2016; Weiblen & Chesbrough, 2015). Generally, the program ends with a demo day on which participants pitch their ideas to an audience of potential future investors (Cohen & Hochberg, 2014). Figure 2 illustrates the setup of a CA.
Figure 2: The Corporate Accelerator
The Accelerator in General
Kohler (2016) states that CAs are a further development of business incubators, whereas Weiblen and Chesbrough (2015) describe the programs as an imitation of more recent independent accelerator programs. Pauwels et al. (2016) characterize accelerators as “a new generation incubation model” (p. 13) and strengthen its importance in the current development “towards a focus on intangible, knowledge intensive, support services in incubation services” (p. 14).
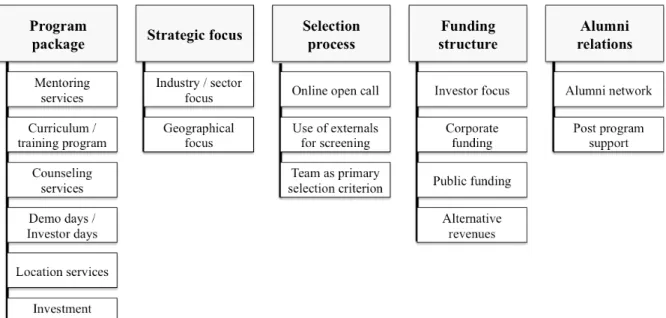
Based on the study findings, Pauwels et al. (2016) distinguish between five design elements, capturing the key dimensions of an accelerator program. Program package, strategic focus, selection process, funding structure and alumni relations define the basic structure (Figure 3).
Figure 3: Key Dimensions of an Accelerator
Source: adapted from Pauwels et al. (2016)
The concrete characteristics of the design elements within the accelerator and its execution depend on the goals which the accelerator’s financing entity pursues (Pauwels et al., 2016). Kim and Wagman (2014) emphasize the accelerator’s role “in certifying the value of portfolio ventures to outside investors” (p. 24) and thus the positive correlation between the valuation of certain ventures and the accelerator’s reputation.
Objectives of a Corporate Accelerator
Main objectives to set up a CA are of financial or strategic nature. However, details including the program’s focus and its organization open up freedom in its design. Defining program
details such as an explorative or exploitative strategic logic, a tight or broad industry focus, equity involvement and the venture stage of the accepted startup lead to programs with distinctive specializations. The program organization deals with decisions whether external partners contribute to the program, the degree of connection to the sponsoring entity and whether the source of leadership experience is internal or external. All these different adjustments allow an exact alignment with the needs of the sponsoring entity (Kanbach & Stubner, 2016). Due to the CA’s characteristics and its primary objective, Kanbach and Stubner (2016) subdivide the programs in four main groups, namely listening post, value chain investor, test laboratory and unicorn hunter as outlined in Figure 4.
Listening Post Value Chain Investor Test Laboratory Unicorn Hunter
Understand recent trends and developments in a respective market and
initiate relationships
Identify, develop, and integrate new products and services into parent
company’s value chain
Create a protected environment to test promising internal and external business ideas
Invest in promising startups, make them
more valuable, and earn a financial
premium
Figure 4: Different Corporate Accelerator Types and their Primary Objectives
Source: adapted from Kanbach and Stubner (2016)
By connecting with startups, corporations receive access to external innovation (Doz, 1987; Kohler, 2016; Pauwels et al., 2016; Weiblen & Chesbrough, 2015). Furthermore, they overcome the “innovator’s dilemma” (Moschner & Herstatt, 2016, p. 1), which highlights the lack of innovations within established firms. Access to innovation may also prevent the corporation from ending up with a situation in which a disruptive, external innovation threatens its entire business model to become obsolete (Moschner & Herstatt, 2016). Since the innovation process is initiated externally in the startup and the engagement with the established firm only starts afterwards, a CA program is part of the outside-in innovation programs. The startup operates as the supplier of a new, innovative product or technology improved with resources provided by the corporation which later benefits from accessing these inventions (Weiblen & Chesbrough, 2015). Markides and Geroski (2004) point out that established companies should not be involved in creating disruptive product innovations and rather focus on their scalability skills since these are their strengths. Thus, startups should independently handle the creation of disruptive innovations since they have the necessary competency. Following this logic, the role of large corporations is to foster a network of startups and provide the financial resources and skills to scale the business. Both players contribute the skills in line with their comparative advantage (Markides & Geroski, 2004).
Benefits of Corporate Accelerator Programs for Participants and the Sponsoring Entity
A CA program is advantageous for both the sponsoring entity and the participating startups. For sponsoring corporations, supporting new products and innovations closes innovation gaps within their organization. They can overcome severe business challenges and invest in arising opportunities to expand into new markets. At the same time, the sponsoring entities’ working culture is positively influenced by the entrepreneurial setting, which facilitates attracting and retaining talented employees (Kohler, 2016). Further, Kohler (2016) points to several success drivers for a CA program. These include a careful selection process, capable program managers to serve the startups and the corporation at the same time, and executive management’s commitment towards the program. Additionally, corporation employees should be involved at an early stage to align interests and to guarantee the program’s fit. Moreover, the effort of the CA to not only interact with its participants but to become a player in the entrepreneurial ecosystem substantially adds value to the corporation and the startups.
Key benefits for startups are: internal and external mentoring, creation of a lasting network, access to resources as well as increased reputation and access to markets and funding. These aspects make the participation in a CA worthwhile (Kohler, 2016). The CA program creates a learning experience comparable to “years’ worth of learning by doing” (Hathaway, 2016, p. 2). Further, Hathaway (2016) highlights several main findings from previous research on leading accelerator programs. Firstly, graduates from top accelerator programs were more likely to reach key milestones in the venture creation process compared to startups that did not participate in accelerator programs. Secondly, startups graduating from top accelerators received another funding round earlier and were either acquired or failed. Thirdly, the learning experience itself and the attraction of seed and early-stage financing opportunities for the local entrepreneurial ecosystems are the benefits of a CA program for new ventures.
2.3 Possible Downsides of Corporate Accelerators
However, following Clegg, Minshall, Mortara, Elia, and Probert (2008), various issues arise due to the asymmetric partnership between a corporation and a startup. Hereby, the “significant differences in scale and commercial experience” (Clegg et al., 2008) are a major issue.Doz (1987) states that due to misalignment of objectives of large corporations and startups, “strategic partnerships between large, established, bureaucratic companies and smaller,
entrepreneurial, fledgling firms” (p. 56) are rarely effective. Besides, Kohler (2016) outlines the importance of involving the right people to guarantee the success of a CA program and the associated considerable effort. Following Doz (1987), four main aspects threaten the success of such partnerships. First, there is a hidden agenda problem due to the competition within the partnership since the large corporation aims to appropriate the technology of the smaller one and the startup tries to retain control. Secondly, the two company strategies and cultures are too different to ensure a valuable interaction. Startups are more agile and “different organizational clock speeds take their toll along the way” (Weiblen & Chesbrough, 2015, p. 67). Third, individual goals of employees within the large corporation can be counterproductive for the development of a valuable engagement. Fourth, top management decisions and the later implementation by middle management create a situation which is difficult to handle for the operating manager of the partnership (Doz, 1987).
Research criticizes that accelerator programs focus too much on preparing the graduation day with investors and that after the program, interaction between participants and the sponsoring entity is lacking (Isabelle, 2013). Moreover, Weiblen and Chesbrough (2015) mention possible downsides of corporate incubators1. To describe the fact that participants are possibly overprotected since the corporate incubator creates an artificial environment, they refer to the “risk of overprotection through corporate backing” (p. 71). Thus, a later failure is probable since the participants’ business models do not fit in the real business environment. Moreover, the close connections with the sponsoring entity possibly “prevent incubator-bound startups from pursuing partnerships with their parent’s competitors or from developing competing products” (p. 71) with the potential to disrupt the sponsoring entity’s business. In case corporate venture capital is involved, Weiblen and Chesbrough (2015) emphasize the possible negative impact on the freedom to pivot and on collaborating with competitors of the corporate venture capitalist. Park and Steensma (2012) highlight the possible restricted access to supplementary assets in the open market due to the startup’s engagement with a specific corporate venture capitalist. Further, there is the risk that the corporation’s and the startup’s products compete and the threat that the startup’s intellectual property gets expropriated. Dushnitsky and Lenox (2005) describe corporate venture capital programs as a possible instrument when it comes to “harvesting innovations from entrepreneurial ventures” (p. 615), especially, in “weak intellectual property (IP) regimes” (p. 615).
1 Since the program setups are comparable to a corporate accelerator program, possible downsides from other
2.4 Investors’ Decision-Making Criteria
When deciding to fund a promising start-up, investors apply certain selection criteria. Csaszar, Nussbaum, and Sepulveda (2006) combine strategic and cognitive criteria in their methodology to guide venture capitalists through the selection process of potential startups. Since the evaluation of technical know-how and business expertise reaches its limits, the decision-making process during the projects selection phase is expanded and improved with a cognitive model. Hereby, an analysis of the variables influencing venture’s success guarantees that the right criteria is applied during the evaluation phase and a more reliable outcome is obtained. In the developed decision aid, each of the three categories of strategy, team and finance includes various questions to evaluate the startups potential in the best possible way. Conversely, Carpentier and Suret (2015) focus on the rejection reasons, versus selection reasons, applied by the decision makers. They conduct a longitudinal analysis considering the decision-making process of business angel group members when selecting promising startups. Hereby, a categorization of the rejection reasons into the areas product and model, market, financial, team and other is carried out.
Studying decision patterns of business angels when selecting potential early stage startups, Maxwell, Jeffrey, and Lévesque (2011) conclude that business angels do not apply a decision model based on weights and scores assigned to different selection attributes. Hence, a shorter list of decision criteria including eight critical factors is developed: adoption, product status, protectability, customer engagement, route to market, market potential, relevant experience and financial model. However, previous research mainly divided the decision criteria into the five groups product, market, entrepreneur, financial and investment (Maxwell et al., 2011).
3. Conceptual Framework and Hypotheses
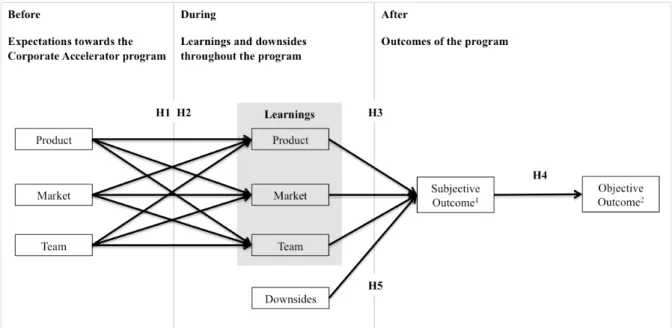
After reviewing literature on learning theory, corporate accelerators, accelerators and investors’ decision-making criteria, the conceptual framework is presented in Figure 5.
Except the variables covering downsides, all variables are based on the investors’ decision-making criteria.
1 includes variables measuring Satisfaction and Overall Learning Experience
2 includes variables measuring the impact on Venture Success, Sales, Follow-up Funding and Employer
Attractiveness
Figure 5: Conceptual Framework
Source: Own elaboration
The conceptual framework (Figure 5) highlights that, for the empirical study, a chronological differentiation between before, during and after the CA program takes place. Relevant items were extracted from the investors’ decision-making criteria literature and categorized into the three areas product, market and team. The three areas are included in the first and the second part of the study. In the first part, they refer to the expectations to participate in a CA program. In the second part, the same areas with the same underlying items are used to explore the learning throughout the CA program.
Further, to evaluate the state of the startup after the CA program, other variables are selected. Overall satisfaction with the program and fundamental learning experience are combined in subjective outcome, which is directly measurable at the end of the CA program. In contrast, the variables sales, follow-up funding, attractiveness for employees, and success of the startup cannot be measured directly after the program, but after a certain time. These variables are combined in the objective outcome.
Hypotheses
The following hypotheses covering the intention to participate in a CA program are based on the review of different qualitative papers covering the benefits of such programs for startups (Cohen & Hochberg, 2014; Kohler, 2016; Weiblen, 2015).
The first hypothesis relates expectations towards a CA program with obtained learning. H1: Expectations about learning positively influence the participants’ perceived
learning. Such that,
H1 a: Higher expectations about Product improvements increase learning related to the Product.
H1 b: Higher expectations about Market improvements increase learning related to the Market.
H1 c: Higher expectations about Team improvements increase learning related to the Team.
Despite the direct effect of expectations on learning addressed in H1, the startup possibly draws learning in all areas. The therefore arising hypothesis about the cross-impact is formulated as follows.
H2: There is a positive cross-impact between the expectations in a specific area and the learning experience in another area.
Due to the fact that CA programs are designed to accelerate learning by providing various means, the author formulates the following hypotheses on the learning experience during the program (Kohler, 2016).
H3: The perceived satisfaction of the CA program is positively influenced by the learning in
H3 a: the Product area. H3 b: the Market area. H3 c: the Team area.
Considering Kohler (2016) and Hathaway (2016), CA programs positively impact the situation and the development of alumni startups after the program. Consequently, the following hypothesis is formulated.
H4: An increase in the subjective outcome positively influences the objective outcome.
However, the literature review raises questions about possible downsides of CA programs due to an overprotected artificial environment in which only limited feedback is possible and
restrictions in engaging with other companies exist. These concerns regarding CA programs are harmful for the startups’ development and reflected in the following hypothesis (Clegg, Minshall, Mortara, Elia, & Probert, 2008; Doz, 1987; Dushnitsky & Lenox, 2005; Isabelle, 2013; Park & Steensma, 2012; Weiblen, 2015).
4. Methodology and Data Collection
4.1 Research Model
The author conducted an online survey on Qualtrics since this format has several advantages for participants and the author himself. The Qualtrics web platform offers the possibility to generate a survey link, which can be used throughout the entire contacting process via email and LinkedIn. Therefore, a large audience can be reached at very low administration costs and in a manageable time. The selected process is efficient and effective. Additionally, survey participants benefit from the flexibility and convenience in accessing the survey. There is no certain time frame in which the survey has to be completed. Evans and Mathur (2005) highlight the significant advantages of online surveys and additionally mention the “ease of data entry and analysis” (p. 197) and the flexibility in setting up the survey to match the researchers needs.
4.2 Sampling
The sampling follows a non-probability approach based on convenience sampling, since the data can be obtained in a short period of time at low costs (Kothari, 2004). Moreover, convenience sampling is used since the research questions address alumni startups of CA programs in Germany. The survey covers three parts, the expectations towards a CA program, the learning throughout such a program, the overall experience and the program’s impact on the period after the program. Therefore, only startups that already completed the program are considered. The names of the alumni startups of the considered CA programs where obtained via consulting the German accelerator programs’ web pages. Appendix I can be reviewed for further information regarding the programs and startups.
4.3 Research Instruments
After setting up the survey in Qualtrics, a link to the study was sent to alumni startups. Participants were contacted via email and LinkedIn (see Appendix II). The study was conducted anonymously to limit the risk that alumni startups do not want to share their experience if they have to fill in their name and the program’s name. Conducting an
anonymous survey did not limit the author in his analysis and seemed an appropriate method to serve the participants’ rights and needs.
Pilot Study
The survey was pretested to ensure that questions were understood, the time to complete the survey was within an appropriate range as well as the content supported the survey’s flow and the right thematic issues were addressed. A former participant in several CA programs was willing to do the pilot study. In the first Skype conversation, he was asked about his experience within CA programs in general. At the beginning, no specific issues addressed in the author’s study were mentioned. Hereby, the author avoided a biased conversation about CAs and ensured that the interviewee highlighted the most important points from his point of view. Considering this input, the survey was adjusted. In the second Skype conversation, the survey was again presented to receive feedback from an alumnus of several CA programs. Based on the feedback, the final version was developed. This participant was only contacted for the pilot study and did not take part in the main study.
Main Study
An introductory email was sent to more than 1200 people working for alumni startups and, additionally, more than 1000 people were contacted via LinkedIn (see Appendix I and
Appendix II). All contacted people were mainly founders and co-founders working for
startups, which participated in a German accelerator program. Throughout the main study, a total of 153 responses were collected and 58 participants fully completed the online survey. A high dropout rate, in this study of 62%, is not uncommon for online and self-administered surveys since motivating the targeted audience to totally complete an online survey is rather difficult (Reips, 2002). However, the sample size is sufficiently large to proceed.
4.4 Design and Procedure
The data was collected between the 29th of March and the 3rd of May 2017. The survey was divided in three parts covering the alumni startups’ expectations towards the CA program, the learning throughout the program, the overall perception of the program and the influence on the startups’ subsequent development.
At the beginning of the survey, participants were welcomed and informed about the research purpose. Moreover, they were assured that responses are kept confidential, anonymous and
are only used for study purposes. In the first section, participants were asked about their intention to participate in the CA program. Different aspects covering the three areas product, market and team were included to be rated based on their importance in applying for the CA program. In the second section, the learning throughout the program was prompted. Participants were asked how the exact same factors included in the first section have improved. The third and last section aimed to shed light on the startup’s overall perception of the CA program and on the program’s influence on the startup’s subsequent development. A demographic question at the end of the survey was included to understand in which countries the startups had their headquarters. Finally, startups were thanked for their participation in the survey.
4.5 Variable Descriptions
All independent and dependent variables included in the Qualtrics online survey were measured on a seven-point Likert scale containing 1 = “strongly agree”, 2 = “agree“, 3 = “somewhat agree”, 4 = “neither nor”, 5 = “somewhat disagree”, 6 = “disagree” and 7 “strongly disagree”. The complete survey can be found in the Appendix III.
In the subsequent section, the subjective outcome variables, objective outcome variables and the expectations and learning variables are presented. The investors’ decision-making criteria literature was reviewed to select relevant variables for the study. Csaszar et al. (2006), Maxwell et al. (2011) and Carpentier and Suret (2015) analyze which criteria are used by different investor groups to select promising startups. The highlighted criteria in the literature is adapted and integrated into the survey. Herewith, it is ensured that in the presented study about CA programs only relevant criteria for a startup’s success is analyzed.
Subjective Outcome Variables
The following variables were included to measure the program’s subjective outcome directly at the end of the CA program.
Satisfaction, was assessed by asking participants about their satisfaction with the outcome of
the CA program.
Learning experience, was assessed by asking participants about their learning experience in a
Objective Outcome Variables
The following variables were included to measure the program’s objective outcome reflecting the long-term impact of the CA program.
Venture success, was assessed by asking participants about the CA program’s impact on the
venture success.
Sales, was assessed by asking participants about an increase in sales due to the program. Follow-up funding, was assessed by asking participants about their possibilities to receive
follow-up funding due to the program.
Employeer’s attractiveness, was assessed by asking participants about the possibility to attract
better employees due to the program.
Expectations towards the Corporate Accelerator Program and Learning
The variables of the first two parts of the survey, covering the expectations before and the learning throughout a CA program, are identical. The criteria are subdivided into the three areas product, market and team. Firstly, each criteria covers the intention to apply for the CA program and thus expectations towards the program. Secondly, each criteria covers the achieved improvements during the CA program and thus learning throughout the program. Product
Customer benefit, was assessed by asking participants about the substantial benefit, which
their product creates for customers.
Market needs, was assessed by asking participants about the readiness of their product for
market needs.
Competitive advantage, was assessed by asking participants about the competitive advantage
of their product compared to competitors.
Degree of innovation, was assessed by asking participants how innovative their product is. Easiness of adoption, was assessed by asking participants about how easily their product can
be adopted by customers.
Market
Identification target group, was assessed by asking participants about the identification of the
right target group.
Contact target group, was assessed by asking participants about the easiness to get in touch
with their target group.
Customer needs, was assessed by asking participants about the product’s alignment with
customer needs.
Marketing plan, was assessed by asking participants about the realism of their marketing plan. Market potential, was assessed by asking participants about the market potential for their
product or service.
Supply and distribution channels, was assessed by asking participants about the development
of their supply and distribution channels.
Linkages target market, was assessed by asking participants about the development of their
linkages to the target market. Team
Business expertise, was assessed by asking participants about their business expertise.
Business network, was assessed by asking participants about the development of a valuable
business network.
Passion, was assessed by asking participants about their level of passion for their business
model.
Technical know-how, was assessed by asking participants about their technical know-how to
implement their business model.
Pitching skills, was assessed by asking participants about their pitching skills to promote their
business model.
Mentor coaching, was assessed by asking participants about the valuable coaching by
mentors.
Learning in groups, was assessed by asking participants about the benefit of learning in
Looking back at the Corporate Accelerator Program
Crichton (2014), Weiblen and Chesbrough (2015) and Isabelle (2013) refer to negative effects of CA programs on startups. To draw quantitative conclusions, different aspects addressing the overall experience during the program and the program’s impact on a startup’s situation after the program are included.
During the program
Competing products, was assessed by asking participants about the development of products
competing with the products of the corporation sponsoring the CA.
Benefits sponsoring corporation, was assessed by asking participants about the benefits of a
CA for the sponsoring corporation.
Target markets, was assessed by asking participants about the requirement that the target
markets of the corporation and the startup have to match so that the program is beneficial for the participants.
Entrepreneurial mind, was assessed by asking participants about the harmfulness of the
program for the entrepreneurial mind.
Artificial environment, was assessed by asking participants about the CA program providing
an artificial environment without free market competition.
Overprotection, was assessed by asking participants about being overprotected in a CA
program.
Limitations, was assessed by asking participants about the possibility to receive broad product
feedback when advisors and mentors in a CA program come from one single orientation.
Internal competition, was assessed by asking participants about the competition between
participants within a CA program.
Quality uncertainty, was assessed by asking participants about the uncertainty at the
beginning of the program regarding the quality of a CA program and its outcome. After the program
Competitors engagement, was assessed by asking participants about the engagement of
competitors of the sponsoring corporation with alumni startups of the CA program.
Ties corporate accelerator, was assessed by asking participants about the persistence of the
Ties network, was assessed by asking participants about the persistence of the ties between the
startup and the CA’s network.
Ties participants, was assessed by asking participants about the persistence of the ties
between the participants of the CA.
Momentum, was assessed by asking participants about losing valuable momentum when the
program ends.
Alumni network, was assessed by asking participants about the effort CAs put into a vital
5. Analysis and Results
5.1 Sample Characterization
Descriptive statistical analyses were conducted to understand the sample characteristics. Despite the fact that only alumni startups, which participated in a German CA program were questioned, the participating startups’ headquarters were located in 13 different countries. 96.6 % of the participants’ headquarters are located in Europe and 3.4 % in the United States. However, 35 of the 58 participants’ headquarters are located in Germany. 81 % of the participants agreed that the CA program had a positive impact on their venture’s success. The same number of participants, 47, agreed to be satisfied with the program.
5.2 Model Assumptions
The author used structural equation modeling to test the hypotheses. Namely, he applied a partial least squares (PLS) model using the Smart PLS software, version 3.2.6 (Ringle, Wende, & Will, 2005). PLS uses an interactive estimation procedure to obtain regression coefficients. Compared to covariance-based programs, the sample size of 58 observations is normally not a problem in PLS. In addition to the small sample size, PLS allows constructing the model without knowing the exact relations of the latent variables. Therefore, possible relations between latent variables can be explored in a way, which is not possible in covariance-based ordinary least squares (OLS) regressions (Hulland, 1999).
Hulland (1999) points to key assumptions which need to be fulfilled to proceed with a PLS. Therefore, individual item reliability, convergent validity and discriminant validity are assessed.
Individual Item Reliability
To check for individual item reliability, the constructed nine latent variables reflecting the different areas of the survey (see Chapter 4.5 Variable Descriptions) were analyzed. The author used the Cronbach’s Alpha to construct the following variables: Product_expectations,
Market_expectations, Team_expectations, Product_learning, Market_learning, Team_learning, Downsides, Subjective_outcome and Objective_outcome. This approach
Alpha (higher than 0.8) is evidence for a good fit of the latent variable (Bagozzi, 1980). If deleting an item lead to an increase in the Cronbach’s Alpha, the item was excluded from the latent variable. The following tables show how each latent variable was constructed to ensure a high Cronbach’s Alpha.
Product Expectations
The variable Competitive_advantage_E was excluded from the latent variable
Product_expectations due to a low item correlation (0.379). Cronbach’s Alpha slightly
increased from 0.848 to 0.850 (Table 1). Hereby, the number of included variables in the latent variable Product_expectations was reduced from six to five.
Table 1: Cronbach’s Alpha Product Expectations
Corrected Item-Total Correlation Cronbach's Alpha if Item Deleted Customer_benefit_E 0.756 0.798 Market_needs_E 0.689 0.813 Competitive_advantage_E 0.479 0.850 Degree_of_innovation_E 0.602 0.829 Easiness_of_adoption_E 0.552 0.837 Quality_level_E 0.719 0.804 Market Expectations
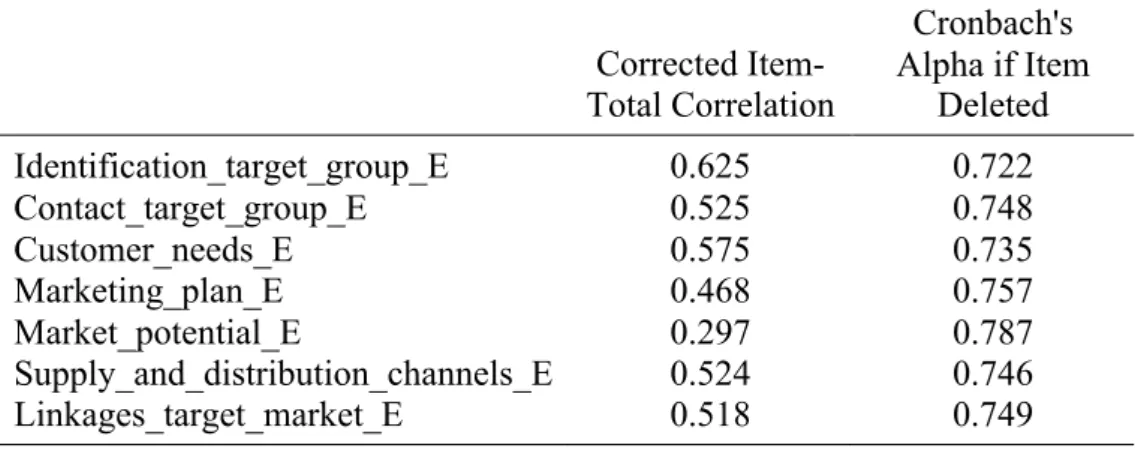
With seven included variables the latent variable Market_expectations had a Cronbach’s Alpha of 0.778. By deleting the very low correlated variable Market_potential_E the Cronbach’s Alpha slightly increased to 0.787 (Table 2) and the latent variable
Market_expectations contained six variables.
Table 2: Cronbach's Alpha Market Expectations
Corrected Item-Total Correlation Cronbach's Alpha if Item Deleted Identification_target_group_E 0.625 0.722 Contact_target_group_E 0.525 0.748 Customer_needs_E 0.575 0.735 Marketing_plan_E 0.468 0.757 Market_potential_E 0.297 0.787 Supply_and_distribution_channels_E 0.524 0.746 Linkages_target_market_E 0.518 0.749
Team Expectations
It was not possible to improve the latent variable Team_expectations’s Cronbach’s Alpha of 0.848 by deleting any item. Therefore, the variables Business_expertise_E,
Business_network_E, Passion_E, Technical_know_how_E, Pitching_skills_E, Mentor_coaching_E and Learning_in_groups_E were included in the latent variable Team_expectations.
Product Learning
It was not possible to improve the latent variable Product_learning’s Cronbach’s Alpha of 0.935 by deleting any item. Therefore the variables Customer_benefit_L, Market_needs_L,
Competitive_advantage_L, Degree_of_innovation_L, Easiness_of_adoption_L and
Quality_level_L were included in the latent variable Product_learning.
Market Learning
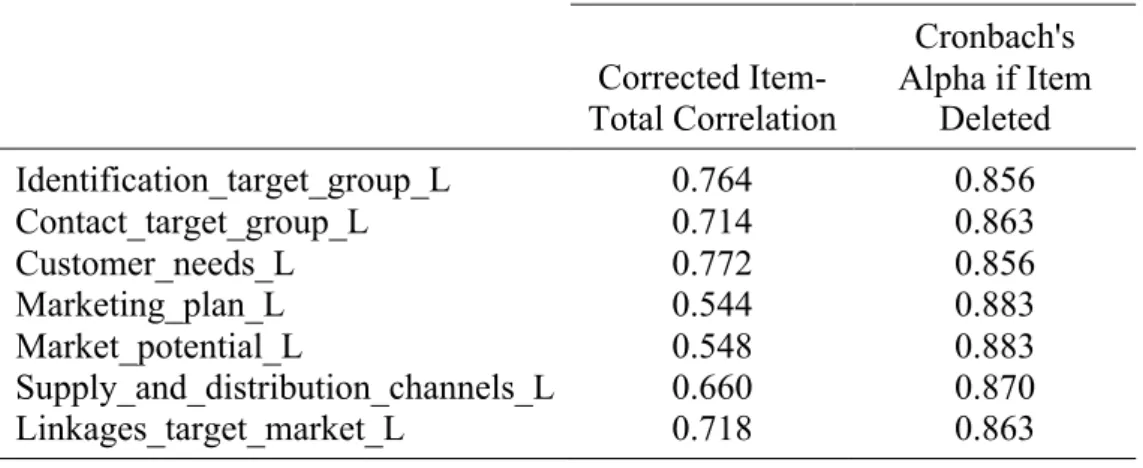
With seven included variables the latent variable Market_expectations had a Cronbach’s Alpha of 0.725. By deleting the variables Marketing_plan_L and Market_potential_L the Cronbach’s Alpha increased to 0.883 (Table 3) and the latent variable Market_learning contained five variables.
Table 3: Cronbach's Alpha Market Learning
Corrected Item-Total Correlation Cronbach's Alpha if Item Deleted Identification_target_group_L 0.764 0.856 Contact_target_group_L 0.714 0.863 Customer_needs_L 0.772 0.856 Marketing_plan_L 0.544 0.883 Market_potential_L 0.548 0.883 Supply_and_distribution_channels_L 0.660 0.870 Linkages_target_market_L 0.718 0.863 Team Learning
It was not possible to improve the latent variable Team_learning’s Cronbach’s Alpha of 0.902 with seven items by deleting any item. Therefore, the variables Business_expertise_L,
Business_network_L, Passion_L, Technical_know_how_L, Pitching_skills_L, Mentor_coaching_L and Learning_in_groups_L were included in the latent variable Team_learning.
Subjective Outcome
It was not possible to improve the latent variable Subjective_outcome’s Cronbach’s Alpha of 0.634 with two items. Therefore, the variables Satisfaction and Learning_experience were included in the latent variable Subjective_outcome.
Objective Outcome
It was not possible to improve the latent variable Objective_outcome’s Cronbach’s Alpha of 0.816 with four items by deleting an item. Therefore, the variables Venture_success, Sales,
Follow_up_funding and Employer’s_attractiveness were included in the latent variable Objective_outcome.
Downsides
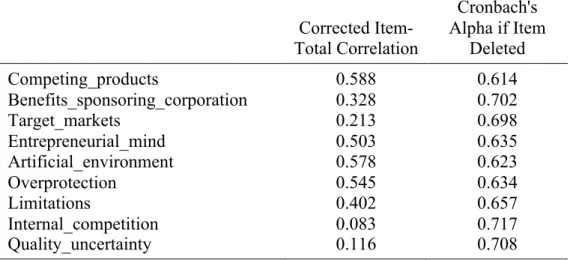
With nine included variables the latent variable Downsides had a Cronbach’s Alpha of 0.691. By deleting the variables Internal_competition, Quality_uncertainty, Target_market and
Benefit_sponsoring_corporation the Cronbach’s Alpha increased to 0.767 (Table 4) and the
latent variable Downsides contained five variables.
Table 4: Cronbach's Alpha Downsides
Corrected Item-Total Correlation Cronbach's Alpha if Item Deleted Competing_products 0.588 0.614 Benefits_sponsoring_corporation 0.328 0.702 Target_markets 0.213 0.698 Entrepreneurial_mind 0.503 0.635 Artificial_environment 0.578 0.623 Overprotection 0.545 0.634 Limitations 0.402 0.657 Internal_competition 0.083 0.717 Quality_uncertainty 0.116 0.708 Convergent Validity
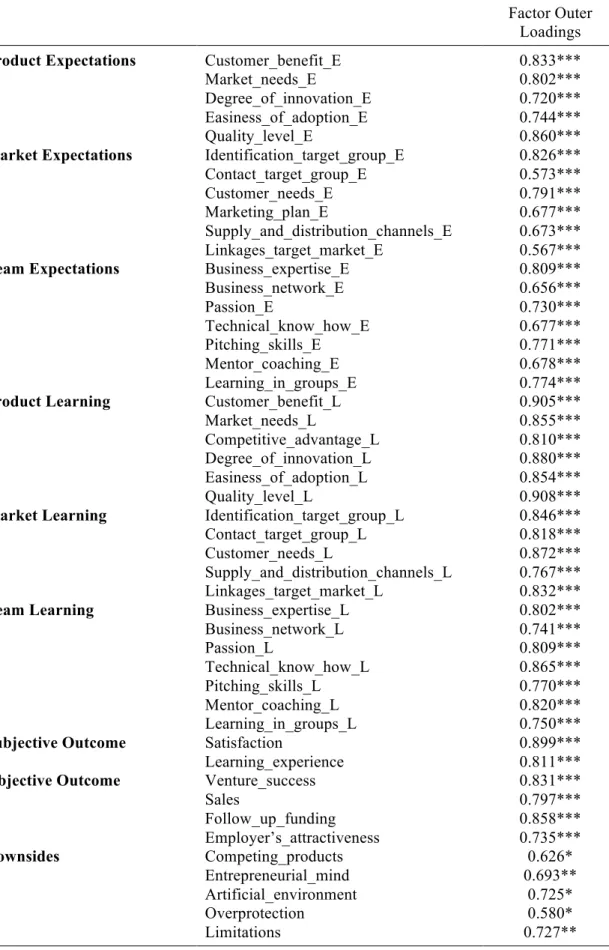
Following Costa, Lages, and Hortinha (2015) the Cronbach’s Alpha and construct reliability coefficients are evidence for convergent validity. Hereby, factor loadings (Bagozzi, 1980) and the average variance extracted (Fornell & Larcker, 1981) are analyzed (Table 5 and Table 6). As highlighted in Table 5, all outer factor loadings are significant and greater than 0.50.
Table 5: Factor Outer Loadings
Factor Outer Loadings
Product Expectations Customer_benefit_E 0.833***
Market_needs_E 0.802***
Degree_of_innovation_E 0.720***
Easiness_of_adoption_E 0.744***
Quality_level_E 0.860***
Market Expectations Identification_target_group_E 0.826***
Contact_target_group_E 0.573***
Customer_needs_E 0.791***
Marketing_plan_E 0.677***
Supply_and_distribution_channels_E 0.673***
Linkages_target_market_E 0.567***
Team Expectations Business_expertise_E 0.809***
Business_network_E 0.656*** Passion_E 0.730*** Technical_know_how_E 0.677*** Pitching_skills_E 0.771*** Mentor_coaching_E 0.678*** Learning_in_groups_E 0.774***
Product Learning Customer_benefit_L 0.905***
Market_needs_L 0.855***
Competitive_advantage_L 0.810***
Degree_of_innovation_L 0.880***
Easiness_of_adoption_L 0.854***
Quality_level_L 0.908***
Market Learning Identification_target_group_L 0.846***
Contact_target_group_L 0.818***
Customer_needs_L 0.872***
Supply_and_distribution_channels_L 0.767***
Linkages_target_market_L 0.832***
Team Learning Business_expertise_L 0.802***
Business_network_L 0.741*** Passion_L 0.809*** Technical_know_how_L 0.865*** Pitching_skills_L 0.770*** Mentor_coaching_L 0.820*** Learning_in_groups_L 0.750***
Subjective Outcome Satisfaction 0.899***
Learning_experience 0.811***
Objective Outcome Venture_success 0.831***
Sales 0.797*** Follow_up_funding 0.858*** Employer’s_attractiveness 0.735*** Downsides Competing_products 0.626* Entrepreneurial_mind 0.693** Artificial_environment 0.725* Overprotection 0.580* Limitations 0.727** ***p<.001, **p<.01, *p<.05
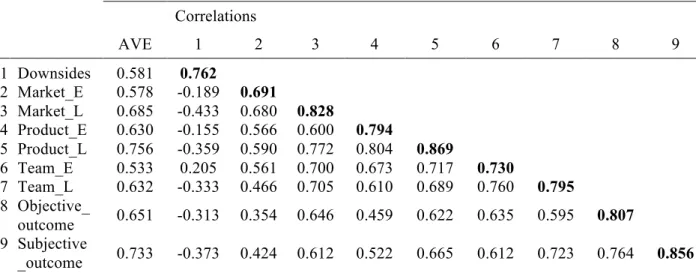
As shown in Table 6 the average variance extracted (AVE) of each latent variable is above 0.5 (Fornell & Larcker, 1981). Hence, convergent validity is proven.
Table 6: Average Variance Extracted and Correlations
Correlations AVE 1 2 3 4 5 6 7 8 9 1 Downsides 0.581 0.762 2 Market_E 0.578 -0.189 0.691 3 Market_L 0.685 -0.433 0.680 0.828 4 Product_E 0.630 -0.155 0.566 0.600 0.794 5 Product_L 0.756 -0.359 0.590 0.772 0.804 0.869 6 Team_E 0.533 0.205 0.561 0.700 0.673 0.717 0.730 7 Team_L 0.632 -0.333 0.466 0.705 0.610 0.689 0.760 0.795 8 Objective_ outcome 0.651 -0.313 0.354 0.646 0.459 0.622 0.635 0.595 0.807 9 Subjective _outcome 0.733 -0.373 0.424 0.612 0.522 0.665 0.612 0.723 0.764 0.856
All values for AVE significant at p<.001.
The bold diagonal values show the square root of the average variance extracted.
Discriminant Validity
To evaluate discriminant validity, the correlation between each pair of latent variables is compared to the root of the average value extracted among the pair in Table 6 (Fornell & Larcker, 1981). Therefore, it is ensured that two latent variables which should not be correlated are indeed not correlated (Carlson & Herdman, 2012). Finally, cross-loadings between the variables and the latent variables were retrieved to show that variables load higher on their latent variable than on any other latent variable (Chin, 1998). As seen in Table
6, the computed root of AVE between all latent variables is higher than the corresponding
correlations with the latent variable. Therefore, discriminant validity is proven (Costa et al., 2015).
5.3 Main Results
Since all necessary assumptions were fulfilled, Model 1 was run in the smart PLS software and results are presented in the following section.
Impact of Expectations on Learning
To validate the first hypothesis, Table 7 containing path coefficients between the latent variables and standard deviations was computed.
Table 7: Path Coefficients Hypothesis 1
Path coefficient Stdv Product_E à Product_L 0.545*** 0.094 Market_E à Market_L 0.392*** 0.108 Team_E à Team_L 0.755*** 0.084 ***p<.001, **p<.01, *p<.05
H1a proposed that higher expectations about product development in the CA program positively impact the learning throughout the program in that area. In order to test the hypothesis, the path coefficient showing the impact of the latent variable
Product_expectations on Product_learning was computed (Table 7). As expected, the path
coefficient had a positive and significant value of β=0.545 (p<.001) and highlighted the positive impact. Consequently, H1a was accepted at a significance level of 1%.
In order to test H1b, stating that increasing expectations in the market area positively impact learning in the market area the path coefficient connecting the latent variables
Market_expectations and Market_learning was computed (Table 7). The path coefficient was
positive and significant (β=0.392, p<.001). Thus, findings supported the hypothesis that higher expectations about the market development positively influence learning in the market area. H1b was accepted at a significance level of 1%.
To test H1c, addressing that higher expectations in the team area lead to higher learning in the team area, the same logic was applied (Table 7). The path coefficient between the latent variable Team_expectations and Team_learning was β=0.755 (p<.001) and outlined a positive, significant impact of expectations about personal learning for the team itself on
actual learning. Therefore, H1c was accepted at a significance level of 1%. Overall, the first hypothesis was accepted at a significance level of 1%.
In order to test the second hypothesis stating that expectations in the different areas product, market and team positively cross-impact the learning in the areas product, market and team, the relevant path coefficients were computed and significance tests were applied (Table 8). Results showed the path coefficients between the latent variables Product_expectations and
Market_learning (β=0.101, p>.05), Product_expectations and Team_learning (β=0.113,
p>.05), Market_expectations and Product_learning (β=0.124, p>.05), Market_expectations and Team_learning (β=-0.012, p>.05), Team_expectations and Product_learning (β=0.281, p<.01) and Team_expectations and Market_learning (β=0.413, p<.001). However, only the impact of the expectations in the team area on the learning in the product area and the market area were significant. Hence, expected learning about the personal development of the participant had a cross-impact on achieved learning in product and market development. Overall, the second hypothesis was partially accepted since two positive and significant cross-impacts were found (Table 8).
Table 8: Path Coefficients Hypothesis 2
Path coefficient Stdv Product_E à Market_L 0.101 0.140 Product_E à Team_L 0.113 0.115 Market_E à Product_L 0.124 0.093 Market_E à Team_L -0.021 0.138 Team_E à Product_L 0.281** 0.094 Team_E à Market_L 0.413*** 0.108 ***p<.001, **p<.01, *p<.05
Impact of Learning on Subjective Outcome
In order to validate the third hypothesis, stating that increased learning in the different areas positively influences the subjective outcome of the CA program, the three subparts were tested (Table 9).
Table 9: Path Coefficients Hypothesis 3 Path coefficient Stdv Product_L à Subjective_outcome 0.296* 0.152 Market_L à Subjective_outcome -0.009 0.149 Team_L à Subjective_outcome 0.490*** 0.147 ***p<.001, **p<.01, *p<.05
H3a refers to the impact of learning in the product area on the subjective outcome. The latent variable Subjective_outcome included the variables Satisfaction and Learning_experience. The value of the path coefficient between Product_learning and Subjective_outcome was positive and significant (β =0.296, p<.05). This confirmed that the learning which a new venture gained related to the product, positively affected the subjective evaluation of the program’s outcome (Table 9). H3a was accepted at a significance level of 5%.
H3b was tested in order to validate if what new ventures reported as learning in the market had an impact on how the program is assessed (Table 9). Results showed that the path coefficient between the latent variables Market_learning and Subjective_outcome was non-significant (β= -0.009, p>0.05). Therefore, it was not possible to prove that market learning positively affects the subjective evaluation. H3b was not accepted.
To test H3c, stating that the learning in the team area had a positive impact on the subjective outcome, the path coefficient between the latent variables Team_learning and
Subjective_outcome was retrieved (Table 9). The path coefficient had a positive and
significant value of 0.490 (p<.001). It proved that the perceived personal development of the participants positively influenced the subjective evaluation. Consequently, H3c was accepted at a significance level of 1%. Since only H3a and H3c were significant (p<.05 and p<.001), the third hypothesis was partially accepted.
Impact of Subjective on Objective Outcome
In order to validate the fourth hypothesis stating that satisfaction and overall learning in the CA (Subjective_outcome) had a positive impact on later, further venture development, the path coefficient between the latent variable Subjective_outcome and Objective_outcome was computed (Table 10). The positive and significant path coefficient of β = 0.764 (p<.001) proofed that a positive subjective evaluation at the end of the CA program positively impacts the long-term objective evaluation. Therefore, the fourth hypothesis was accepted at a significance level of 1%.
Table 10: Path Coefficients Hypothesis 4 Path coefficient Stdv Subjective_outcome à Objective_outcome 0.764*** 0.053 ***p<.001, **p<.01, *p<.05
Impact of Downsides on Learning
The fifth hypothesis states that downsides negatively impact the subjective outcome. For validation, the path coefficient between the latent variable Downsides and
Subjective_outcome was computed (Table 11).
Table 11: Path Coefficients Hypothesis 5
Path
coefficient Stdv Downsides à Subjective_outcome -0.108 0.130
***p<.001, **p<.01, *p<.05
No significant result was obtained (β = -0.108, p>.05) and therefore the fifth hypothesis was not accepted.
5.4 Further Analysis
CAs help startups to build a lasting network since startups get in contact with the sponsoring entity’s existing network (Becker & Gassmann, 2006; Kanbach & Stubner, 2016; Kohler, 2016). Further, Becker and Gassmann (2006) emphasize that in contrast to the past focus on tangible resources such as funding, nowadays, intangible resources including networks to contact possible customers and suppliers considerably gained importance.
To quantify the effect of a lasting network, the three variables Ties_corporate_accelerator,
Ties_network and Ties_participants were included in the survey to evaluate if strong ties
between the participants and the CA itself, the participants and the CA’s network and the participants themselves persisted after the program’s end (see Chapter 4.5 Variable
Descriptions).
Additional analysis on networking was conducted in order to understand how the introduced latent variable Network impacts Objective_outcome. The latent variable Network was