Jose{ L.F.C. Lima · Anto{nio O.S.S. Rangel M. Renata S. Souto
Flow injection system with gas diffusion for the sequential
determination of total nitrogen and phosphorus in vegetables
Abstract A flow injection system was developed for the sequential determination of total nitrogen and phos-phorus in digests of vegetables using potentiometric and spectrophotometric detection systems, respect-ively. A tubular ammonium selective electrode with a sensor system composed of nonactin/monactin in tris(2-ethylhexyl) phosphate was used. The selectivity limitations of this electrode were overcome by the in-clusion of a gas-diffusion unit in the system that separ-ated ammonium from the rest of the sample matrix and allowed the determination of total nitrogen and phos-phorus by the partition of the sample plug between two streams.
The results obtained with the developed FIA system were in good agreement with those of the reference methods. Sampling rates from 40 to 60 samples per hour and relative standard deviations below 3.5% were achieved.
Introduction
Nitrogen and phosphorus are essential elements for plant growth. Modern intensive agriculture relies con-siderably on the use of commercial fertilisers to supply soils with these nutrients. Therefore, quantification of both elements in plant materials (as well as soils and water samples) is important routine analysis performed in agricultural and environmental research laboratories.
J.L.F.C. Lima
CEQUP/Departamento de Quı´mica-Fı´sica,
Faculdade de Farma´cia, Rua Anı´bal Cunha 164, P-4050 Porto, Portugal
A.O.S.S. Rangel ( ) · M.R.S. Souto
Escola Superior de Biotecnologia, Universidade Cato´lica Portuguesa, Rua Dr. Anto´nio Bernardino de Almeida, P-4200 Porto, Portugal
Nitrogen determination in plants [1] is carried out in acid digests by distillation/titration procedures or by colorimetric methodologies (Berthelot reaction). Potentiometric ammonia gas sensors (with a gas-per-meable membrane or an air-gap) have also been used [2, 3]. All these methodologies are time-consuming and troublesome.
Regarding phosphorus analysis, quantification is also accomplished after acid digestion of plant organic matter by colorimetric measurements. The molyb-denum blue method [1] is widely employed for this determination and is also a laborious procedure.
A significant improvement was achieved by the development of automatic methods for these deter-minations providing higher sampling rates and precise control of the reaction parameters. Continuous flow systems with colorimetric [4—6], potentiometric (air-gap electrode) [6] and conductimetric [7] detection systems were used for the quantification of nitrogen in plants (including vegetable tissues). For phosphorus determinations in plant and water samples, several flow manifolds with spectrophotometric detection were used [8—11]. A flow injection manifold using sample split-ting and a single spectrophotometer [12] was later described for the simultaneous determination of the analytes. This system relied on precise sample splitting to attain good reproducibility for both determinations which was assured by using a long splitting delay coil before the sample splitting point.
In this work a flow injection analysis system is de-scribed for the sequential determination of total nitro-gen and phosphorus in digests of vegetables using potentiometric and spectrophotometric detection sys-tems, respectively. A gas-diffusion unit was included in the system to overcome the selectivity limitations of the electrode and divide the sample plug between a donor and a acceptor stream in a reproducible manner. Total nitrogen determinations were performed in the accep-tor stream while phosphorus quantifications were car-ried out in the donor stream by the molybdenum blue
method, after concentration adjustments to fit the sample analyte content to the requirements of the detection system.
The potentiometric determination of nitrogen (am-monium form) was chosen instead of the spectro-photometric detection as it requires simpler sample chemical treatment and enables determinations in a much wider linear concentration range. As indicator electrode a tubular ammonium selective electrode with-out inner reference solution and with a sensor system composed of a mixture of nonactin/monactin in tris (2-ethylhexyl) phosphate immobilised in PVC was used [13, 14]. The tubular configuration was selected be-cause of the ability to attach the unit solidly to the set-up, thus decreasing the electrical noise and also reducing dead volumes [15].
Experimental
Apparatus and flow injection system
For the potentiometric measurements, a Crison 2002 voltmeter ($0.1 mV sensitivity), a double junction Russel 90—0029 reference electrode, with Tris-HCl 0.01 mol/L (pH 7.5) in the outer compart-ment, and a tubular shaped ammonium ion-selective electrode were used.
The FIA determination of phosphate and the reference methods for both analytes were performed with a Hitachi 100—40 UV/Vis spectrophotometer. When working in a continuous mode the spec-trophotometer was equipped with a flow-through cell (Hellma type 178.711-QS, path length 10 mm, volume 30lL).
Both detectors were connected to a double-channel Kipp & Zonen BD 112 chart recorder for the simultaneous recording of the two analytical FIA signals. The flow-injection system comprised Gilson Minipuls 3 peristaltic pumps with propulsion tubes of the same brand, a Rheodyne Type 5020 six-port rotary injection valve, 0.8 mm i.d. PTFE tubing from Omnifit, Gilson end-fittings and connectors and perspex home-made Y-shaped joints used as conflu-ence or stream splitting points. Ground electrodes and perspex support devices for both reference and tubular shaped electrodes were constructed as reported elsewhere [16].
The home-made gas diffusion unit [17] consisted of two blocks of perspex forming a flow channel, 2 mm wide, 0.5 mm deep and 72 mm long (linear path). A gas-permeable membrane, commercial polytetrafluoro ethylene (PTFE) tape, was placed between the two blocks.
Tubular electrode construction
The sensor membrane was prepared as follows: 0.014 g of am-monium ionophore (Fluka), containing 75% of nonactin and 25% of monactin, was dissolved in 0.51 g of tris (2-ethylhexyl) phosphate (Fluka) using an ultrasonic bath to promote complete dissolution of the sensor in the mediator solvent. A solution of 0.16 g of PVC dissolved in 6 mL of tetrahydrofuran was subsequently added and the mixture stirred to obtain a clear solution. Tubular shaped electrodes without inner reference solution were then prepared using this solution according to procedures described earlier [16, 18]. Once the application of the sensor membrane was completed, the electrodes were left to dry at room temperature for one day and later conditioned overnight in a 0.1 mol/L ammonium sulphate solution (by circulation of this solution in the flow system at a low flow-rate).
When not in use, electrodes were stored in contact with a 10~3 mol/L ammonium solution.
Reagents and solutions
Deionized water with a specific conductance lower than 0.1lS/cm, and analytical reagent grade chemicals were used.
Ammonium (0.20 mol/L) and phosphate (0.016 mol/L) stock solutions were prepared in 1 mol/L sulphuric acid by precise weigh-ing of previously dried (at 100 °C) solid ammonium sulphate and potassium dihydrogen phosphate. Standards used to establish the FIA calibration curves (4.0]10~3—8.2]10~2 mol/L in NH`4 and 3.4]10~4—2.4]10~3 mol/L in PO3~4 ) were obtained by dilution of these stock solutions in 1 mol/L sulphuric acid.
The buffer solution, 0.01 mol/L Tris-HCl, was prepared by mixing 200 mL of 0.1 mol/L tris (hydroxymethyl) aminomethane with 160 mL of 0.1 mol/L HCl and making the volume up to 2 litres with deionized water (final pH of about 7.5).
For the colorimetric determination of phosphate, two reagent solutions were prepared: the reducing solution, consisting of a mix-ture of 0.153 g/L stannous chloride, 1.6 g/L hydrazine sulphate and 0.38 mol/L sulphuric acid; the molybdate reagent solution, consist-ing of 2.82 g/L ammonium heptamolybdate in 0.52 mol/L sulphuric acid.
As previous works [8, 9] reported, a baseline drift can occur in the phosphate determination (due to molybdenum blue deposits in the flow-cell walls); a 1 mol/L NH4Cl/NH3 solution was circulated in the phosphate sub-system after each working day as a precaution measure.
Preparation of the digest of vegetables
The samples of plant material were oven-dried (at 80—100 °C) and ground [19]. Digests of vegetables were then prepared by acid digestion (H2SO4-salicylic acid-H2O2 and selenium) [1] and the final volume brought to 50 mL with 0.8 mol/L sulphuric acid. Finally, the samples were filtered through Whatman N° 541 filter paper into polyethylene bottles and stored at 4 °C until use. The vegetable tissues analysed were lettuce, watercress, spinach, turnip sprout, turnip leaf and parsley.
Reference methods
Nitrogen quantification was based on the Berthelot reaction [1], in which a phenol derivate forms a coloured compound (indophenol dye) in the presence of ammonia and hypochlorite. The indophenol thus formed is measured at a wavelength of 660 nm.
The concentration of phosphorus was determined spectro-photometrically (at a wavelength of 400 nm) as the yellow phospho-vanado-molybdate complex [20] formed in acidic solution from the reaction of orthophosphate with ammonium molybdate and am-monium vanadate.
Results and discussion
Flow injection configuration
The flow diagram used is shown in Fig. 1.
Samples (or standards) are injected into a 0.8 mol/L H2SO4 carrier stream. A 2.5 mol/L hydroxide solution
Fig. 1 Flow diagram of the manifold developed for the simulta-neous determination of nitrogen and phosphorus in acid digests of vegetables: Pi"peristaltic pumps; Qi"flow-rates (Q1"3.0;
Q2"Q3"1.5; Q4"2.4; Q5"Q6"1.6 mL min~1); »i"injection
volume (180lL); ¸i"tube lengths (¸1"16; ¸2"50; ¸3"19; ¸4"13; ¸5"20; ¸6"22; ¸7"105; ¸8"200 cm); a, b and c"confluences; Ri"reagent solutions (R1"0.01 mol/L Tris-HCl pH 7.5, 1]10~6 mol/L NH`4; R2"0.8 mol/L H2SO4;
R3"2.5 mol/L NaOH; R4"2.82 g/L ammonium molybdate,
0.52 mol/L H2SO4; R5"0.153 g/L stannous chloride, 1.6 g/L hy-drazine sulphate, 0.38 mol/L H2SO4); GDº"gas-diffusion unit;
G"ground electrodes; ISE"tubular ammonium selective
elec-trode; RE"reference elecelec-trode;j"spectrophotometer (at 710 nm)
(R3) is then added in confluence a to convert am-monium to volatile ammonia. It diffuses across the gas-permeable membrane (GDº) and is reconverted to ammonium in contact with 0.01 mol/L Tris-HCl pH 7.5 buffer solution [21] (a 1]10~6 mol/L concentra-tion of ammonium was added for baseline stabilisa-tion), flowing in the acceptor stream. The total nitrogen determination is then carried out in the tubular am-monium electrode placed immediately after the gas-diffusion unit.
After a stream splitting (used to remove part of the sample creating the necessary overall dilution) and the addition of molybdate and stannous chloride solutions, the phosphate quantification was performed over the sample plug remaining in the donor stream. The deter-mination is based on the reaction between ortho-phosphate and ammonium molybdate to form a heteropolymolybdophosphoric acid compound, later reduced by stannous chloride to molybdenum blue (measured at 710 nm).
Optimisation studies
Several system parameters were tested in order to achieve a compromise between the sensitivity of the analytical measurements, the linear working range for both determinations and the sampling rate.
Flow parameters in the gas-diffusion unit. Based on a previous work concerning optimisation of flow injec-tion gas-diffusion systems [22], equal flow-rates for the donor and acceptor streams were used. Concurrent flow mode was adopted since it proved to be more effective than countercurrent flow. A flow-rate of 3.0 mL min~1 was selected as a settlement between the sampling rate and the sensitivity of the process. Injection volume. An injection volume of 180lL was selected. Higher injection volumes (220 and 280lL) produced only a slight increase of the magnitude of the potentiometric signals, and had the disadvantage of lowering the upper limit of linear response for the colorimetric phosphate determination. On the other hand, the use of lower injection volumes could lead to a decrease in the reproducibility of the potentiometric measurements.
Acid concentration of the standard solutions. Consider-ing that the acid concentration of the solutions injected into the system could affect the ammonia production and the colorimetric reaction, several assays were per-formed to establish the sulphuric acid concentration to be included in the standard solutions. Differences in the acid concentration of the final digests were expected since acid is consumed in the digestion process by distinct pathways. For this reason, the acidity of several digests of vegetables was determined by titration with a sodium hydroxide solution. Values between 0.80 and 1.1 mol/L in sulphuric acid were obtained. In order to study its influence, a set of standard solutions with sulphuric acid concentrations from 0 to 1.2 mol/L (0, 0.2, 0.4, 0.6, 0.8, 1.0, 1.1 and 1.2) were prepared. As expected, due to the excess of sodium hydroxide (2.5 mol/L) used, no changes of the analytical signals were observed for the ammonium determinations. For the phosphate measurements the absorbance decreased significantly up to 0.6 mol/L sulphuric acid concentra-tion (Fig. 2), remaining almost constant over the range of 0.6—1.2 mol/L. The H2SO4 concentration in the
Fig. 2 Variation of the absorbance with sulphuric acid concentra-tion for a phosphate concentraconcentra-tion of 250 mg/L
standard solutions was set to 1.0 mol/L as slight changes of the acid level had less influence on the absorbance.
Composition of the flowing solutions. As the sensitivity of the spectrophotometric phosphate determination is strongly dependent on the acidity of the medium, and considering the acidity of the digests, a 0.8 mol/L H2SO4 solution was used as carrier stream (R2). In these conditions a similar acidity of the plug (either from standards or digests) in the reactor (¸8) was assured.
The concentration of the sodium hydroxide solution (R3) was conditioned by the final acidity of the digests. The hydroxide concentration should be sufficient to increase the pH to a value that allowed quantitative conversion of ammonium into ammonia gas. Five NaOH solutions (2, 2.25, 2.5, 2.75 and 3 mol/L) were tested. The sensitivity of the potentiometric measure-ment increased up to 2.5 mol/L. As for higher sodium hydroxide concentrations no significant sensitivity cha-nges were observed, a 2.5 mol/L NaOH solution was selected.
The composition of the colour development solu-tions (R4 and R5) for the phosphate determination was then optimised. Based on the concentrations used in a previous work [9], R4 solutions with different am-monium heptamolybdate (2.82, 4.23 and 5.64 g/L) and sulphuric acid concentrations (between 0.26 and 1.04 mol/L) were studied. As reducing solution (R5) a 0.102 g/L stannous chloride solution, 1.6 g/L hy-drazine sulphate and 0.31 mol/L sulphuric acid was used. An increase in sensitivity and a decrease in the linear working range with increasing molybdate con-centration was observed. On the other hand, the sensi-tivity diminished with increasing acid concentrations. 2.82 g/L ammonium heptamolybdate with 0.52 mol/L H2SO4 (R4) was chosen as a compromise between sensitivity and the linear working range.
After setting the composition of the R4 reagent, a number of reducing solutions, with 1.6 g/L of hy-drazine sulphate and 0.31 mol/L of sulphuric acid, and
different stannous chloride levels (0.051, 0.076, 0.102, 0.153 and 0.204 g/L) were prepared. The selected con-centration was 0.153 g/L corresponding to maximum sensitivity. In order to study the acid concentration, solutions with different H2SO4 levels (0.15,0.23, 0.31, 0.38 and 0.46 mol/L) were tested. Maximum sensitivity and linearity over the needed concentration interval (3.4]10~4—2.4]10~3 mol/L PO3~4 ) was obtained for the 0.38 mol/L sulphuric acid.
¸ength of the colour development reactor. The choice of the reactor coiled length (¸8) was made according to the results obtained with coiled tubes of 100, 120, 150 and 200 cm. Although the best sensitivity was achieved in a 120 cm reactor, the 200 cm reactor was preferred because of the improved baseline stability and con-sidering that the sampling rate was not significantly affected.
Under the optimised conditions of the FIA system the lower limit of linear response and the practical detection limit for the ammonium determination were assessed according to recommended procedures [23]. Calibration curves from 7.6]10~5 to 1.1]10~1 mol/L were established and values of 3.3]10~3 mol/L (60 mg/L) for the lower limit of linear response and 1.4]10~3 mol/L (25 mg/L) for the practical detection limit were obtained.
The detection limit of the phosphate methodology, corresponding to three-times the standard deviation of the system background noise, was 4.3]10~5 mol/L (4.1 mg/L) of phosphate.
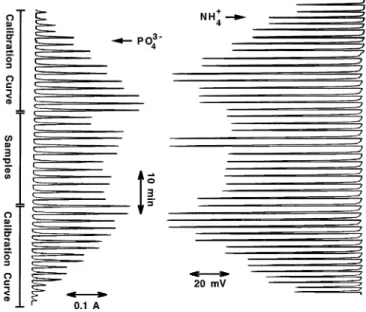
Fig. 3 Recorder output for the simultaneous determination of nitro-gen and phosphorus in digests of vegetables. The concentration of the injected standard solutions ranged from 72 to 1.4]103 mg of ammonium per litre and between 20 to 250 mg of phosphate per litre
Table 1 Comparison of the results obtained (expressed as mg of ammonium or phosphate per gram of dried sample) from the analysis of digests of vegetables by the developed FIA system (Cf) and by the reference methods (Cr). Relative standard deviations for the FIA methodology
Equation parameters (Cf"C0#SCr) Number of RSD (%)" samples analysed
C0(mg/g) S R!
Total nitrogen 1.7 ($3.6)# 0.979 ($0.054)# 0.986 30 (3.5 Phosphorus 0.5 ($0.7)# 0.973 ($0.033)# 0.994 30 (2.8 ! Correlation coefficient.
" Relative standard deviation obtained from 10 consecutive injections of sample digests.
# Confidence limits for the slope and intercept values, at the 90% significance level for 28 degrees of freedom, are indicated in parentheses after the respective values.
Analysis of the digests of vegetables
Thirty digests of vegetables were injected into the de-veloped flow injection manifold and the concentrations of total nitrogen and phosphorus were calculated by interpolation in the previously established calibration plots. Every standard and digest was injected in duplic-ate (Fig. 3). Concentration levels of 43 to 82 mg of ammonium per gram of dried vegetable sample (270—510 mg NH`4/L) and between 13 to 30 mg of phosphate per gram (87—220 mg PO3~4 /L) were found. In order to assess the accuracy of the FIA results (Cf), digests of vegetables were also analysed by refer-ence methods (Cr). For comparison purposes, a relation of the type Cf"C0#SCr was established (Table 1). There is a good agreement between the two methodolo-gies, as can be concluded by the slope and intercept values. Moreover, estimation of the confidence limits for these values at the 90% significance level [24] shows that there is no evidence for systematic differ-ences between the sets of results (Table 1). The precision of the FIA methodology was determined from ten con-secutive injections of three digests of vegetables, with concentrations covering the analytical range for each determination (Table 1). Relative standard deviations of 2.74, 2.85 and 1.71% were observed for samples with ammonium concentrations of 42.8, 64.0 and 82.0 mg/g, respectively. For samples with phosphate concentra-tions of 15.3, 20.3 and 27.5 mg/g the relative standard deviations found were 3.52, 2.51 and 1.53%.
A sampling rate of 40 to 60 samples per hour (corres-ponding to 80—120 determinations per hour) was achieved.
Conclusions
The developed FIA system has several advantages over the conventional manual reference procedures for the determinations of total nitrogen and phosphorus in vegetable samples as it allows simultaneous determina-tion of both analytes with automatic digests prep-aration (vegetable digests are introduced without treatment in the flow injection manifold), higher
samp-ling rates and increased simplicity. The flow injection methodology yields results comparable to those of con-ventional methods and shows good precision over the entire working range.
The results obtained in this work and the versatility of the flow injection systems allow to assume the ap-plicability of the developed flow injection manifold also to the simultaneous determination of total nitrogen and phosphorus in other materials, such as soils and water samples where the quantification of these ele-ments is also important.
Acknowledgements The authors gratefully acknowledge the finan-cial support granted by Junta Nacional de Investigaia8 o Cientı´fica e Tecnolo´gica (JNICT) through Project PEAM/C/TAI/259/93. One of us (M.R.S. Souto) was supported by a grant from JNICT (BD/2525/93-IF).
References
1. Walinga I, Van der Lee JJ, Houba VJG, van Vark W, Novozamsky I (1995) Plant Analysis Manual. Kluwer, Nether-lands, pp 1—4, 17—21
2. Nelson DW, Sommers LE (1980) J Assoc Off Anal Chem 63: 770—778
3. Deschreider AR, Meaux R (1973) Analusis 2:442—445 4. Keay J, Menage PMA (1969) Analyst 94:895—899 5. Crooke WM, Simpson WE (1971) J Sci Fd Agric 22:9—10 6. Stewart JWB, Ruzicka J, Bergamin Filho H, Zagatto EA (1976)
Anal Chim Acta 81:371—386
7. Pasquini C, Faria LC (1987) Anal Chim Acta 193:19—27 8. Ruzicka J, Stewart JWB (1975) Anal Chim Acta 79:79—91 9. Karlberg B, Pacey GE (1989) Flow Injection Analysis — A
Prac-tical Guide. Elsevier, New York, pp 156—162
10. Jacintho AO, Kronka EAM, Zaggato EAG, Arruda MAZ, Ferreira JR (1989) J Flow Injection Anal 6:19—29
11. Reis BF, Martelli PB, Krug, Tumang CA (1992) J Braz Chem Soc 3:38—42
12. Stewart JWB, Ruzicka J (1976) Anal Chim Acta 82:137—144 13. Scholer RP, Simon W (1970) Chimia 24:372—374
14. Simon W (1976) Science and Industry 8:1—6
15. Ferreira IMPLO, Lima JLFC (1993) J Flow Injection Anal 10: 17—32
16. Alegret S, Alonso J, Bartrolı´ J, Machado AASC, Lima JLFC, Paulı´s JM (1987) Quim Anal 6:278—292
17. Lima JLFC, Neves OBAO, Rangel AOSS (1994) In: Automatic Control of Food and Biological Processes. Elsevier, pp 67—74 18. Alegret S, Alonso J, Bartrolı´ J, Paulis JM, Lima JLFC,
19. Jones Jr JB, Wolf B, Mills HA (1991) Plant Analysis Handbook
— A Practical Sampling, Preparation, Analysis and
Interpreta-tion Guide. Micro-Macro Publishing, Georgia, pp 23—24 20. Ministry of Agriculture, Fisheries and Food (1986) The Analysis
of Agricultural Materials — A Manual of the Analytical Methods used by the Agricultural Development and Advisory Service (3rd ed). Ministry of Agriculture; Fisheries and Food, London, pp 181—182
21. Alegret S, Alonso J, Bartrolı´ J, Martı´nez-Fa`bregas E (1989) Analyst 114:1443—1447
22. Canham JS, Gordon G, Pacey GE (1988) Anal Chim Acta 209: 157—163
23. International Union of Pure and Applied Chemistry (1981) Pure Appl Chem 35:1907—1912
24. Miller JC, Miller JN (1993) Statistics for Analytical Chemistry (33$ ed). Ellis Horwood, Chichester, pp 101—141