Faculdade de Engenharia da Universidade do Porto
Computational Left-Ventricle Reconstruction from MRI
Data for Patient-specific Cardiac Simulations
Maria Isabel von Hafe Pérez Ferreira da Silva
Dissertation conducted under the
Integrated Master in Bioengineering - Branch of Biomedical Engineering
Supervisors:
Hans Christian Hege, Director of Research Department "Visualization and Data
Analysis" at Zuse Institute Berlin (ZIB)
Aurélio Campilho, Full Professor in the Department of Electrical and Computer
Engineering at the Faculty of Engineering of the University of Porto
Hans Lamecker, Senior Researcher at Zuse Institute Berlin (ZIB)
Jorge Novo Buján, Post-doctoral Investigator at the INESC Technology and
Science (INESC TEC) in Porto
3
Abstract
Recent developments and sophistication of medical imaging technologies, such as Magnetic Resonance (MR), Computed Tomography and Ultrasonography, resulted in more accurate and detailed images of the human body, from which a wide range of valuable anatomical and physiological information can be extracted. Cardiac research has increasingly recognized that heart modeling can help interpret and analyze the provided information from imaging technologies. By combining it with prior biophysical information and other clinical data it is possible to obtain a more realistic model, which can be used for medical diagnosis, to predict surgical outcomes and finally to support treatment decisions. The heart is an organ with a complex structure and function, presenting involuntary cyclical movements, which together with the respiratory motion complicates image acquisition and cardiac modeling. Nevertheless, considering the extreme negative impact that cardiovascular diseases have in the society, the interest in cardiac modeling has received increasing attention, especially in the context of patient-specific medical simulations.
The present dissertation establishes a simple methodology to reconstruct the spatio-temporal left ventricle (LV) anatomy from MRI data for personalized cardiac simulations. Considering the main role that the LV plays in the cardiovascular system, the characterization of its anatomy and function is essential in the clinical practice for the diagnosis of pathological situations, such as the aortic valve diseases. Therefore, the development of personalized in-silico models that allow not only the observation of this heart chamber in 3D and its deformation along the cardiac cycle, but also enables the conduction of patient-specific cardiac simulations, can have an enormous impact on the diagnosis and treatment of cardiovascular diseases. The methodology here proposed extracts personalized geometric surfaces that represent accurately the anatomy of the inner LV surface in different phases of the cardiac cycle from MR images. In order to overcome the main challenges inherent to left ventricle modelling, such as the reconstruction of the apical and basal regions and the correction of motion-related artifacts, interactive techniques that combine different types of MR images used in clinical practice were developed. As final result, a set of smooth surfaces with high quality finite element meshes that represent accurately the geometric shape of the LV cavity in different phases of the cardiac cycle were obtained. This set of patient-specific LV surfaces describe the natural motion of a beating heart and encode information about the regions of the surface that deform at most between two instants of the cardiac cycle. The reconstructed shape of the LV with a smooth geometry and isotropic triangular mesh can be combined with other cardiac models to conduct patient-specific cardiac simulations, such as blood-flow simulations in patients with an aortic valve disease.
Concepts regarding the cardiac anatomy, function and modeling that were crucial for the understanding and development of this project will be addressed. This dissertation also presents the state-of-the-art in the field of LV reconstruction for simulations purposes, by introducing and discussing the most important works on this subject, giving special attention to recent projects based on MRI.
5
Resumo
Actualmente, os níveis de desenvolvimento e sofisticação das tecnologias para imagiologia médica, tais como Ressonância Magnética (RM), Tomografia Computorizada e Ultra-sonografia, permitem a aquisição de imagens do corpo humano com bastante detalhe, a partir das quais é possível extrair uma vasta gama de informação anatómica e fisiológica. No campo da investigação cardiovascular, a importância de modelos cardíacos para apoiar a interpretação e análise da informação proveniente das tecnologias de imagiologia tem sido altamente reconhecida. A combinação deste tipo de modelos com informação biofísica e com outros tipos de dados clínicos permite a construção de um modelo computacional mais próximo da realidade, que pode ser utilizado para diagnóstico médico, previsão de procedimentos cirúrgicos e por último apoiar decisões relativas ao tipo de tratamento a adoptar.
O coração é um órgão com uma estrutura e função complexas, apresentando movimentos cíclicos e involuntários que, em conjunto com os movimentos respiratórios, complicam a aquisição de imagens cardíacas e também o processo de modelação cardíaca. No entanto, devido ao impacto extremamente negativo que as doenças cardiovasculares têm na sociedade moderna, o interesse no desenvolvimento de modelos cardíacos tem vindo a aumentar de forma significativa, particularmente em modelos apropriados para a realização de simulações cardíacas personalizadas.
Esta dissertação estabelece uma metodologia simples para a reconstrução espacial e temporal da anatomia do ventrículo esquerdo a partir de imagens de RM para posteriores simulações cardíacas personalizadas. Tendo em consideração a função fulcral do ventrículo esquerdo no sistema cardiovascular a caracterização da sua anatomia e da sua função é essencial para a detecção e diagnóstico de certas situações patológicas, tais como doenças da válvula aórtica. Neste contexto, a construção de um modelo in silico personalizado que permita a observação em 3D da anatomia e da deformação do ventrículo esquerdo ao longo do ciclo cardíaco terá um impacto significativo no diagnóstico e tratamento de doenças cardiovasculares. Na metodologia desenvolvida nesta dissertação, os diferentes tipos de imagens de RM foram combinados através de métodos interactivos de forma a ultrapassar as dificuldades inerentes ao desenvolvimento de modelos cardíacos, tais como a reconstrução das regiões apical e basal e a correcção de artefactos consequentes dos movimentos cardíacos e respiratórios. O resultado final consiste em superfícies geométricas suaves que representam de forma detalhada a anatomia do ventrículo esquerdo ao longo do ciclo cardíaco. Esta sequência de superfícies ventriculares possibilita não só a observação in silico do movimento natural do coração durante um batimento cardíaco de um determinado paciente, mas também a identificação das regiões ventriculares que sofrem uma deformação mais intensa entre duas fases do ciclo cardíaco. O resultado da reconstrução espacial e temporal do interior do ventrículo esquerdo na forma de superfícies com uma malha de elementos finitos isotrópica e homogénea pode ser combinado com outro tipo de modelos cardíacos para a realização de simulações cardíacas personalizadas, como por exemplo a simulação do fluxo do sanguíneo em pacientes com uma doença valvular.
Esta dissertação introduz os conceitos relativos à anatomia, função e imagiologia cardíacas que foram e são relevantes para a compreensão do problema em causa e também para o desenvolvimento do projecto. O estado-da-arte relativo à reconstrução do ventrículo esquerdo para a realização de simulações cardíacas também será discutido, dando especial atenção aos trabalhos publicados recentemente e baseados em imagens de RM.
7
Acknowledgements
First of all, I wish to thank Hans-Christian Hege, head of the Department of Visualization and Data Analysis at the Zuse Institute Berlin (ZIB), for giving me the opportunity to develop this interesting and challenging project at ZIB and for providing me the first contact with the field of Data Visualization and with a work environment outside the university context. Without his constant support this work would not have been possible.
I am sincerely grateful to Prof. Aurélio Campilho, who awakened my great interest in the field of biomedical imaging analysis and processing and who guided me with his knowledge and constructive critics in the development of this dissertation.
I also want to thank Dr. Hans Lamecker and Dr. Jorge Novo Buján for sharing with me their knowledge and experience in this field. Their vision, extensive support and constant availability contributed to very important improvements of this work.
It was a pleasure to work with all the collaborators of the Department of Visualization and Data Analysis at ZIB, who contributed to a friendly and motivating work atmosphere. In this context, I give a special thanks to Olaf Paetsch, Alexander Kuhn, Vincent Dercksen, Ulrike Homberg and Dr. Daniel Baum, who contributed to my quick integration in the institute and were always available to help me overcome technical difficulties and to support me in the use of the software Amira and also in the German language.
I wish to thank the partners from the DHZB for their medical contribution, but especially Dr. Eng Leonid Goubergrits who introduced me to the research field of cardiac biomechanics and contributed to the developed methodology to achieve the aims of this project. I am truly grateful to João Filipe Fernandes, for his patience and constant availability to guide me in the field of cardiovascular image analysis and processing.
To Prof. Artur Cardoso and Prof. Diamantino Freitas, I want to thank their support in my application for an internship at ZIB, which allowed the realization of this project.
I also thank the European ERASMUS Placements Program for the financial support to fulfill an internship abroad.
At last, but not least, I would like to express my deep gratitude to my parents and my brothers and also to my colleagues and friends Maria Eira and Miguel Duarte, for their constant and indispensable support throughout the course of this Integrated Master in Bioengineering.
8
Contents
Abstract ... 3
Resumo ... 5
Acknowledgements ... 7
Contents ... 8
List of Acronyms ... 10
Chapter 1 - Introduction ... 11
1.1 – Problem and Motivation ... 11
1.2 – Overview ... 13
Chapter 2 - Cardiac Anatomy, Physiology and Imaging ... 17
2.1 – Cardiac Anatomy ... 17
2.2 - Cardiac Function ... 20
2.3 - Cardiac Imaging ... 22
2.3.1 – Ultrasonography (US) ... 25
2.3.2 – Nuclear Imaging (PET and SPECT) ... 26
2.3.3 – Computed Tomography (CT) ... 27
2.3.4 - Magnetic Resonance Imaging (MRI) ... 27
2.4 – Concluding Remarks ... 33
Chapter 3 - Heart Modeling ... 35
3.1 - Overview ... 35
3.2 - Applications ... 36
3.3 - Patient Specific Modelling ... 38
3.4 - Challenges and Limitations ... 39
3.5 – Concluding Remarks ... 40
Chapter 4 – Related Work ... 41
4.1 – Recent Work on LV Reconstruction for Simulation Purposes ... 41
9
Chapter 5 - Materials and Methods... 47
5.1 - Materials ... 47
5.2 - Dataset ... 48
5.3 - Brief Overview ... 50
5.4 - 4D Inner LV Surface Reconstruction ... 52
5.4.1 - Phase A: Inner LV Surface mesh generation in the ED phase ... 52
5.4.2 - Phase B: Inner LV Surface mesh generation in other cardiac phases ... 62
5.5 - Concluding Remarks ... 63
Chapter 6 - Results ... 65
6.1 - ED Phase ... 65
6.1.1 - Sequences’ Registration ... 65
6.1.2 - Inner LV Segmentation ... 67
6.1.3 - Alignment of labeled SAX slices ... 68
6.1.4 - Labels’ Fusion and Surface Extraction ... 71
6.2 - ES Phase ... 76
6.3 - Intermediary Cardiac Phase ... 80
6.4 - Remaining Cardiac Phases ... 83
6.5 – Concluding Remarks ... 86
Chapter 7 – Discussion ... 87
7.1 - Sequences’ Registration ... 87 7.2 - Inner LV Segmentation ... 88 7.3 - Slices’ Alignment ... 89 7.4 - Labels’ Fusion ... 90 7.5 - Surface Smoothing ... 91 7.6 - Surface Remeshing ... 927.7 - Summarized Quantitative Evaluation ... 92
Chapter 8 – Conclusions and Future Perspectives ... 95
References ... 97
Appendix A – Results in Time Point 5 (TP5) ...101
10
List of Acronyms
2CH - 2 Chambers 3CH - 3 Chambers 4CH – 4 Chambers 3D-WH – 3D Whole HeartAHA - American Heart Association ASNC - American Society of Nuclear Cardiology
CoA - Aortic Coarctation AR - Aortic Regurgitation AS - Aortic Stenosis AVD - Aortic Valve Diseases AV - Atrio-Ventricular
bFFE - balanced Fast Field Echo
CRT - Cardiac Resynchronization Therapy CVD - Cardiovascular Diseases
CMRI - Cardiovascular MRI
CFD - Computational Fluid Dynamics CT - Computed Tomography
CARDIOPROOF - Proof of Concept of Model-based Cardiovascular Prediction
DHZB – Deutsches Herzzentrum Berlin DICOM -Digital Image and Communication in Medicine
DT - MRI Diffusion Tensor MRI ECG - Electrocardiograms EDV - End Diastolic Volume ED - End of Diastole ESV - End Systolic Volume ES - End of Systole EU - European Union FE - Finite Elements GL - Gray Level IP – Intersection Point LAX – Horizontal Long Axis
LGE - Late-Gadolinium-Enhancement LV - Left Ventricle
LVEF - Left Ventricular Ejection Fraction
MRI - Magnetic Resonance Imaging MDCT - Multi-Detector Computed
Tomography, PC - Phase Contrast
PET - Positron Emission Tomography RF - Radiofrequency
SAX - Short Axis
SPECT - Single Photon Emission Computed Tomography SA - Sino-Atrial
SVR - Surgical Ventricular Restoration VHD - Valvular Heart Disease
TP - Time Point TRA - Transversal US - Ultrasonography
USA - United States of America RVEF – Right Ventricular Ejection
Fraction VS - Voxel Size
11
Chapter 1 - Introduction
1.1 – Problem and Motivation
According to the World Health Organization (WHO) cardiovascular diseases (CVD) are the number one cause of death and there are projections indicating that the situation will remain (World Health Organization, 2014). An estimated 17.3 million people died from CVD in 2008,
representing 30% of all global deaths. Of these deaths, 7.2 million were due to heart attacks and 5.7 million were due to stroke. If the current trends continue, by 2030 an estimated 23.6 million people will die from cardiovascular diseases in the world. In Unites States of America (USA), an estimated 80 million adults (more than one in three) have one or more types of cardiovascular diseases, causing an American fatality every 40 seconds (Wang & Amini 2012). Furthermore, the American Heart Association (AHA) foresees that 40.5% of Americans, or roughly 116 million people, will have some form of cardiovascular disease by the year 2030. The annually economic implications associated with cardiovascular diseases exceed 503 billion $ in the USA (Ringenberg et al. 2013) and 169 billion € in the European Union (EU) (Leal et al. 2006).
Due to the social and economic impacts of cardiovascular diseases, their prevention, detection and identification (diagnosis), prediction of evolution, and therapy are important issues for improving treatments and reducing mortality and morbidity. From this context arises a demand for preferably non-invasive, accurate diagnosis procedures. Analysis of the cardiac function using imaging instruments has shown to be effective in diagnosing, reducing the mortality and morbidity of CVD.
Magnetic Resonance Imaging (MRI) is a noninvasive imaging technique with the capability to monitor and assess the progression of CVD so that effective procedures for the care and treatment of patients can be developed by physicians and researchers. However, myocardial images analysis is time consuming and suffers from inter and intra-observer variability. Computerized processing and analysis can help clinicians to visualize and interpret the medical conditions objectively (Tavakoli & Amini 2013). Cardiovascular MRI (CMRI), by acquiring data from contiguous, serial electrocardiogram (ECG) gated images of the thorax (including the cardiac apex to the aortic arch) contains sufficient information to allow computer-aided reconstruction of the heart and great vessels in three or four (including time) dimensions (Laschinger et al. 1988). This spatiotemporal (4D) cardiac imaging and reconstruction provides qualitative and quantitative information about the morphology, kinematic and electric function and tissue properties of the heart and larger vessels, enabling the creation of an anatomically realistic model of the heart with detailed heart structure information. This model is of great value in electromechanical simulation, by simulating in different conditions the main cardiac features, including cardiac rhythms, mechanics, hemodynamics, fluid-structure interaction, energy
12
metabolism, and neural control (Deng et al. 2012). The developed models can be used for medical teaching, surgery planning and to support the study of the physiological and pathological mechanism of the heart diseases, such as heart failure, valvular pathologies, arrhythmias or ventricular fibrillation, and hence, to help improve their diagnosis and treatment (Deng et al. 2012). Besides, the computational reconstructed heart can be used as a basis to optimize the design of implantable devices, such as artificial cardiac valves, for improved therapy (Sermesant et al. 2008). The integration of clinical data into computational models of the heart, allows the projection of 3D numerical models with patient-specific parameters, which introduces enormous potential for improving personalized diagnosis, treatment planning, and interventions for cardiovascular diseases. Furthermore, these models have the potential for predictive use and may aid in guiding patient management and therapy planning in the future, both clinically and surgically (Ringenberg et al. 2013).
A particular case of cardiac pathologies that would benefit from a patient-specific model for simulation purposes is the valvular heart disease (VHD). Although less common in industrialized countries than coronary artery disease, heart failure, or hypertension, VHD is associated to a dramatic socio-economic impact due to the need for surgical treatment and hospitalization, as well as to possible peri- and post-operative complications (Vahanian et al. 2012). According to the AHA, the prevalence of any type of VHD in the USA population is 2.5%, from which almost 40% are related to aortic valve diseases (AVD), namely aortic stenosis or aortic regurgitation. Currently, only in the EU, more than 50 000 aortic valve replacements are reported per year, each with an associated cost between 10 000 € and 20 000 € (CARDIOPPROOF, 2014). Therefore, modeling methods that improve the understanding of AVD mechanism and allow predicting the evolution of disease or treatment outcomes are highly recommended.
Patient-specific Modeling for CVD
The detailed anatomical reconstruction from a patient’s heart using its clinical data from various sources, such as electrocardiograms (ECGs), CT (Computed Tomography) and MRI scans, measurements of blood flow and blood pressure, is essential for patient-specific simulations of cardiac electrophysiology, mechanics and hemodynamics. In other words, using the patient's own medical data, 4D working personalized representation of the heart, in its current state could be created. This could be used to simulate a number of pathologies or the effect of therapeutic actions and to analyze the cardiac function of the considered patient, giving valuable details without the need of invasive procedures (Billet et al. 2004). For instance, observing how a problem such as a hole in the heart deforms with each beat, could help in the identification of the critical junctions to make tightest suture during a surgical intervention. Depending on the desired simulation, these models must represent a variety of anatomical structures and functional information. For example, when simulating the electrophysiology in cardiac
13
resynchronization therapy (CRT) it is desirable to have a model comprising the anatomy including part of the coronary veins, tissue motion and scar tissue distribution in the left ventricle. Finally, the model should also incorporate clinical knowledge about how cardiovascular disease disturbs the correct functioning of the heart (Weese et al. 2013).
At the level of aortic valve diseases, the increasing sophistication of surgical solutions and the broad range of available heart valve prostheses require the development of quantitative patient-specific computer simulation tools to aid surgical planning through the assessment of pre-operative scenarios and prediction of post-pre-operative and/or post-implantation outcomes (Vota et al. 2014). Such models would contribute to the analysis of the patient’s heart reaction in terms of blood-flow and mechanics to the implantation of an artificial cardiac valve.
In this context arises a critical need of integration of state-of-the-art clinical imaging with biomechanical computational approaches and with personalized clinical information, not only to enable a reconstruction and visualization of patient-specific 4D heart models, but also to support simulation-based therapy decisions.
1.2 – Overview
This dissertation was prepared at the Visualization and Data Analysis Department from
Konrad-Zuse-Zentrum für Informationstechnik Berlin1 (ZIB), a research institute for applied
mathematics and computer science. The project integrates a main European project, led by the Deutsches Herzzentrum Berlin (DHZB, German Heart Institute Berlin), that aims to determine the applicability and effectiveness of predictive modeling and simulation tools for cardiology, known as CARDIOPROOF2 (Proof of Concept of Model-based Cardiovascular Prediction). It focuses on pathologies related to the aorta, namely the AVD and aortic coarctation (CoA), characterized by left ventricle (LV) pressure and/or volume overload and impaired pump function, which if left untreated can lead to irreversible heart failure.
In both AVD and CoA, the timing and type of treatment (surgery, catheter based intervention or medication/follow-up) are crucial to prevent potentially life threatening sequelae (e.g. heart failure) and, on the other hand, to avoid too early procedures, which might in turn increase the risk for re-operation during the life time of a given patient. Tools that can help improve such decision-making would, therefore, have a significant impact on patient management guidelines, as well as on outcomes and on socio-economic costs. CARDIOPROOF will thus try to apply predictive methods concerning the immediate treatment outcome of intervention on cardiac pump and intrinsic myocardial function, enabling physicians to choose best timing and treatment options. Furthermore, by using virtual models of different valve prostheses, CARDIOPROOF will guide decision-making related to different types of valve surgery (aortoplasty,
1
ZIB, http://www.zib.de/en/home.html
2
14
biological/mechanical valve). These problems will be addressed by modelling the response to aortic valve repair both in terms of local haemodynamics and LV load. The response will be modeled for virtual implantation of different mechanical and biological valve substitutes and for virtual valve reconstruction. Among others, it will be important to develop computational fluid dynamics (CFD) models of the aortic valve and the aorta including fluid-structure interaction and a biomechanical-electrophysiological model of the LV.
The scope is to develop, apply and validate modeling methodologies for performing patient-specific in-silico simulations of ventricular electro-mechanics and to provide deformation data which can be used as a boundary condition for fluid flow simulations. The patient-specific mechanical deformation model shall consist of four main components, an anatomical finite element (FE) model, a constitutive model of passive mechanical properties, an active contraction model which drives contraction and relaxation and a haemodynamical model to serve as a pressure-volume boundary condition, which requires patient-specific parameterization. These models should be physiologically sufficiently detailed to facilitate a direct clinical interpretation of results and should also ensure that simulations can be executed with inexpensive hardware within time frames which are compatible with a clinical framework.
In order to develop the anatomical FE model, a processing pipeline for translating clinical image data on 4D cardiac anatomy into finite element meshes of the ventricles and the attached vessel must be set up. Taking into account that the LV plays the major role in the cardiac pump function (particularly in the AVD cases), the goal of the sub-project presented in this document was to establish a framework to extract a geometric and anatomically accurate surface of the LV cavity, in the different phases of the cardiac cycle. In order to represent the cardiac anatomy in a diastolic configuration, different types of 2D and 3D ECG-gated cardiovascular MR image stacks corresponding to the instant of end diastole were processed, merged and tessellated into a static triangular finite element mesh. The reconstruction strategy was then propagated to the remaining phases of the cardiac cycle. For this end, the biomedical data were processed with Amira®, a software for 3D data visualization, analysis, modeling and visualization. The final results consist on eleven personalized, geometric and smooth surfaces with high quality meshes, representing the LV cavity in different states of the cardiac cycle. Those will serve as one of the input parameters for the biomechanical model, designed to obtain the strain and stress distribution throughout the ventricles, ventricular displacement fields (in particular, the displacement of endocardial surfaces), and pressure-volume loops, i.e cavitary volume and pressure changes over a heart cycle.
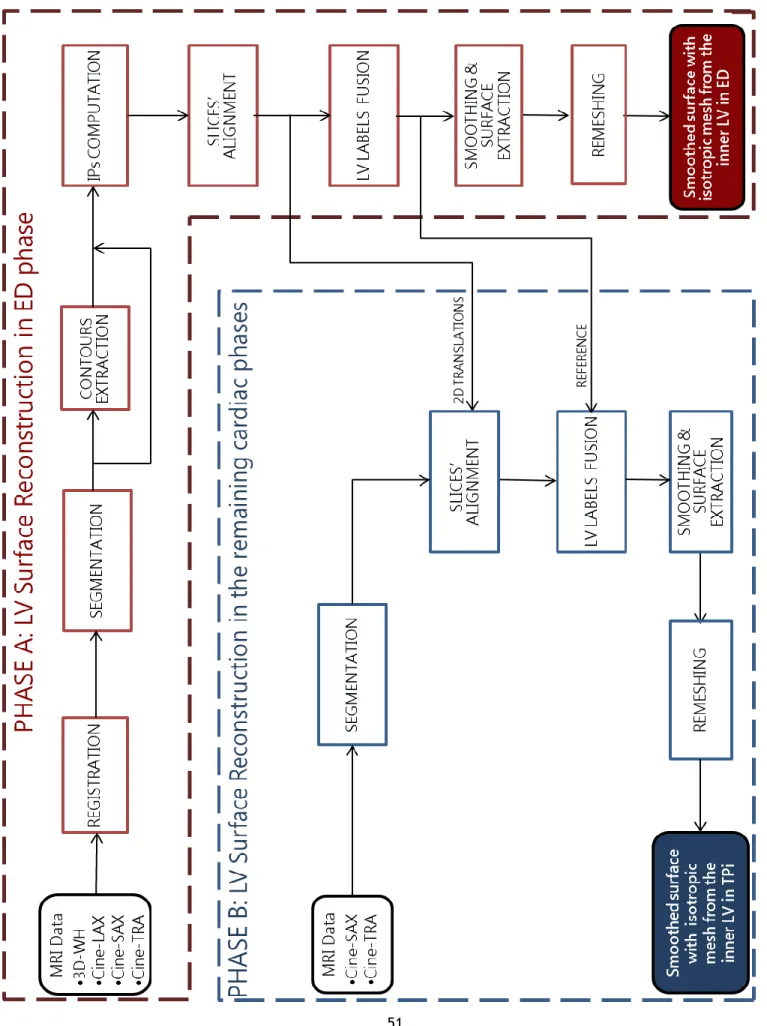
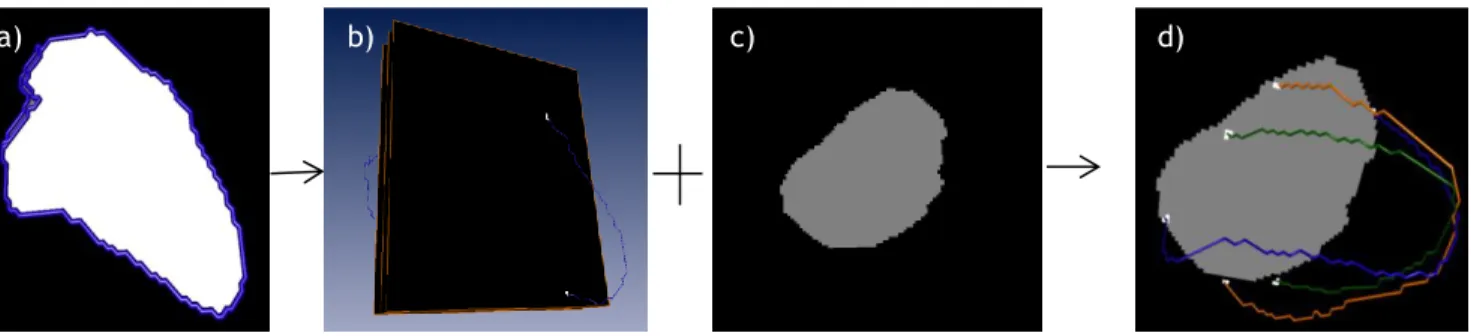
Figure 1.1 depicts a flowchart that summarizes the concept of the developed project and its integration in the CARDIOPROOF project.
15
Figure 1.1 - Flowchart resuming the developed work in this project for the 4D reconstruction of the LV cavity and its integration in the European project CARDIOPROOF.
The developed framework consists on the following main phases:
1. Identification of the physiological state that best represents the anatomical structure of the heart in the images, which usually is the end-diastolic phase of the cardiac cycle. 2. Registration from MR images with different orientation
3. Extraction of the global structure of inner LV (endocardium) for the selected functional stage by image segmentation of the MRI data.
4. Slices’ alignment to correct motion-related artifacts during image acquisition.
5. Extraction of a smooth and accurate surface mesh from the labeled fields, suitable for finite element analysis.
6. Creation of further static models within the cardiac cycle, by adaption of the aforementioned methods to the MR images of the remaining cardiac phases.
The main contribution of this work is the establishment of a simple and interactive method to solve the complex problem of personalized spatio-temporal LV surface reconstruction, which was
16
performed under the supervision of experts in the cardiology area. This 4D reconstruction of the LV allows a primary evaluation of a patient’s cardiac anatomy and function. Besides it will serve as one of the inputs to construct the patient-specific mechanical deformation model that will be used for in-silico simulations regarding the aortic valve disease.
The remainder of this document is organized as follows: Chapter 2 describes the relevant anatomical and physiological aspects of the heart for this project and also the main cardiac image acquisition modalities namely, Ultrasonography (US), Nuclear Imaging (PET and SPECT), Computed Tomography (CT) and, with more detail, Magnetic Resonance Imaging (MRI). Chapter 3 introduces the concept of heart modeling, its applications and respective challenges and limitations. Chapter 4 reviews recent activities on the reconstruction of the LV surface, taking into account simulation purposes. Subsequently, Chapter 5 presents the developed framework and respective methods and materials that were used to create the inner LV model in eleven phases of the cardiac cycle, whereas the results are presented in Chapter 6, followed by a discussion and evaluation in Chapter 7. At last, the main conclusions that can be deduced from the developed work are exposed in Chapter 8.
17
Chapter 2 - Cardiac Anatomy, Physiology
and Imaging
The cardiovascular system is composed of the heart, blood and the blood vessels (divided into veins that carry blood to the heart at low pressure and arteries that carry away blood from the heart at high pressure). This system ensures the circulation of blood throughout the body to maintain homeostasis delivering oxygen and nutrients to the cells and removing wastes. The heart is a contractile muscular organ (myocardium) acting as a mechanical blood pump. Cardiac mechanics is achieved by the contraction of cardiac muscle fibers and is maintained by a circulatory system of coronary arteries that supplies the muscle with oxygenized hemoglobin and nutrients. Coronary arteries (right and left) are two branches of the aorta and supply the myocardium through smaller branches such as left anterior descending and left circumflex diagonal arteries. This contraction is involuntary activated by an electrical impulse triggered by cells of the cardiac conduction system. The rate of triggering is regulated by the autonomous nervous system. This electrical impulse propagates in the heart through the conduction system and then through the rest of the cardiac muscles. The electrical impulse and the mechanical contraction are mainly propagated along the cardiac muscle fibers. Consequently their spatial organization and orientation have an impact on the cardiac function (Peyrat 2009).
This chapter first gives a brief overlook of the cardiac anatomy and physiology, taking into account the main aspects for cardiac modeling. Afterwards, the most common imaging techniques that allow observing the cardiac structure, anatomy, and function based on different physical principles are presented.
2.1 – Cardiac Anatomy
The heart is a muscular cone-shaped organ about the size of a clenched fist of the same person, surrounded by two layers of connective tissue inside and outside, called endocardium and epicardium, respectively, and located in the upper body (chest area) between the lungs. The heart anatomy is illustrated in Figure 2.1. This organ is divided into right and left sections separated by the interventricular septum. Each of these right and left sections is divided into upper and lower chambers known as atria (one is called an atrium) and ventricles, respectively.
18
Figure 2.1 - Anatomy of the heart and blood flow that can be followed by the arrows on the diagram, oxygenated blood in red and deoxygenated in blue (from http://www.texasheart.org).
The four main chambers of the heart are therefore:
• the right atrium (RA), pumps blood into the right ventricle; • the right ventricle (RV), pumps blood into the pulmonary artery; • the left atrium (LA), pumps blood into the left ventricle;
• the left ventricle (LV), pumps blood into the aorta and is the major contractile chamber maintaining the systemic circulation and having a thicker wall than the RV.
To ensure the blood circulation always in the same direction, the heart includes a series of valves:
• the tricuspid valve, separates the right atrium from the right ventricle; • the pulmonary valve separates the right ventricle from the pulmonary artery;
• the mitral valve (or bicuspid valve), separates the left atrium from the left ventricle; • the aortic valve separates the right ventricle from the aorta.
The pulmonary and aortic valves passively open and close with pressure difference between the ventricles and the arteries. The tricuspid and mitral valves are actively controlled by papillary muscles to avoid backflow of blood in atria when blood pressure increases in the contracting ventricles.
Electrical impulses in the heart are originated in specialized cardiac muscle cells, known as self-excitable cells. This type of cells are able to generate an action potential without external stimulation by nerve cells. Only the rate of self-excitability is regulated by the autonomous nervous system depending on needs of the body. The self-excitable cells induce an electrical
19
stimulus to initiate the cardiac cycle and provide a conduction system to coordinate the contraction of muscle cells throughout the heart. The cardiac conduction system can be divided into five parts enumerated in the direction of propagation of the electrical impulse (Figure 2.2):
1. the sino-atrial (SA) node, located in the upper wall of the right atrium, initiates the cardiac cycle by generating an electrical impulse that spreads through both atria;
2. the atrio-ventricular (AV) node, located near the lower region of the interatrial septum, receives the electrical impulse generated by the SA node. A slight delay of the electrical transmission occurs here, allowing the atria to fully contract before the electrical impulse propagates into the ventricles;
3. the bundle of His (or atrioventricular bundle), a collection of heart muscle cells specialized for electrical conduction, receives the action potential from the AV node and transmits the electrical impulse to the ventricles through the right and left bundle branches;
4. the left and right bundle branches, propagates the electrical impulse in two different parts of the heart, the left and right ventricles;
5. the Purkinje fibers, conduct the action potential from the interventricular septum, down to the apex, and then upward through the ventricles.
20
2.2 - Cardiac Function
Since the heart has a periodic motion, the description of the cardiac function can be limited to one cardiac cycle. The cardiac cycle is divided into two general phases: systole and diastole. The systole includes events associated with ventricular contraction and ejection, and the diastole includes the ventricular relaxation and filling.
The electrical function of the heart can be observed with the ECG, which gives a global electrical state of the heart (Figure 2.3). The three main features of the ECG are the following:
1. P wave, indicating that the atria are electrically stimulated to pump blood into the ventricles.
2. QRS complex, indicating that the ventricles are electrically stimulated to pump blood. 3. T wave, indicating the recovery period of the ventricles (Peyrat 2009).
Figure 2.3 - Wiggers Diagram [Richardson 1998] : It shows different parameters of the cardiac function during a cardiac cycle (from http://en.wikipedia.org/wiki/Cardiac_cycle).
Usually, the cardiac cycle is described between the end of diastole (ED) of two consecutives cardiac cycles. The cardiac cycle is further divided into seven phases:
1. The atrial systole: it refers to the contraction of the atrial muscle and it starts when the P wave occurs on the ECG.
2. The isovolumetric contraction: this phase includes the contraction of the ventricle with all valves closed, starting when the R wave occurs in the ECG.
3. The rapid ejection: when the intraventricular pressures exceed the pressures within the aorta and pulmonary artery, the aortic and pulmonary valves open and blood is ejected out of the ventricles.
21
4. The reduced ejection: during this phase ventricular pressure falls slightly below outflow tract pressure. Atrial pressures gradually rise during this phase owing to continued venous return into the atrial chamber. This phase is characterized by the end of the T wave on the ECG. 5. The isovolumetric relaxation: in this phase the ventricles relax and the intraventricular
pressure decreases. When this occurs, a pressure gradient reversal causes the aortic and pulmonary valves to abruptly close.
6. The rapid inflow: when the ventricular pressures fall below atrial pressures, the atrio-ventricular valves open and atrio-ventricular filling begins.
7. The diastole: in this period the ventricles are passively filling with blood.
Figure 2.3 summarizes the evolution of some parameters over a cardiac cycle, such as the ECG, sound of the heartbeat, volume curves, and pressure curves. The most common and simple parameters used to assess the cardiac function are the left ventricular (LVEF) and right ventricular (RVEF) ejection fractions. They represent the fraction of blood pumped out of a ventricle with each heart beat (Peyrat 2009). Normally, 70% of the whole LV blood in end diastole is ejected out during systole. The ejection fraction (EF) ratio is an index of global LV function, which is calculated as (EDV–ESV)/EDV, where EDV is the volume of the LV at end-diastole and ESV is the volume of the LV during end-systole. Ventricular walls thicken during systole – this is typically referred as wall thickening and has been proven to be a very reliable index of regional myocardial function. Heart failure is characterized by a significant decrease in the EF. An additional index of cardiac performance is myocardial mass, which can be determined from myocardial volume, assuming the myocardium to have uniform density (Tavakoli & Amini 2013).
Due to atherosclerosis, the coronary arteries may gradually become occluded and end in coronary artery disease. Coronary occlusion leads to disturbance in the cardiac contractility and causes global or regional dysfunction in the heart which may be diagnosed using state-of-the-art medical imaging techniques such as US, MRI, CT, and nuclear medicine.
Aortic valve disease can be caused by aortic stenosis (AS), leading to an obstruction to flow, or by aortic regurgitation (AR), resulting in a leakage backward, or by a combination of both. AS refers to a narrowing of the aortic valve opening during systole and consequently the LV muscles thicken (LV hypertrophy) in order to try to overcome the stress of obstruction. The pressure in the LV when it fills with blood increases and is transmitted to the lungs. AR occurs when the aortic valve does not close properly due to a leakage of the valve backward into the LV after systole. In order to compensate for the large volume of blood that flows backward, the LV cavity enlarges and the wall muscle thickens. Thus, the heart is capable of pumping out both the amount of blood required by the body and the blood that has gone backward into the LV.
Long-22
standing aortic regurgitation may result in irreversible damage to the muscle of the left ventricle, even in the absence of symptoms. Consequently, appropriate, timely treatment with open-heart surgery may be lifesaving in the case of AVD (Nishimura 2002).
When studying ventricular motion, physicians typically assign a subjective segmental function score to different segments of the ventricles:
Normokinesia: The myocardial motion and thickening is normal.
Hypokinesia: The affected segment moves slower and thickens less than normal. Akinesia: The infarcted region has totally lost its ability to contract in the systolic phase
and moves passively along with its surrounding myocardial tissue.
Dyskinesisa: The infarcted region moves paradoxically and bulges out during systole due to the ventricular blood pressure.
Aneurysm: The infarcted region undergoes remodeling, becomes thin, bulging outwards during the systolic phase like a balloon, leading to rupture and death (Tavakoli & Amini 2013).
2.3 - Cardiac Imaging
Cardiac imaging is an integral part of the evaluation of patients with all forms of heart disease. Imaging techniques make it possible to visualize anatomical structures and morphological or functional anomalies of the heart. Due to the inherent nature of cardiac function, the temporal visualization of cardiac anatomy allows a better assessment of cardiac motion and mechanical function. Beyond cardiac anatomy and motion, metabolic function of the heart can also be observed with molecular imaging techniques. There are several cardiac imaging modalities that are in widespread use. These include nuclear imaging (PET and SPECT), US (or echocardiography), cardiac CT, cardiovascular MRI and coronary angiography, which can be used to measure myocardial perfusion, left ventricular function, and coronary anatomy for clinical management and research. The orientation of the heart, angle selection for cardiac planes, number of segments, slice display and thickness, nomenclature for segments, and assignment of segments to coronary arterial territories are important parameters for imaging myocardial perfusion and wall motion that vary between each modality. The definition of these parameters in image acquisition should be based on the following criteria (Cerqueira 2002):
23
1. Maintain consistency with accepted anatomic and autopsy data.
2. Utilize as much as possible existing and accepted approaches to myocardial segmentation and nomenclature.
3. Allow precise localization by using anatomic landmarks whenever possible.
4. Provide adequate sampling of the left ventricle and coronary distribution without exceeding the resolution limits of the imaging modalities or relevance for clinical and research applications.
5. Allow linkage of the segments to known coronary arterial topography as defined by coronary angiography.
A standardization of these parameters for all modalities would enable accurate intra- and cross-modality comparisons for clinical patient management and research.
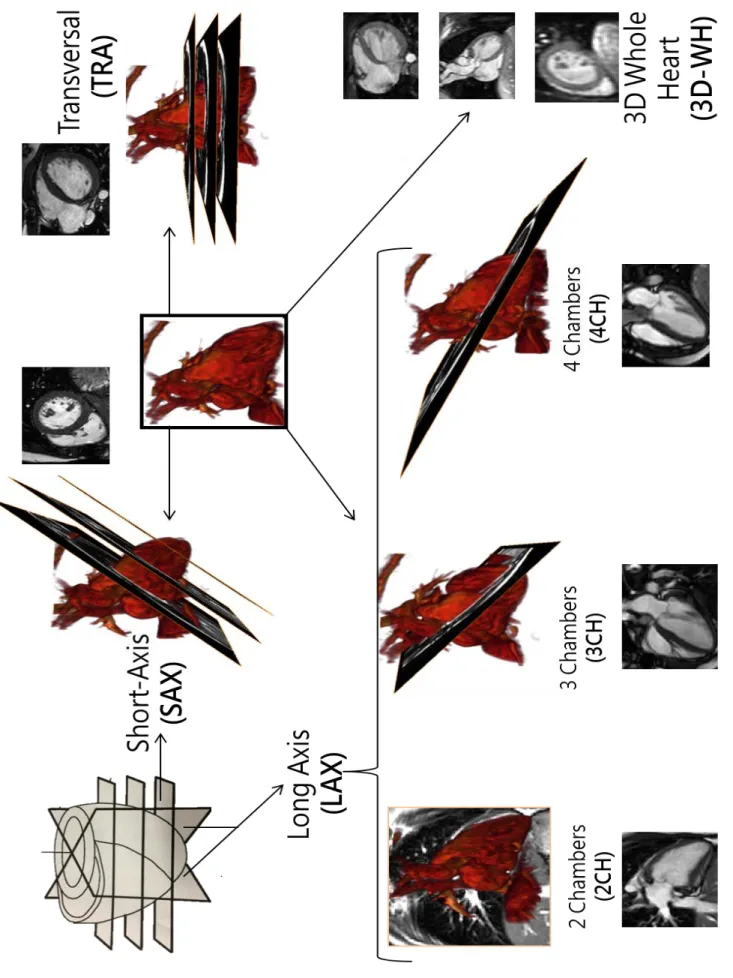
The American Society of Nuclear Cardiology (ASNC) has proposed three main cardiac view planes and a myocardial segmentation and nomenclature to be used for all cardiac imaging modalities, which can be observed in Figure 2.4. A view plane through:
the short axis (SAX), shows both ventricles (Figure 2.4 a)),
the horizontal long axis (LAX) or the 4-chambers view (4CH) shows the two ventricles and both atria (Figure 2.4 b)),
the vertical long axis, or the 3-chambers view (3CH) shows the left ventricle, the two atria and the LV outflow tract (LVOT), through the aorta (Figure 2.4 c)).
In the context of LV reconstruction, the 2-chambers (2CH) view plane, where it is possible to observe the left atrium and ventricle and the mitral valve, is also important.
24
Figure 2.4 – Standard Cardiac Imaging View Planes. On the top-left, an illustration of short axis (SAX) and Long-Axis (LAX) cardiac sections in a normal subject (Tavakoli & Amini 2013). On the top right, simplified representation of the cardiac anatomy represented in the different standard views (from (Lee 2006)). In the middle row representation of the standard cardiac planes as proposed by the ASNC (adapted from yale.edu), short axis, horizontal long axis and vertical long axis, and respective examples of MR images on the bottom (short-axis (SAX), long-axis (LAX), 2 chambers (2CH), 3 chambers (3CH), 4 chambers (4CH)).
The division of the heart in three annular regions along its long axis, results in a basal, mid-cavity and apical regions, that are divided in six, six and four angular segments, respectively. Another segment is included for the apical cap. The attachment of the right ventricular wall to the left ventricle is used to identify and separate the septum from the left ventricular anterior
vLAX – 3CH hLAX – 4CH SAX a) b) c) 2CH hLAX – 4CH vLAX – 3CH SAX
25
and inferior free walls. Figure 2.5 shows the location and the recommended names for the 17 myocardial segments prescribed by the American Heart Association (AHA).
Figure 2.5 - Seventeen AHA prescribed segments for the heart (a) basal SAX view, (b) mid-LV SAX view and (c) apical SAX view. (antero-septal (AS), anterior (A), lateral (L), posterior (P), inferior (I), and infero-septal (IS)), from (Tavakoli & Amini 2013).
Since each method of cardiac imaging has advantages and drawbacks, a brief overview from the non-invasive imaging modalities is presented next. MRI will be characterized with more detail, since this project focuses on the LV reconstruction from MRI data.
2.3.1 – Ultrasonography (US)
Ultrasonographic imaging is based on the partial reflection of acoustic waves at tissue boundaries. An array of piezoelectric crystals generates the backscattered ultrasound wave and the US image contrast is governed by the difference in acoustic properties between adjacent tissues. It is used for assessment of shape, thickness and motion of the cardiac walls and of the heart valves. The US image quality is limited by relatively low contrast between myocardial and adjacent tissues, fading of the endocardial boundaries and image noise (Dell & Mcculloch 2002). Additionally, it suffers from sub-optimal visualization of the cardiac segments, operator dependence issues and air/bone interaction problems causing reverberation artifacts. Besides, in the overweight patients it is very hard to reach the heart, making it impossible to obtain an acoustic window. By measuring frequency shifts between emitted and reflected acoustic signal, Echo-Doppler Imaging can be used to compute the velocity of moving particles, providing an additional motion information displayed as a color overlay on the standard echography sequences. Typically, positive Doppler shift signals, corresponding to flow towards the transducer, are displayed at the red end of the spectrum and flow away from the transducer at the blue end. It is mostly used to study blood flow, characterized by high velocities with low
26
amplitude, and to measure myocardial wall motion, characterized by low velocities with high amplitude. It can also be used as molecular imaging method by targeting specific molecules with labeled microbubbles with different acoustic properties from that of the tissue (Peyrat 2009). By using recent sophisticated 3D ultrasound transducers consisting on a miniaturized array of piezoelectric crystals, it is possible to obtain 3D US images. Real time 3D scanners were introduced in the early 1990s, but in comparison to 2D echocardiography, initial images suffered from low spatial resolution. New high-tech transducer arrays have significantly improved spatial resolution and image quality – as a result, 3D imaging is enjoying more wide-spread use (Tavakoli & Amini 2013). 3D US has received substantial attention in cardiac valve diseases, which require the imaging of valvular dynamics in three dimensions (Young & Frangi 2009).
Among the current cardiac imaging modalities, US is perhaps the most prevalent because it is non-invasive, cost effective, ease to use, gives real-time feedback, it is portable, with applications at the bedside and during interventions and it is widespread available (Dell & Mcculloch 2002), (Young & Frangi 2009).
2.3.2 – Nuclear Imaging (PET and SPECT)
Injected radioisotopes (the marker) linked to compounds (the tracer) usually involved in a metabolic process are used to produce the image’s signal. Positron emission tomography (PET) uses radioactive tracers labeled with radioisotopes, emitting positrons during their radioactive decay. After coming to rest, the positrons annihilate into two nearly back-to-back gamma rays of 511 keV gamma rays, which are detected with a positron camera surrounding the patient. PET can be used to measure myocardial perfusion or to identify areas of normal and reduced metabolism in order to separate viable and necrotic myocardium, for instance after a heart attack (Tavakoli & Amini 2013).
Single photon emission computed tomography (SPECT) uses tracers that emit gamma rays with energy between 50 and 500 keV. Individual photons are detected using either a rotating gamma camera or special purpose multi-detector devices. All detectors used for single photon imaging require some form of gamma ray collimation and, hence, suffer basic limitations to spatial resolution and, more particularly, sensitivity. SPECT is used to detect areas of normal and reduced perfusion in the myocardium (Peyrat 2009). Nuclear imaging is restricted to functional and perfusion information, but it is easy to use, measures relative volumes without the need for geometric assumptions, such as ejection fraction, peak filling/ejection rates, time to peak filling/ejection rates, and other related indices. It is the only modality which can conclusively determine myocardial viability and is typically used as ground-truth in multimodality studies (Tavakoli & Amini 2013). On the other hand, it has relatively low spatial resolution, it is
27
susceptible to background signal sources, and to variable attenuation during respiration and requires long acquisition times. It cannot be used for assessment of cardiac and coronary artery morphology.
2.3.3 – Computed Tomography (CT)
The latest advances in CT technology enabled the acquisition of time-series of 3D volumes (dynamic 4D CT). Computed Tomography measures the density of tissues with the intensity attenuation of X-Rays passing through the patient. The conventional CT scanner consists of an array of detectors and a single X-ray source (multi-detector computed tomography, MDCT), which is rotated around the sample. The transmitted fan-shaped X-ray beam is recorded at several angles, and a 2D image is reconstructed by using a back- projection algorithm (Dell & Mcculloch 2002). It results in detailed anatomical images of the moving heart with high contrast and exquisite special resolution. A high temporal resolution from MDCT scanners such as 64 (128, 256, or 320) detector-row CT scanners and dual source CT scanner are available with multiple gantry rotations in one second, acquiring several CT slices (64 slice for a 64 row CT scanner). A contrast agent can be injected to enhance the contrast between blood and cardiac tissues (late enhancement CT), enabling the visualization of scarred myocardium. The spectral CT uses a range of X-ray energies to perform tissue characterization. CT angiography is very sensitive for diagnosis of coronary artery, by-pass graft, and stent abnormalities. It is able to acquire unique visualization of the coronary arteries including narrowing, type and degree of atherosclerosis plaque. Additionally, it can also be used to simultaneously visualize the pulmonary and systemic arteries as well as the thrombosis. Cardiac CT is especially useful in evaluating the myocardium, coronary arteries, pulmonary veins, thoracic aorta, pericardium, and cardiac masses, such as thrombus of the left atrial appendage. CT scanners, however, use ionizing radiation, are more expensive and less available than US imagers (Tavakoli & Amini 2013).
2.3.4 - Magnetic Resonance Imaging (MRI)
The world's first magnetic resonance imaging machine was created by Damadian in 1972. MRI uses a pulsed radiofrequency wave in the presence of a high magnetic field to produce high quality images of the body in any plane. It has been recognized as a powerful tool for cardiovascular imaging because of its unique potential to measure blood flow, cardiac wall motion and tissue properties jointly, allowing the evaluation of ventricular volume and function, myocardial viability and vascular anatomy (Christodoulou et al. 2011), (Markl et al. 2012).
28
Nevertheless, this non-ionizing technology is not portable, it has to be used in a controlled room and its associated cost is very high. Contraindications to the use of MRI include pacemakers and metal implants, since they react to the strong magnetic field.
Physical Principles
Basically, for image acquisition, the patient is placed inside a very strong, stable magnetic field (between 0.2T - 7T, which is 10 000 - 30 000 times stronger than the earth’s magnetic field), (Mulkern & Chung 2000). The nuclear magnetization of the hydrogen atoms within the patient's body aligns with the magnetic field. Then, different magnetic gradient fields are applied along the body, in order to obtain a gradient of Larmor precession frequency, which is proportional to the strength of the field. The body area being examined is exposed to pulses of radio waves. When the frequency of transmitted radio wave signal equals the Larmor precession frequency of the aligned protons in a certain region of the exposed body area, resonance occurs and the excited hydrogen atoms emit radiofrequency (RF) echosignals (by relaxation), detectable by an external RF coil in MRI scanners. When a RF pulse is applied at the resonance frequency of a given slice, only the protons in this slice are excited. The signal is analyzed by computer and processed into slice images of the body, which can be taken in any plane. The MR signal is a mix of signals with all the emitted radiofrequencies (encoding in the frequency-encoding direction) and phase shifts (encoding in the phase-encoding direction) that give access to the image slice in the frequency domain. The image slice is reconstructed in the spatial domain using a 2D inverse Fourier Transform (Mulkern & Chung 2000). The emitted signal depends on the proton density and the relaxation times. Magnetic resonance imaging also has the ability to acquire 3- or 4-dimensional data.
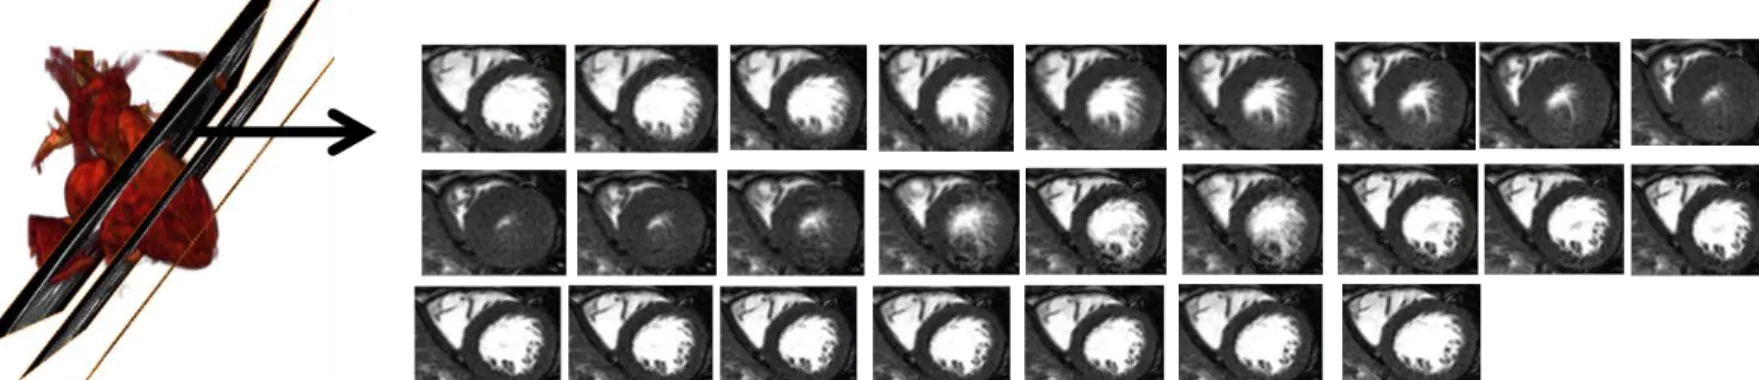
Typical cardiac MR (CMR) Images
A challenge of CMR imaging arises from the movement of the heart throughout the cardiac cycle and the movement of the lungs during the respiratory cycle, which produce motion artifacts in the image. Respiratory motion can be alleviated with breath holding during imaging. The problem of heart motion can be solved by prospective scanning with the synchronization of ECG-gated imaging, where phase encodes can then be identified and clustered around a particular time in the cardiac cycle, allowing for the generation of many images at different points in the cycle, albeit shared from different heartbeats (Mulkern & Chung 2000). About thirty phases (or images) can be obtained during one cardiac cycle with the currently available equipment, yielding a temporal resolution of about 30 ms. The number of phases decreases proportionally to the heart rate. Imaging of the heart in cine MRI covers about 10–15 slices and 15–30 frames, depending on the size of the heart, prescribed slice thickness, the heart rate, and specific
29
approach to image acquisition. A single examination can thus be made up of 250 images. The standard imaging plane is perpendicular to the long (apex-base) axis and called short axis (SAX) plane (Figure 2.6 b) and c)). Images acquired parallel to the long-axis are called Long Axis (LAX) images (Figure 2.6 a)), which can be scanned from different planes, originating 2-, 3-, or 4- heart chambers views (2CH, 3CH, 4CH, see page 22). Those are sometimes combined with SAX images for better visualization of the anatomy as well as for computing true 3D motion (including the through-plane motion) (Tavakoli & Amini 2013). In full-size CMR images, the heart represents a relative small surface and, to decrease the computational time, processing is usually restricted to a smaller computed region of interest (ROI), including only the heart tissue.
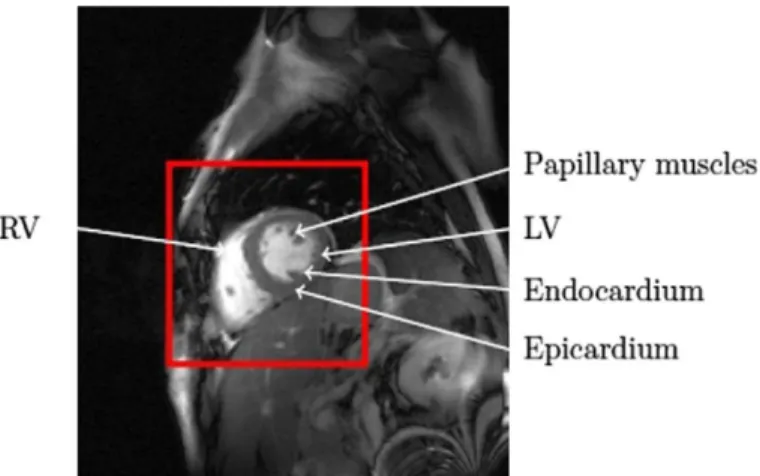
Figure 2.6 – a) Cardiac cine MRI LAX or 2CH view plane; b) Cardiac cine MRI SAX view plane (1:LV, 2:RV); c) a close- up of the SAX image showing the epicardium and endocardium and papillary muscles (PM) shape variability, (from (Tavakoli & Amini 2013).
In Figure 2.7, that represents a typical CMR image, it is possible to observe that blood pools appear bright and myocardium and surrounding structures appear dark, with a spatial resolution of around 1.5 mm per pixel. This aspect is due to the use of balanced Fast Field Echo (bFFE) MRI sequences, which have been replacing standard gradient echo for the last 5 years and considerably improving image quality (Petitjean & Dacher 2011).
30
Figure 2.7 - A full size SAX CMR image and a ROI identifying the heart (from (Petitjean & Dacher 2011)).
In Figure 2.8 it is possible to observe the variability, regarding gray levels or structure shapes, present in CMR images. Gray level intensities can also differ due to the use of different MRI scans or different bFFE sequences. Some parts of the images exhibit fuzziness mostly due to the respiration motion artifacts, but also due to blood flow and partial volume effects. This former effect is a consequence of non-zero thickness of MRI slices and consequently, in some areas, a voxel can be a mixture of several tissue types. Figure 2.9, highlights the blood flow effect, showing that the boundaries between the left atrium, right atrium, and the aorta are unclear. In terms of shape, the ventricle varies over patients, over time and over the long axis. The motion-related artifacts, partial volume effect and variability inherent to CMR must be accounted in anatomy’s reconstruction algorithms (Petitjean & Dacher 2011).
31
Figure 2.9 - Cardiac MRI image showing that the boundaries between the left atrium, right atrium and the aorta are unclear, as indicated by the arrow, due to the thin walls and partial volume effects (from (Zhuang 2013)).
Main CMRI Modalities
Over the last decades MRI has undergone many substantial developments, where the applicability depends on the cardiac characteristic to be evaluated.
Cardiac cine-MRI is considered the standard MR technique mainly used for global function
measurements. Cine sequences MRI are collection of images (usually at the same spatial location) covering of one full period of cardiac cycle or over several periods, in order to obtain complete coverage. This time-resolved technique is able to achieve high resolution images with respect to the cardiac border but the contrast is not very intense inside the cardiac wall. The rapid acquisition time is achieved in cost of a significant slice thickness, resulting in a poor out-of-plane resolution (about 7mm). This method shows dynamic processes, such as the ejection of blood out of the heart into the aorta. By means of fast imaging and displaying the resulting images in a sequential-loop, the impression of a real-time movie is generated. Ejection fractions and stroke volumes calculated from these cine MRI images in different cardiac axes have been shown to be more accurate than any other imaging modality (Magnetic Resonance - Technology Information Portal 2014).
3D whole heart (3D-WH) MR sequence is a free-breathing, isotropic, 3D data acquisition
method that scans an entire desirable volumetric slab. Thin slices can be reconstructed from the raw data in any plane without problems of “cross-talk” and without need for interslice gaps (Lee 2006). A respiratory navigator tracks diaphragmatic movement, which eliminates the need for breath-holding. Data are usually acquired during periods when cardiac motion and flow are at minimal levels (usually during mid to late diastole). The disadvantage of this method is the longer acquisition time and a lower in-plane resolution when compared with other CMRI methods, such as the cine-sequences (Bogaert et al. 2012).
32
A tagged MRI uses a special spin tagging pre pulses sequence to create temporary features – tags, producing markers inside the myocardium over time. These tags can be tracked, since they deform together with the myocardium as the heart beats. This deformation is captured by MR imaging, permitting to compute dense myocardial motions and strain. Besides better time resolution, tagged MRI can show not only the surface deformation, but also the in-wall myocardium motion, such as the twisting in the short axis circumferential direction. Tagged MR techniques are used for regional analysis and temporal registration (Tavakoli & Amini 2013).
Phase contrast (PC) sequences utilize the change in the phase shifts of the flowing protons in
the region of interest to create an image. Spins that are moving along the direction of a magnetic field gradient receive a phase shift proportional to their velocity. Regions that are stationary remain black, while moving regions are represented as grey to white. PC-MRI can be used for flow imaging, to measure and quantify pulsatile blood flow and cardiac and valve function in the heart and large vessels. Recent developments allow the comprehensive acquisition and analysis of blood flow dynamics with full volumetric coverage of the vascular region of interest. 3D visualization can be performed in order to depict the configuration and changes of blood flow patterns based on the acquired velocity vectors in all three spatial dimensions. In addition to the measurements of basic flow volumes and velocities, the estimation of derived hemodynamic bio-markers such as wall shear forces, pulse wave velocity, pressure gradients and other measures have been proposed (Markl et al. 2012).
Diffusion Tensor MRI (DT-MRI) allows the determination of directionality as well as
the magnitude of water diffusion. It measures the mobility of the water molecules inside a voxel due to their Brownian motion constrained by the tissue. In this way, the tissue structure surrounding water molecules can be characterized. This description of tissue structure is particularly useful to depict myocardial fiber architecture. Due to the acquisition of several diffusion weighted images with different magnetic diffusion gradients, it has the disadvantage of being too slow to cope with cardiac motion. (Peyrat 2009)
There are other CMRI sub modalities beyond the ones that were described, such as late-gadolinium-enhancement (LGE) imaging for visualizing scarred tissue, coronary MR angiography for visualizing the coronaries, multinuclear spectroscopy for spectroscopic imaging based on Carbon, Sodium, or Fluorine, and first-pass perfusion imaging to visualize the ischemic myocardium (Tavakoli & Amini 2013).
33
2.4 – Concluding Remarks
This chapter gave a brief overview on the complex anatomy, function and imaging of the human heart, with the purpose of introducing the anatomical, physiological and clinical aspects that will be important for the next chapters. Basically, the heart can be interpreted as a system composed of biological, electrical and mechanical components, each one depending on a variety of parameters, which will rule the performance in terms of blood circulation throughout the body. Among others, the extraction of parameters related to the LV, such as LV volume and pressure, are essential to obtain functional indexes of this chamber, which in turn provide the identification and characterization of pathological states, such as the aortic valve disease.
Noninvasive imaging techniques are vital and have been widely applied to clinical use. Due to its capability to monitor and assess the progression of CVD, cardiac imaging enables more accurate diagnostics and the development of effective procedures for the patients care and treatment. Cardiac image acquisition is specially a complex task, due to the involuntary movement of the heart and the respiratory movement of the thorax, which lead to the improvement of the basic imaging technologies. Nowadays, cine MRI is the gold standard for the assessment of global parameters of cardiac pump function.
The advantages associated to MRI when compared to the other modalities are: noninvasiveness,
nonionizing radiation,
capability to generate 3D and 4D images with high spatial and temporal resolutions and with good soft tissue contrast,
possibility to image the heart at arbitrary orientations,
ability to simultaneously evaluate both structure and function of the heart and it is valuable in diagnosing a large range of pathological conditions.
On the other hand, this technology is expensive, not portable, not “real-time”, it has lower resolution than CT and it cannot be used in patients with pacemakers or metal implants.
35
Chapter 3 - Heart Modeling
The subject of heart modelling is introduced in this chapter with focus on patient-specific cardiac models. Therefore, the scientific concepts, the applications, the challenges and the limitations associated to this task will be presented.
3.1 - Overview
The simulation and the good understanding of the human body anatomy, physiology, and dynamics can be achieved through human body models, where real problems are translated in mathematical language. Computational modeling is the use of mathematics, physics and computer science to study the behavior of complex systems by computer simulation. A computational model contains numerous variables that characterize the system being studied. Simulation is done by adjusting these variables and observing how the changes affect the outcomes predicted by the model (National Institute of Biomedical Imaging and Bioengineering 2013). In most scientific computing applications, a physical system is represented by a mathematical model, where the continuous physical domain is replaced by a discrete representation that is suitable for a numerical solution and can then be used for different simulations. Computer simulations can be applied to a wide range of fields, among them the cardiac electro-mechanical simulations. For a good simulation, a computer mathematical model which imitates a natural situation as close as possible is needed. In the case of the human heart, its irregular 3D shape and dynamics make it difficult to reproduce and to represent as a computer model. The reconstruction of a 4D model of the human heart that is intended for computer simulations can only be achieved with accurate anatomical data that provide detailed heart structure information. Finite element (FE) analysis can be used to model the complex geometry, non-linear material properties and large deformations of the heart, to enable solution of the biophysical conservation laws linking stress, strain and energy expenditure (Young & Frangi 2009).
Human body atlases attempt to provide a “standard” description of the human body or parts of it and have long been used in medicine for anatomical and physiological studies. In the past, those were constructed manually by experts in the field, but nowadays, with the advances in the processing and analysis of biomedical images, the production of digital atlases is a reality. The creation of these atlases requires the availability and processing of a representative dataset, which should include multimodal information and different scales of observation, across large patient populations. By applying parametric mathematical modeling tools, the different imaging modalities and protocols and the different data sources can be fused, enabling an efficient
![Figure 2.3 - Wiggers Diagram [Richardson 1998] : It shows different parameters of the cardiac function during a cardiac cycle (from http://en.wikipedia.org/wiki/Cardiac_cycle)](https://thumb-eu.123doks.com/thumbv2/123dok_br/15239935.1022846/20.918.250.670.432.718/wiggers-diagram-richardson-different-parameters-function-wikipedia-cardiac.webp)