Contents lists available atScienceDirect
Food Chemistry
journal homepage:www.elsevier.com/locate/foodchem
Predicting calcium in grape must and base wine by FT-NIR spectroscopy
Joana Véstia
a, João Mota Barroso
a, Helena Ferreira
b, Luís Gaspar
b, Ana Elisa Rato
a,⁎aInstituto de Ciências Agrárias e Ambientais Mediterrânicas, Universidade de Évora, Departamento de Fitotecnia, Apartado 94 7002 – 554, Évora, Portugal bAdega de Borba, CRL. Largo Gago Coutinho e Sacadura Cabral, 7150 Borba, Portugal
A R T I C L E I N F O Keywords: Calcium Base wine Grape must FT-NIR spectroscopy Alginate beads A B S T R A C T
Calcium content in sparkling wines may not exceed 80 mg/L due to the risk of aggregation with alginate cap-sules. The high calcium content usually found in wine and must emphasizes the need to develop alternative and appropriate techniques faster and cleaner than atomic absorption spectrometry (AAS). To obtain a robust model to predict calcium content, FT-NIR spectroscopy was used in 98 base white wine samples and 60 must samples from an Alentejo winery. The reference method for calcium determination was AAS technique, with a dry ashing sample procedure, as a prior treatment.
Results confirmed the ability of FT-NIR as an alternative technique to AAS, to predict calcium content in grape must and base wine. Advance knowledge of the calcium content in the grape must will help avoid ob-taining a mixture of musts with a high calcium content in the same container.
1. Introduction
Wine makers are continuously looking for high quality wines. A strict analytical control of minerals is required during the whole process of wine production from grape to final product. A critical step in the production technology of sparkling wine is the utilization of im-mobilized cells in alginate beads. After the main fermentation is com-pleted, sugar and yeasts are added to produce secondary fermentation with an excess of carbon dioxide production. Traditional sparkling wine is produced by secondary fermentation in the bottle and the use of yeasts is necessary for this fermentation. Encapsulated yeasts allow direct inoculation into wine and are used rather than free yeasts to ensure an active minimum population of 1 million cells/mL of wine. Therefore, the use of encapsulated yeasts in commercial production of sparkling wine is preferable to free yeasts, because they are much more easily added to and removed from bottles via the ice-disgorging pro-cedure, without the need for traditional riddling.
The yeast immobilization technique within double layer calcium alginate beads is widely used in the food industry due to its high ca-pacity of retention and preservation of cell viability (Velings & Mestdagh, 1995). Alginate is a polysaccharide biopolymer composed of varying compositions of b-1,4 linked D-mannuronic and L-guluronic
acids and has a high affinity with divalent cations. Alginate is cheap, non-toxic, forms a highly versatile array and protects the active com-ponents from heat and moisture, thus increasing its stability and bioavailability (Funami et al., 2009). However, the use of encapsulated
yeasts in base wine needs to meet certain requirements. These yeasts should not be used in wine with a calcium content higher than 80 mg/L, in order to avoid aggregation of alginate capsules as a result of calcium bridges. When the second fermentation is completed, it is necessary to remove the beads from bottles and the aggregation of alginate beads will form a larger and less flexible structure that will make the ice-disgorging procedure more difficult. The incomplete removal of algi-nate beads from bottles requires another filtration that will lead to a significant loss in quality (Genisheva, Teixeira, & Oliveira, 2014).
The wine is a complex water-ethanol mixture which contains, among other substances, a great variety of salts. The most abundant ones are those related to grape physiological processes, such us K, Ca, Na and Mg (Grindlay, Mora, Gras, de Loos-Vollebregt, 2011). The grape itself is the main source of calcium in wine. Calcium is found in the grape pulp, skin cell walls and in cell membranes, affecting cell per-meability and stability. Calcium bound to cell walls in grape skin, may reach values of 0.8 mg/g frw (fresh weight) (Huang, Huang, & Wang, 2005). Calcium can also be derived, to a lesser extent, from con-tamination through soil, cement storage tanks and from coadjuvants that contain it. In the soils, ions move from external solution into root cell walls through a non-metabolic process. Cations in the soil bind to the negative charges of apoplasm due to the carboxylic groups of pec-tins, whereas anions are repelled. Divalent cations such as Ca2+are
preferentially bound to these cations-exchange sites and plant species differ considerably in this capacity according to the carboxylic groups located in cell walls (Marschner, 1995).
https://doi.org/10.1016/j.foodchem.2018.09.116
Received 12 February 2018; Received in revised form 18 September 2018; Accepted 19 September 2018
⁎Corresponding author.
E-mail address:[email protected](A.E. Rato).
Available online 20 September 2018
0308-8146/ © 2018 Elsevier Ltd. All rights reserved.
The concentration of minerals in grapes is influenced by maturity, variety, type of soil and climactic conditions during grape growth (Versari, Laurie, Ricci, Laghi, & Parpinello, 2014). In spite of the wine calcium content being a limiting factor to the use of alginate beads, there is a lack of rapid methods to evaluate calcium in wine. Some chemistry methods have been widely applied for calcium content de-termination in base wine, such as atomic absorption spectrophotometry (AAS) (Olalla et al., 2002) and cell inductively coupled plasma ( Baluja-Santos, Gonzalez-Portal, & Bermejo-Martinez, 1984). These methods have some disadvantages being destructive, time consuming, laborious, costly and require complex and professional laboratory operations. Regardless of the disadvantages, the method of choice for calcium de-termination in wine is AAS due to its precision, accuracy and versatility. In its classification of official methods of analysis, the Office Internatinal de la Vigne et du Vin (2012) recommends the direct method by AAS where calcium is quantified directly in wine. This technique has been questioned by some authors (Grindlay et al., 2011; Olalla et al., 2002) who have emphasized the disadvantages of this technique related to wine matrix effects. Non-spectral interferences due to the presence of ethanol, the absorbance enhancement of some al-kaline elements due to K, as well as the lower absorbance of Ca due to the presence of anions, are some of the potential wine matrix effects (Olalla et al., 2002). In substitution of direct methods for wine analysis, some researchers have proposed a dry mineralization treatment of the samples before the determination of the elements in wine, since wine organic components are efficiently decomposed, and the wine matrix effects are then reduced (Grindlay et al., 2011).
In viticulture, some of the most widely used spectral techniques involve ultra-violet and visible (UV–Vis) spectrometry. UV–Vis covers the range from 200 to 780 nm and is frequently used to detect pigments (Cejudo-Bastante, Rivero-Granados, & Heredia, 2017), organic acids (Pereira, Reis, Saraiva, & Marques, 2011) and phenolic compounds in wine (Aleixandre-Tudo, Nieuwoudt, Olivieri, Aleixandre, & du Toit, 2018; Boulet, 1985). More recently other spectroscopic techniques have attracted attentions from researchers and commercial organizations such as Fourier-transformed infrared (FT-IR) and Raman spectroscopy. Briefly, these spectroscopic techniques rely on the interpretation of absorption spectra from different analytes that are a unique reflection of their composition and molecular structure. Some frequencies of molecular vibrations occur in the IR region including those generated from CeH; C]O; OeH; NeH and other functional groups (Cozzolino, Dambergs, Janik, Cynkar, & Gishen, 2006). Consequently, and ac-cording toCozzolino et al. (2008), the estimation of minerals in wine by NIR spectroscopy is mainly dependent on the presence of these minerals in wine organic compounds. The combination of vibrational spectro-scopy and the multivariate data analysis provides calibration models which correlates the spectral response of a sample to its compositional profile (Musingarabwi, Nieuwoudt, Young, Eyéghè-Bickong, & Vivier, 2016). Correlative methods based in Fourier-transformed infrared (FT-NIR) spectroscopy have been used to predict quality in grapes and wine (Cozzolino et al., 2006; Martelo-Vidal, Domínguez-Agis, & Vázquez, 2013; Martelo-vidal & Vázquez, 2014; Musingarabwi et al., 2016; Porep, Mattes, Pour Nikfardjam, Kammerer, & Carle, 2015; Schmitt, 2014; Teixeira dos Santos, Páscoa, & Lopes, 2017). Also Fourier-trans-formed middle infrared (FT-MIR) spectroscopy has been used to monitor the red wine fermentation quality (Di Egidio, Sinelli, Giovanelli, Moles, & Casiraghi, 2010; Urtubia, Pérez-correa, Pizarro, & Agosin, 2008) and to quantify anthocyanins in wine ( Romera-Fernández et al., 2012). In wine industry, Raman spectroscopy is much less explored than FT-NIR or FT- MIR (Martin et al., 2015; Meneghini et al., 2008; Teixeira dos Santos et al., 2018) due to the lower sensitivity of this technique (Teixeira dos Santos et al., 2017).
Vibrational spectroscopy is also very sensitive to external inter-ferences and spectra data can be affected by undesirable systematic noise due to temperature, light scattering or background noise, which can invalidate the construction of accurate statistical models (Teixeira
dos Santos et al., 2017). Prior to calibration, pre-processing methods will be performed to raw spectra in order to obtain the best calibration model. In wine industry several pre-treatments have been used such as standard normal variate (SNV); smoothing (Sauvage, Frank, Stearne, & Millikan, 2002); multiplicative scatter correction (MSC) (Pereira et al., 2011); and derivative transformations (Di Egidio et al., 2010; Martelo-Vidal et al., 2013).
The partial least squares regression (PLSR) method (Wold, Sjostrom, & Eriksson, 2001) is a multivariate regression technique heavily used in spectroscopic data analysis of wine studies (Pereira et al., 2011; Pôças, Rodrigues, Gonçalves, Costa, and Gonçalves, 2015; Romera-Fernández et al., 2012; Teixeira dos Santos et al., 2017).
In spite of all the advances in spectroscopic technologies, the ex-isting published works on the use of FT-NIR spectroscopy to evaluate mineral elements in wine is limited. Calcium is one of the most common elements evaluated by NIR spectroscopy due to the high amount of this mineral element in plants and also because of its interaction in some food quality parameters, however this technique is still not a routine procedure to evaluate calcium content in wine.
In Portugal, Alentejo is an important wine and grapes production region where the majority of the soils have a high calcium content. The aim of this research was to develop an analytical method based on vi-brational spectroscopy (NIR) to predict calcium content in must and in wine. In wineries, prior knowledge of the must calcium content during the harvest period will be a great advantage, in order to prevent the mixture of musts with a higher value of this cation, in the same bin. Also, in base wine, the quantification of this cation with a faster and non-destructive methodology will save a significant amount of time in the evaluation of this important quality parameter.
2. Material and methods 2.1. Samples
Ninety-eight base white wine samples of 750 mL and sixty grape must samples were collected from a local winery in Alentejo in 2016. Spectroscopic measurements were made in all samples as well as in the corresponding references. Prior to spectral data collection, filtration was performed in grape must samples through a vacuum filter.
In order to assess the accuracy of the calibration model for calcium quantification in base wine and grape must produced in 2016, 10 samples of base wine and grape must produced in 2017 were used as an external validation set. The corresponding chemical reference analysis were also performed in 2017. After spectra collection, all base wine and must samples were subjected to a dry ashing mineralization procedure. 2.2. Dry ashing mineralization
This technique represents the most used approach for the miner-alization of the organic-based samples. All material and containers were glassware and were cleaned in a 10% (v/v) HNO3solution for at least
24 h and rinsed abundantly with ultrapure water before use.
For water and alcohol vaporization, 20 mL of wine samples were placed in a water bath at 100 °C during 50 min, crucibles with the re-sidues were pre-incinerated at 200 °C for vaporization of most of the organic compounds, and then introduced in a high-temperature muffle furnace and ashed at 500 °C. The temperature in the muffle oven was increased at a rate of approximately 30 °C/h and maintained at 500 °C during 6 h. The ashing procedure was based on the method described by Office Internatinal de la Vigne et du Vin (2012).
In grape must samples, an aliquot of 20 mL was placed in porcelain crucibles and pre-incinerated at 200 °C, introduced in a high-tempera-ture muffle furnace and ashed at 500 °C. The ashing process was the same as for the wine samples.
2.3. Determination of chemical composition of wine and grape must After muffle furnace incineration of the wine and must samples, 6 mL of 0.5 M hydrochloric acid (EMSURE®, 37% p.a.) was added to all samples and transferred into a digestion tube. Digestion proceeded at 140 °C in a dry bath (Selecta, thermostat dry-blocks) until solution became translucent. Samples were filtered (Whatman n° 542) and then brought to a final volume of 50 mL with ultrapure water (18.2 MΩcm−1) obtained from a Milli-Q Water System™ (Millipore,
Guyancourt, France). All reagents and solvents were of suprapure grade. Determination of calcium content in wines and grape must samples was performed by AAS (GBC, Avanta PM), according to (Office Internatinal de la Vigne et du Vin, 2012). Calcium was atomized in an air-acetylene flame with an air flow of 13.5 L/min and an acetylene flow of 2 L/min with a work head height of 0.2 mm. Absorbance was measured by using a 422.7 nm wavelength and a 1 nm slit width. The Ca concentration in each sample was calculated by comparison with a standard curve prepared with a standard solution of Ca using 9 con-centrations levels ranging from 1 to 200 mg/L. To correct the influence of phosphates, each digestion was diluted at 10% (v/v) with a solution containing 20% (v/v) of lanthanum chloride solution at 2.5% (w/v). Each sample was analysed in triplicate.
According toPozo-Bayón, Martínez-Rodríguez, Pueyo, & Moreno-Arribas (2009) physicochemical parameters were evaluated in wine samples to attest that healthy and good vinification practices were applied.
2.4. FT-NIR spectra acquisition and processing
Prior to chemical analysis, spectra were acquired from wine and grape must samples with a laminar 5030 NIR Analyzer (Brimrose Corporation, Baltimore, USA), equipped with a transflectance post dispersive optical configuration and InGaAs (1100–2300 nm) detector, based on the Acousto-Optical Tunable Filter (AOTF) NIR principle. Prior to spectra acquisition and to verify the spectrometer performance, a series of tests were undertaken: wavelength accuracy, wavelength repeatability, sample noise test, reference noise test and internal sen-sors test. For the accuracy-repeatability tests, polystyrene was used as a reference material. These tests were performed with a bandwidth in-terval of 0.00001; a bandwidth factor of 1.0, a standard deviation for peak position < 0.05 nm and considering a peak shift value < 1.5 nm. Maximum acceptable noise level for sample noise test was 150 RMS µ A.U. and maximum acceptable noise level for the reference noise test was 150 RMS µ A.U. Internal sensors were tested to ensure that all measured sensors voltage was within limits.
After acquisition, the spectral data was converted to absorbance (log (1/R)), the logarithm of the reciprocal of reflectance. The spectra ac-quisition was performed under laboratory conditions at room tem-perature of 20 °C. Samples were taken from 4 °C storage and placed in the laboratory until reaching 20 °C according toCozzolino et al. (2006). The spectral acquisition and instrument control were performed by SNAP 2.03 software (Brimrose, Crop, Baltimore, MD, USA). The in-strument's liquid probe accessory was used. The probe was in stainless steel, equipped with an adjustable pathlength adaptor and it was used for a pathlength of 2 mm. Each sample spectrum was collected in a scanning range of 1100–2300 nm with wavelength increments of 1 nm and 250 spectra per sample which merged in a single spectrum mea-surement for further elaboration.
The FT-NIR spectra were exported to The Unscrambler software (version 10.4, Camo, ASA, Oslo, Norway) for chemometric analysis. The Partial Least Squares Regression (PLSR) was the selected algorithm for the chemometric analysis (Wold, Sjostrom, & Eriksson, 2001).
The calibration process was obtained from the spectra data after the application of spectral pre-processing techniques to reduce the external interferences. Several pre-processing techniques were applied in order to achieve the maximum accuracy and reliability for the prediction
model: base line correction, standard normal variate (SNV), multi-plicative scatter correction (MSC), 1st derivatives using Savitzky-Golay derivative algorithm (Di Egidio et al., 2010). For PLSR, samples were split into two sets: 70% of the samples represented the training set for the prediction model, and 30% of the samples, the test set for validation (Błażewicz, 2003). The PLSR was computed up to 10 components and the optimum number of components will be selected. The number of selected components will be done in a way that minimizes the predic-tion error and these components will be used for the predicpredic-tion model instead of the original spectra (Wold et al., 2001).
Thus, in order to obtain the best calibration models, a total of 103 base wine samples were divided as follows: 75 samples, which re-presented the calibration set and the remaining 28 samples made up the validation set, where the calibration set was also subjected to cross-validation. Similarly, of the total of 75 samples of the grape must, 56 represented the calibration set, and the 19 remaining samples made up the validation set, whereby the calibration set was also subjected to cross-validation. The quantitative measure for the predictive accuracy of the model is evaluated by the root mean square error for the diction (RMSEP) and the preciseness with which the samples are pre-dicted through the cross-validation set is defined by the root mean square of cross-validation (RMSECV). Also, the coefficient of determi-nation (R2) was evaluated, which is an excellent accuracy indicator of
the model and it represents the proportion of the variance in the de-pendent variable that is predictable from the indede-pendent variable (Aleixandre-Tudo et al., 2018).
Also, RPD (Residual predictive Deviation) is a useful parameter that is applied to evaluate the quality of validation results. The higher the value of RPD the greater the robustness of the model. Models with RPD values greater than 2 are recommended for screening purposes, greater than 3 are good for prediction and values greater than 5 are re-commended for quality control (Versari et al., 2014).
3. Results and discussion
All sparkling wine samples showed enological parameters within the ranges established by Portuguese regulations for sparkling wines (data not shown). The results of the enological parameters, according to Pozo-Bayón et al. (2009), indicate that the grapes used were healthy and that good vinification practices were applied. Wine samples also presented a high variability related to calcium concentration, which is essential to develop robust prediction models (Table 1).
The calcium quantification through AAS in grape musts and wine reached average values of 154.2 mg/L, and 112.0 mg/L, lower values were obtained byOlalla et al. (2002)who reported values of 90.0 mg/L and 82.3 mg/L for grape musts and wines, respectively. Calcium values obtained with AAS, in the studied wines, ranged between 62.8 and 238.1 mg/L, with similar values being found in the literature (Rodrı́guez Mozaz, Garcı́a Sotro, Garrido Segovia, & Ancı́n Azpilicueta, 1999). In fact, it is widely recognized that Alentejo produces musts with high calcium content which justifies the high values of this cation in base wine samples.
Table 1
Calcium content in calibration and validation sets (mg/L). Each mean re-presents the average of triplicate measurements.
Data sets Number Range Mean
Grape must Calibration 56 62.8–238.1 152 Validation 19 73.3–210.2 147.9 All 75 62.8–238.1 154.2 Wine Calibration 75 61.2–151.8 99 Validation 28 72.9–148.2 98 All 103 61.2–151.8 112
Two large absorption bands that correspond to O–H bonds around 1400 and 1900 nm, corresponding mainly to water and ethanol mole-cules and other residual molemole-cules with OeH bonds present in wine, are visible in the NIR spectrum of wine. Since both edges of the spectral range from 1100 to 2300 nm were removed in grape must and base wine samples, due to a high noise level in those regions, images were resized to the spectral range of 1200–2200 nm. In most cases, the whole spectrum range does not improve the model performance, since edges of wavelengths include irrelevant information (Wu & Sun, 2013).
In order to predict the calcium content of grape must and wine with a FT-NIR handheld device, different spectral pre-processing methodol-ogies were tested to remove any irrelevant information. For this pur-pose, a set of mathematical algorithms were applied: base line correc-tion, standard normal variate (SNV), multiplicative scatter correction (MSC), 1st derivative using the Savitzky-Golay algorithm (Fig. 1).
Spectral pre-processing techniques were applied to raw spectra and
seven regression models were developed using the four mathematical treatments listed above, both isolated and combined (Table 2). A model with the raw spectra, without a pre-processing procedure, was also studied.
The required number of latent variables (LV), or components, cor-responds to the first minimum value of the predicted residual error sum of squares (PRESS). From that value onwards, other lower PRESS values occur. Nonetheless, and according to Wold et al. (2001), the in-corporation of new LV does not explain any further variation and contributes to over-fitting models.
It should be noted that spectra from modern spectrometers equipped with an InGaAs detector may have absorbance values up to 2,5. In fact, this kind of detector ensures the linearity in whole working wavelength range. Absorbance values higher than 2,5 are characterized by very small light intensities and consequently the resulting signals contain more noise and should not be used (Porep et al., 2015).
Considering all pre-processing methods in grape must samples, the best results were obtained using first derivative followed by SNV which is justified by the lowest RMSECV and RMSEP values and the highest R2
value (0.935) (Table 2). According toRoussel, Preys, Chauchard, and Lallemand (2014), andRodriguez-Saona, Fry, McLaughlin, & Calvey, (2001), the SNV pre-treatment is the method which allows for the correction of the pathlength variation and limit the spectral intensity variation problem, and as such improving the signal-to-noise ratio and correcting the nonlinear light scattering effects. According toNicolai et al. (2007), scattering results from multiple refractions at phase changes inside the analyzed material. In grape must, the suspended particles inside the must samples may also induced scattering at particle surface. Also, for wine samples spectra, the best pre-treatment was the base line correction and the calculation of the first derivate through the Savitzky-Golay algorithm. This pre-processing technique uses a smoothing of the spectra prior to calculating the derivative in order to decrease the detrimental effect on the signal-to-noise ratio which im-proves a subsequent linear calibration model (Nicolai et al., 2007).
The PLSR model for calcium determination in base wine showed RMSECV and RMSEP values of 3.311 mg/L, 3.053 mg/L, respectively (Table 2). The PLSR model for calcium quantification in grape must exhibited RMSECV and RMSEP values of 6.960 mg/L and 6.284 mg/L for calibration and prediction sets, respectively. A good model should have a high R2, a low RMSECV, a low RMSEP and a small difference
between RMSECV and RMSEP (Aleixandre-Tudo et al., 2018). Same differences between RMSEP and RMSECV were obtained by Aleixandre-Tudo et al. (2018), which indicated robust and accurate calibrations.
To illustrate the model robustness, predicted values are plotted
Fig. 1. NIR spectra of all wine samples with some of the pre-processing methods applied. A – Base line correction; B – Frist derivate with Savitzky-Golay algo-rithm; C – Frist derivate with Savitzky-Golay algorithm followed by Standard Normal Variate (SNV).
Table 2
Statistics for calibration and validation models for calcium (mg/L) in grape must and wine samples using FT–NIR spectra and PLSR algorithm.
Calibration Validation
Spectral pre-processing VL R2 RMSCV Bias R2 RMSEP RPD Grape Must
Raw 7 0.796 14.327 0.064 0.782 14.463 1.64
SNV 7 0.861 11.996 0.026 0.850 12.065 2.52
MSC 7 0.845 13.095 0.031 0.840 13.314 1.95
Base line c./1st derivative 7 0.907 9.556 0.017 0.895 9.756 3.21 1st derivative/SNV 7 0.935 6.960 0.003 0.936 6.284 4.39 1st derivative/MSC 7 0.901 10.65 0.018 0.887 10.723 3.09 1st derivative/SNV/MSC 7 0.913 8.652 0.008 0.910 0.920 3.92 Wine Raw 9 0.895 12.621 0.095 0.840 12.953 1.89 SNV 9 0.786 13.752 0.099 0.763 14.006 1.74 MSC 9 0.724 14.650 0.163 0.723 14.985 1.63
Base line c./1st derivative 9 0.956 3.311 0.006 0.963 3.053 5.19 1st derivative/SNV 7 0.943 4.651 0.019 0.937 4.609 5.1 1st derivative/MSC 7 0.925 8.016 0.033 0.914 8.021 4.26 1st derivative/SNV/MSC 7 0.937 6.351 0.026 0.925 6.925 4.62
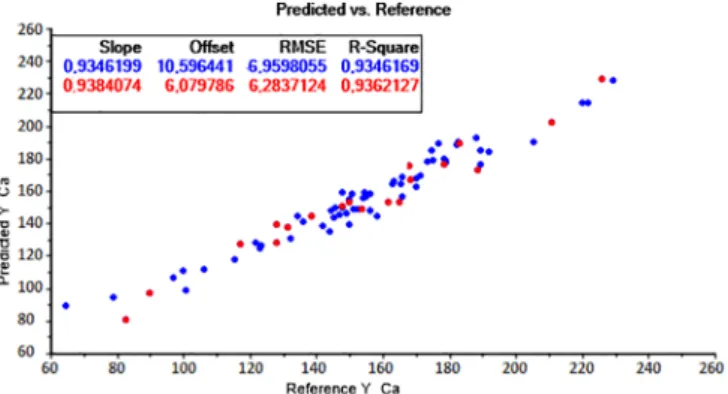
against measured values. InFigs. 2 and 3, measured vs predicted values of calcium content (mg/L) in grape must and base wine are shown re-spectively.
In base wine, the best correlation for calcium content, between measured and predicted data showed an R2of 0.956 (Table 2) which
attested a more robust calibration model compared with the model obtained from grape must spectra with an R2of 0.935. Models are
ro-bust when the prediction accuracy is relatively insensitive to unknown changes of external factors. In these experimental conditions the de-termination of calcium in base wine showed a more accurate prediction compared to grape must. However, both models have an RPD higher than 3 which means that both have an excellent prediction accuracy (Nicolai et al., 2007; Versari et al., 2014).
The RPD of the model for the prediction of calcium in wine and grape must was of 5.19 and 4.39, respectively (Table 2). Higher RPD
values suggest that FT-NIR–PLSR prediction models for calcium content can be used for quantitative analysis of specific samples in a laboratory or in industry. Also, according to Fagan, Everard, and McDonnell (2011), a model is considered good enough to monitor the quality of individual samples when the R2is greater than 0.90 and the RPD is
greater than 3.
The calibration models of calcium quantification in base wine and in grape must obtained with 2016 samples were also validated with samples from 2017 (Table 3). The coefficient of determination of ob-served vs predicted values (data not shown), of grape must and base wine, was 0.999 and 0.997 respectively. So it can be concluded that the calibration model to quantify calcium in wine and grape must provide significant identical data with samples from different years.
During harvest period, must separation according to its calcium content will be an important step in order to control the calcium levels in base wine in the future.
4. Conclusions
The results confirmed the ability of FT-NIR to predict calcium content in grape must and base wine. The models obtained can be ap-plied for general screening and rapid quality estimation. The high cal-cium levels in grape must and wine found in this study emphasizes the need for a rapid and reliable technique to quantify calcium. In the near future it should be possible to create an operating structure during harvest to separate white grapes according to their calcium content to avoid combining grapes with high calcium levels in a single fermen-tation vat. The existence of alternative analytical methods that can be fast and able to faithfully reproduce the results obtained through the reference method is an important acquisition to any wine industry. Acknowledgments
The authors acknowledge the collaboration of Adega de Borba winery for supplying samples and the assistance of the technical staff. This study was supported by FEDER and by National funds through the Programa Operacional Regional ALENTEJO 2020 (ALT20-03-0145-FEDER-000005 – Eficiência da tecnologia NIR para avaliação da maturação e qualidade de frutos). This work was also funded by National Funds through FCT – Foundation for Science and Technology under the Project UID/AGR/00115/2013.
We would like to express our gratitude to Dra. Astrid Inverno Bishop for her valuable contribution in the English language correction of this final document.
References
Aleixandre-Tudo, J. L., Nieuwoudt, H., Olivieri, A., Aleixandre, J. L., & du Toit, W. (2018). Phenolic profiling of grapes, fermenting samples and wines using UV-Visible spectroscopy with chemometrics. Food Control, 85, 11–22.https://doi.org/10.1016/j. foodcont.2017.09.014.
Baluja-Santos, C., Gonzalez-Portal, A., & Bermejo-Martinez, F. (1984). Evolution of ana-lytical methods for the determination of calcium and magnesium in wines a review*. Analyst, 109, 797–808.
Blazewicz, J., Kubiak, W., Morzy, T., & Rusinkiewicz, M. (2003). Handbook on data management in information systems. Springer Berlin Heidelberg.
Boulet, J. (1985). Ultraviolet spectroscopy study of phenolic substances and other major compounds in red wines : Relationship between astringency and the concentration of phe-nolic substances (pp. 1–7). .https://doi.org/10.1111/ajgw.12265.
Cejudo-Bastante, M. J., Rivero-Granados, F. J., & Heredia, F. J. (2017). Improving the color and aging aptitude of Syrah wines in warm climate by wood–grape mix ma-ceration. European Food Research and Technology, 243(4), 575–582.https://doi.org/ 10.1007/s00217-016-2767-0.
Cozzolino, D., Dambergs, R. G., Janik, L., Cynkar, W. U., & Gishen, M. (2006). Analysis of grapes and wine by near infrared spectroscopy. Journal of Near Infrared Spectroscopy, 14(5), 279–289.https://doi.org/10.1255/jnirs.679.
Cozzolino, D., Kwiatkowski, M. J., Dambergs, R. G., Cynkar, W. U., Janik, L. J., Skouroumounis, G., & Gishen, M. (2008). Analysis of elements in wine using near infrared spectroscopy and partial least squares regression. Talanta, 74(4), 711–716.
https://doi.org/10.1016/j.talanta.2007.06.045.
Di Egidio, V., Sinelli, N., Giovanelli, G., Moles, A., & Casiraghi, E. (2010). NIR and MIR Fig. 2. Calibration (blue) vs. validation (red) values of the calcium (mg/L) in
grape must based on NIR spectra. (For interpretation of the references to colour in this figure legend, the reader is referred to the web version of this article.)
Fig. 3. Calibration (blue) vs. validation (red) values of the calcium (mg/L) in base wine based on NIR spectra. (For interpretation of the references to colour in this figure legend, the reader is referred to the web version of this article.) Table 3
Reference and predicted values of grape must and base wine of 2017 samples.
Grape must (mg/L) Base wine (mg/L)
Reference Predicted Reference Predicted
67.02 68.41 62.68 63.10 83.25 81.62 80.27 78.63 100.03 98.72 90.52 92.00 113.21 115.36 110.42 108.45 131.86 129.01 135.90 136.06 104.53 105.09 145.65 147.14 191.02 192.19 150.47 150.43 200.26 200.95 88.24 89.65 205.644 203.52 120.01 121.38 210.74 211.77 114.75 113.03
spectroscopy as rapid methods to monitor red wine fermentation. European Food Research and Technology, 230(6), 947–955. https://doi.org/10.1007/s00217-010-1227-5.
Fagan, C. C., Everard, C. D., & McDonnell, K. (2011). Prediction of moisture, calorific value, ash and carbon content of two dedicated bioenergy crops using near-infrared spectroscopy. Bioresource Technology, 102(8), 5200–5206.https://doi.org/10.1016/j. biortech.2011.01.087.
Funami, T., Fang, Y., Noda, S., Ishihara, S., Nakauma, M., Draget, K. I., ... Phillips, G. O. (2009). Rheological properties of sodium alginate in an aqueous system during ge-lation in rege-lation to supermolecular structures and Ca2+ binding. Food Hydrocolloids, 23(7), 1746–1755.https://doi.org/10.1016/j.foodhyd.2009.02.014.
Genisheva, Z., Teixeira, J. A., & Oliveira, J. M. (2014). Immobilized cell systems for batch and continuous winemaking. Trends in Food Science and Technology, 40(1), 33–47.
https://doi.org/10.1016/j.tifs.2014.07.009.
Grindlay, G., Mora, J., Gras, L., & de Loos-Vollebregt, M. (2011). Atomic spectrometry methods for wine analysis: A critical evaluation and discussion of recent applications. Analytica Chimica Acta, 691(1–2), 18–32.https://doi.org/10.1016/j.aca.2011.02. 050.
Huang, X. M., Huang, H. B., & Wang, H. C. (2005). Cell walls of loosening skin in post-veraison grape berries lose structural polysaccharides and calcium while accumulate structural proteins. Scientia Horticulturae, 104(3), 249–263.https://doi.org/10.1016/ j.scienta.2004.09.002.
Marschner, H. (1995). In A. P. Limited (Ed.). Mineral nutrition of higher plants. Academic Press Limited.
Martelo-Vidal, M. J., Domínguez-Agis, F., & Vázquez, M. (2013). Ultraviolet/visible/near-infrared spectral analysis and chemometric tools for the discrimination of wines between subzones inside a controlled designation of origin: A case study of Rías Baixas. Australian Journal of Grape and Wine Research, 19(1), 62–67.https://doi.org/ 10.1111/ajgw.12003.
Martelo-vidal, M. J., & Vázquez, M. (2014). Evaluation of ultraviolet, visible, and near infrared spectroscopy for the analysis of wine compounds. Czech Journal of Food Science, 32(1), 37–47.
Martin, C., Bruneel, J. L., Guyon, F., Médina, B., Jourdes, M., Teissedre, P. L., & Guillaume, F. (2015). Raman spectroscopy of white wines. Food Chemistry, 181, 235–240.https://doi.org/10.1016/j.foodchem.2015.02.076.
Meneghini, C., Caron, S., Poulin, A. C. J., Proulx, A., Émond, F., Paradis, P., ... Fougères, A. (2008). Determination of ethanol concentration by Raman spectroscopy in liquid-core microstructured optical fiber. IEEE Sensors Journal, 8(7), 1250–1255.https:// doi.org/10.1109/JSEN.2008.926172.
Musingarabwi, D. M., Nieuwoudt, H. H., Young, P. R., Eyéghè-Bickong, H. A., & Vivier, M. A. (2016). A rapid qualitative and quantitative evaluation of grape berries at various stages of development using Fourier-transform infrared spectroscopy and multi-variate data analysis. Food Chemistry, 190, 253–262.https://doi.org/10.1016/j. foodchem.2015.05.080.
Nicolai, B. M., Beullens, K., Bobelyn, E., Peirs, A., Saeys, W., Theron, K. I., & Lammertyn, J. (2007). Nondestructive measurement of fruit and vegetable quality by means of NIR spectroscopy: A review. Postharvest Biology and Technology, 46(2), 99–118.
https://doi.org/10.1016/j.postharvbio.2007.06.024.
Office Internatinal de la Vigne et du Vin. (2012). C Ompendium of International Methods. Paris.
Olalla, M., González, M. C., Cabrera, C., Gimenez, R., López, M. C., Gonzlez, M. C., ... Lopez, M. C. (2002). Optimized determination of calcium in grape juice, wines, and other alcoholic beverages by atomic absorption spectrometry. Journal of AOAC International, 85(4), 960–966.
Pereira, A. C., Reis, M. S., Saraiva, P. M., & Marques, J. C. (2011). Madeira wine ageing prediction based on different analytical techniques: UV-vis, GC-MS, HPLC-DAD. Chemometrics and Intelligent Laboratory Systems, 105(1), 43–55.https://doi.org/10.
1016/j.chemolab.2010.10.009.
Pôças, I., Rodrigues, A., Gonçalves, S., Costa, P. M., & Gonçalves, I. (2015). Predicting grapevine water status based on hyperspectral reflectance vegetation indices (pp. 16460– 16479). .https://doi.org/10.3390/rs71215835.
Porep, J. U., Mattes, A., Pour Nikfardjam, M. S., Kammerer, D. R., & Carle, R. (2015). Implementation of an on-line near infrared/visible (NIR/VIS) spectrometer for rapid quality assessment of grapes upon receival at wineries. Australian Journal of Grape and Wine Research, 21(1), 69–79.https://doi.org/10.1111/ajgw.12120.
Pozo-Bayón, M.Á., Martínez-Rodríguez, A., Pueyo, E., & Moreno-Arribas, M. V. (2009). Chemical and biochemical features involved in sparkling wine production: From a traditional to an improved winemaking technology. Trends in Food Science and Technology, 20, 289–299.https://doi.org/10.1016/j.tifs.2009.03.011. Rodriguez-Saona, L. E., Fry, F. S., McLaughlin, M. A., & Calvey, E. M. (2001). Rapid
analysis of sugars in fruit juices by FT-NIR spectroscopy. Carbohydrate Research, 336(1), 63–74.https://doi.org/10.1016/S0008-6215(01)00244-0.
Rodríguez Mozaz, S., García Sotro, A., Garrido Segovia, J., & Ancín Azpilicueta, C. (1999). Influence of decantation of viura must on the cation content. Evolution during wine fermentation and stabilization. Food Research International, 32(10), 683–689.https:// doi.org/10.1016/S0963-9969(99)00147-7.
Romera-Fernández, M., Berrueta, L. A., Garmón-Lobato, S., Gallo, B., Vicente, F., & Moreda, J. M. (2012). Feasibility study of FT-MIR spectroscopy and PLS-R for the fast determination of anthocyanins in wine. Talanta, 88, 303–310.https://doi.org/10. 1016/j.talanta.2011.10.045.
Roussel, S., Preys, S., Chauchard, F., & Lallemand, J. (2014). Process analytical technology for the food industry (pp. 7–17). .https://doi.org/10.1007/978-1-4939-0311-5. Sauvage, L., Frank, D., Stearne, J., & Millikan, M. B. (2002). Trace metal studies of
se-lected white wines: An alternative approach. Analytica Chimica Acta, 458(1), 223–230.https://doi.org/10.1016/S0003-2670(01)01607-5.
Schmitt, S. (2014). Determination of the mineral composition of foods by infrared spec-troscopy: A review of a green alternative. Critical Reviews in Analytical Chemistry, 8347(March 2015), 37–41.https://doi.org/10.1080/10408347.2013.835695. Teixeira dos Santos, C. A., Páscoa, R. N. M. J., & Lopes, J. A. (2017). A review on the
application of vibrational spectroscopy in the wine industry: From soil to bottle. TrAC Trends in Analytical Chemistry, 88, 100–118.https://doi.org/10.1016/j.trac.2016.12. 012.
Teixeira dos Santos, C. A., Páscoa, R. N. M. J., Porto, P. A. L. S., Cerdeira, A. L., González-Sáiz, J. M., Pizarro, C., & Lopes, J. A. (2018). Raman spectroscopy for wine analyses: A comparison with near and mid infrared spectroscopy. Talanta, 186(January), 306–314.https://doi.org/10.1016/j.talanta.2018.04.075.
Urtubia, A., Pérez-correa, J. R., Pizarro, F., & Agosin, E. (2008). Exploring the applic-ability of MIR spectroscopy to detect early indications of wine fermentation pro-blems. Food Control, 19(4), 382–388.https://doi.org/10.1016/j.foodcont.2007.04. 017.
Velings, N. M., & Mestdagh, M. M. (1995). Physico-chemical properties of alginate gel beads. Polymer Gels and Networks, 3(3), 311–330. https://doi.org/10.1016/0966-7822(94)00043-7.
Versari, A., Laurie, V. F., Ricci, A., Laghi, L., & Parpinello, G. P. (2014). Progress in authentication, typification and traceability of grapes and wines by chemometric approaches. Food Research International.https://doi.org/10.1016/j.foodres.2014.02. 007.
Wold, S., Sjostrom, M., & Eriksson, L. (2001). PLS-Regression. A Basic Tool of Chemometrics, 109–130.
Wu, D., & Sun, D.-W. (2013). Advanced applications of hyperspectral imaging technology for food quality and safety analysis and assessment: A review — Part I: Fundamentals. Innovative Food Science & Emerging Technologies, 19, 1–14.https://doi.org/10.1016/j. ifset.2013.04.014.