Corresponding author Fernando A. F. Ferreira
E-mails: [email protected] or [email protected]
ENHANCING KNOWLEDGE AND STrATEGIC PLANNING OF
BANK CUSTOMEr LOYALTY USING FUZZY COGNITIVE MAPS
Fernando A. F. FERREIRAa, João J. M. FERREIRAb, Cristina I. M. A. S. FERNANDESc,Ieva MEIDUTĖ-KAVALIAUSKIENĖd, Marjan S. JALALIe
aISCTE Business School, BRU-IUL, University Institute of Lisbon, Avenida das Forças Armadas, 1649–026 Lisbon, Portugal
aFogelman College of Business and Economics, University of Memphis, Memphis, TN 38152–3120, USA bDepartment of Business and Economics & NECE Research Unit, University of Beira Interior,
Estrada do Sineiro, 6200–209 Covilhã, Portugal
cPolytechnic Institute of Castelo Branco & NECE Research Unit, Largo do Município, 6060–163 Idanha-a-Nova, Portugal & NECE Research Unit, Portugal dFaculty of Business Management, Vilnius Gediminas Technical University,
Saulėtekio al. 11, LT-10223 Vilnius, Lithuania
dBRU-IUL, University Institute of Lisbon, Avenida das Forças Armadas, 1649–026 Lisbon, Portugal eISCTE Business School, BRU-IUL, University Institute of Lisbon, Avenida das Forças Armadas,
1649–026 Lisbon, Portugal Received 05 June 2015; accepted 22 May 2016
Abstract. Understanding customer loyalty has been a growing concern for the services industry. In a context of increasing competitive pressures, such loyalty is seen as a key element in service companies’ success. Maintaining customer loyalty and identifying its underlying factors, however, are recognizably difficult to do. Grounded on the use of cognitive mapping techniques, this paper proposes a knowledge-based framework for the identification of the key determinants of customer loyalty, and the relationships among them. A step-by-step guide to the development of such a framework is presented, and illustrated through a practical application in the banking context. The resulting findings are supportive of the applicability of such methods for understanding customer loyalty, and the improvement of long-term relationships with customers. They are furthermore indicative of new ways in which knowledge can be incorporated into management activities to improve service outcomes. Some managerial implications of our contribution and avenues for future research are also reported.
Keywords: customer loyalty, fuzzy cognitive mapping, knowledge enhancement, problem struc-turing, service improvement.
JEL Classification: C44, G20, M10.
Copyright © 2017 Vilnius Gediminas Technical University (VGTU) Press http://www.tandfonline.com/TTED
2017 Volume 23(6): 860–876 doi:10.3846/20294913.2016.1213200
Introduction
Consistently considered “hot topics” in service industries, service quality and customer loy-alty have long been recognized as critical driving forces of business performance for firms wishing to gain sustainable competitive advantages (cf. Amin et al. 2011; Lee, Chulhyun 2014; Ferreira et al. 2015a). And in the current context of generalized macroeconomic recessions, increased competition, and every more informed and demanding customers, these issues have arguably achieved unprecedented levels of importance.
Identifying the factors that most contribute to creating and maintaining service qual-ity and customer loyalty, however, is notoriously difficult. These are subjective matters and depend on a variety of multi-faceted variables, which greatly complicates decision making and choices with regard to the most effective means of strengthening this loyalty (Salinas, Schinzano 2014; Jalali et al. 2016). Furthermore, customer loyalty is only one of many factors upon which firm profitability is likely to depend.
At the same time, the increasing volatility and competitiveness of the business environ-ment have caused a wider shift in organizational priorities and concerns. Concerns over long term planning or top-down directives, for instance, are being replaced with preoccupations with organizational agility and employee involvement; and within this context, the issue of knowledge has risen to the forefront (Farquhar, Panther 2008; Ferreira et al. 2014). How can organizations, particularly those within the services industry, for which employee engagement and contact with customers is of notable concern, tap into the knowledge of their workers? And how can they provide the conditions for the continuous creation of new knowledge, and ensure its use and application for business success?
This paper aims to answer these questions and bring together these two inter-related concerns of understanding customer loyalty and creating and using knowledge; and proposes fuzzy cognitive maps (FCMs) as one way to address them.
Cognitive mapping has been widely applied to the treatment of complex decision problems (cf. Belton, Stewart 2002; Eden, Ackermann 2004; Ackermann 2012; Ferreira et al. 2014; Filipe et al. 2015); and FCMs in particular are considered “a well-established artificial intelligence technique, incorporating ideas from artificial neural networks and fuzzy logic, which can be effectively applied in the domain of management science” (Carlucci et al. 2013: 208).
As such, this paper aims to explore the applicability of these maps in supporting the iden-tification of key determinants of customer loyalty and enhancing the levels of transparency in the decision making processes related to these variables. By applying this methodology to bank customer loyalty in particular, we also aim to show that the use of FCMs can give rise to conceptually coherent and empirically valid knowledge-based frameworks to dynamically analyze and understand the reciprocal influence of key determinants of customer loyalty (in this case, within banks). From a practical point of view, such a framework can be used to strengthen current approaches to customer loyalty management, providing an indication as to which best practices could be followed to boost long-term relationships with custom-ers. To the best of our knowledge, the application of FCMs to enhance transparency and knowledge use in this context is a novel approach in the literature and, thus, this framework contributes to advance theory and empirical research on customer loyalty, service manage-ment and operational research.
The paper is structured as follows: the next section provides an overview of related work on customer loyalty, and then focuses on our application context (the banking industry) in particular. The following section presents the methodological background of our application; the ensuing section describes the steps followed for the construction of our FCM, highlighting the results obtained and presenting managerial recommendations; the final section presents concluding remarks and avenues for future research.
1. related work
Customer loyalty has been a fast growing concern for companies in the service industry. It is generally accepted that “loyal customers are more likely to concentrate on long-term benefits from the relationship and are more willing […] to develop mutual benefits than non-loyal customers are” (Martin et al. 2009: 589); and this, in turn, is expected to allow service companies to more effectively achieve their financial and business goals. Such loyalty-based market success is all the more likely when customers’ fealty stems from higher levels of satisfaction (cf. Dek-ker, Post 2000; Farquhar, Panther 2008; Amin et al. 2011; Ferreira et al. 2015b). According to Bayraktar et al. (2012: 99), “higher customer satisfaction and loyalty can lead to stronger competitive position resulting in larger market share and profitability”.
The importance and increasing focus on customer loyalty notwithstanding, it is also generally recognized that, due to the unique features of services (e.g. intangibility, inseparabil-ity of production and consumption, and heterogeneinseparabil-ity), the evaluation of customer loyalty in this domain is particularly difficult and complex (Jalali et al. 2016). Finding novel ways to understand and measure customer loyalty in the services, then, is of particular interest. Academically, it would advance our understanding of customer loyalty and its determinants; and in practical terms, such advances can provide managers with more directed insights as to how to increase their customers’ attachment and loyalty to their services. Mihelis et al. (2001: 347) note the importance of identifying the factors underlying customer loyalty, since these determinants offer “an immediate, meaningful and objective feedback about clients’ preferences and expectations”, which can in turn provide firms with better decision support mechanisms and the potential for better portfolio management (see also Nadiria et al. 2009).
Understanding the determinants that most contribute to customer loyalty can allow service companies to: (1) understand and target customers; (2) anticipate customer needs and preferences; (3) define a suitable business profile for each customer; (4) adapt promo-tional campaigns to customer needs; (5) be aware of the profitability of each customer; and (6) increase the degree of appropriateness and intervention of client account managers (for discussion, see Salinas, Schinzano 2014; Jalali et al. 2016).
Given the importance of customer loyalty, it is not surprising that appreciable progress has taken place over the years in attempting to understand its determinants. Research has focused on variables such as: perceived service quality, perceived value, customer expectations, trust, switching cost and firm image (for an in-depth discussion, see Garland, Gendall 2004; Ehigie 2006; Manrai, L., Manrai, A. 2007; Vesel, Zabkar 2009; Yoon et al. 2010; Aghdaie et al. 2012; Bobâlcă et al. 2012; Dhebar 2013; Yoo, Bai 2013). Despite the undeniable merit of such research, it is worth noting that there is still room for more comprehensive representations of
the domain, and for frameworks able to incorporate decision makers’ own beliefs and con-victions. The conventional approaches typically applied to the study of customer loyalty are unable to do this, in effect leaving a large amount of knowledge in the organization untapped. Furthermore, most of the existing contributions show the end results, but do not explain why they emerge, or how they can be improved. Notable exceptions include Lee et al. (2010), who used a means-end chain approach to elaborate a hierarchical loyalty map; however, the result is nonetheless that there is still an array “of factors that limit a comprehensive understanding of customer loyalty and prevent the generalization of research findings” (Pan et al. 2012: 150).
Indeed, existing contributions do not put the discussion on the determinants of customer loyalty to rest and, as recognized by Hsieh (2004), the use of other modern approaches, such as neural networks and fuzzy logics, represents a promising avenue in this field of research. In this sense, there appears to be substantial scope to explore the use of fuzzy cognitive mapping to improve our understanding of the customer loyalty phenomenon, using the knowledge of those most directly involved with those customers in day-to-day operations.
The current paper thus aims to examine the applicability of fuzzy cognitive maps to our understanding of customer loyalty determinants, through a practical application to the banking sector. The significant challenges currently faced by the banking industry, make it a particularly pertinent context of analysis. Indeed, the most recent economic recession has greatly intensified competition among financial institutions (cf. Ferreira et al. 2012); and as a result, attracting and retaining customers, ensuring complementary margins and reducing lack of liquidity have become priority concerns for these institutions (cf. Hartman et al. 2001; Howcroft 2006; Minami, Dawson 2008; Ferreira et al. 2011; Kowalski, Shachmurove 2011; Amin et al. 2012).
Given that “bank branches are the primary place in which consumers have access to products for either building assets and/or obtaining credit” (Serna 2005: 2), this concern over customer loyalty culminates at the bank branch level, where front office employees are seen as a driving-force which can foster customer attraction and retention (cf. Bontis et al. 2007; Ferreira et al. 2011; Farahani 2012). As such, our implementation of fuzzy cognitive maps for the evaluation of bank customer loyalty was also centered at the bank branch level. The next section describes the theoretical foundation of the methodology used, followed by a step-by-step description of its illustrative application within banking.
2. Basics of fuzzy cognitive mapping
Cognitive maps have been recognized as important instruments for the structuring and cla-rification of complex decision situations (cf. Eden 2004; Ackermann et al. 2011; Ferreira et al. 2011; Carlucci et al. 2013). As stated by Gavrilova et al. (2013: 1758), “maps as visual tools facilitate the representation and communication, support the identification and the interpreta-tion of informainterpreta-tion, facilitate consultainterpreta-tion and codificainterpreta-tion, and stimulate mental associainterpreta-tions”. These maps are interactive, versatile, and perhaps most importantly, they foster discussion among decision makers, allowing for a better understanding of decision situations through recourse to participants’ existing knowledge and their joint creation of new insights.
Cognitive mapping became an even more powerful tool with the development of fuzzy cognitive maps (Kosko 1986, 1992), which have been extensively applied to a variety of different contexts and decision problems, sharing the common trait of complexity (e.g. Kim, Lee 1998; Stylios, Groumpos 1999; Tsadiras et al. 2003; Carvalho 2013; Ferreira et al. 2015a). In this type of maps, the relationships between criteria can be represented by positive and negative causality; the intensity of which is then translated into a number which can vary from –1 to 1. Specifically, all the values in the map can be fuzzy and, therefore, each concept has a state value Ai that can be a fuzzy value in the range [0, 1] or a bivalent logic in {0, 1}. Additionally, the weights of the relationships/arcs can be a fuzzy value within [–1, 1] or a trivalent logic within {–1, 0, 1}. As pointed out by Salmeron (2012) and Carlucci et al. (2013), the resulting map then allows for dynamism, by including feedback links between the criteria, as shown in Figure 1, where Ci is criterion i and Wij represents the extent to which criterion i influences criterion j. As discussed, this relationship (Wij) can be of positive, negative or null causality, depending on whether Ci causes a move in the same direction, the opposite direction or has no impact on Cj.
C1 CC22 C3 C4 C5 W12 W31 W14 W41 W52 W25 W54 W43 W 45 Fig. 1. Example of an FCM Source: Mazlack (2009: 5).
Behind this graphical representation, there is a mathematical background. As discussed by Mazlack (2009) and Carlucci et al. (2013), there is a 1 x n state vector A that includes the values of the n criteria; and a n x n adjacency matrix W that gathers the weights Wij of the interconnections between the n criteria. Kok (2009) states that non-zero values on the main diagonal might be considered, but the adjacency matrix usually presents all the entries of the main diagonal equal to zero, meaning that no criterion causes itself. The value of each criterion is influenced by the values of the interconnected criteria (with the appropriate weights) and by its previous value. The mathematics behind FCMs can be summarized in formulation (1), where Ai(t+1) is the activation level of criterion C
i at time t+1; Ai(t) is the activation level of
criterion Ci at time t; Aj(t) is the activation level of criterion C
j at time t; Wji is the weight of
the interconnection between both criteria; and f represents a threshold activation function:
( 1) ( ) ( ) 1 1 n t t t i i j ji j j A + f A A W ≠ = = + ⋅
∑
. (1)As explained by Mazlack (2009: 6), every criterion has a new value at every step of in-teraction, and “the new state vector Anew is computed by multiplying the previous state vector
Aold by the weight matrix W”. This means that the overall impact of a change in the value of
one criterion can be given by Anew. According to Carlucci et al. (2013: 213), “the resulting transformed vector is then repeatedly multiplied by the adjacency matrix and transformed until the system converges to a fixed point. Typically it converges in less than 30 simulation time steps”. The result is that: (1) the impact of changes in the value of any single criterion can be assessed; (2) the strength of variables’ impact on each other can be determined; and (3) “what-if” questions can be formulated, to ascertain the impact on the system as whole of changes in some variables and/or the addition/removal of criteria (for developments, see Kardaras, Mentzas 1997; Tsadiras et al. 2003; Yaman, Polat 2009; Salmeron 2012). Based on these considerations, “they [FCMs] have powerful and far-reaching consequences as a mathematical tool for modeling complex systems” (Mazlack 2009: 5), and we propose that there is substantial scope to explore their applicability to the issue of customer loyalty in the services. In particular, we examine and illustrate the application of FCMs in the context of bank customer loyalty.
3. Developing the map
In constructing an FCM, “using a group of experts has the benefit of improving the reliability of the final model” (Yaman, Polat 2009: 387), allowing expert knowledge to be tapped into. Although it is difficult to establish the number of members which should compose the ex-pert panel (Salmeron 2009), it has been indicated that “the consultant [i.e. researcher] will relate personally to a small number (say, three to ten persons)” (Eden, Ackermann 2001: 22). We therefore chose a number in between and constructed our FCM, during an intensive 7-hour group work session, with six experienced bank branch front office employees from the most well-known banks in Portugal. These panel members operate in the Central-West region of Portugal, and were selected based on their years of experience and willingness to participate. The session was conducted by a facilitator/researcher, accompanied by an as-sistant technician who was responsible for registering the results. Despite the specificity of the panel used in this study, the process followed can work well with any group of experts, from any industry. The methods used in this study, and their application to bank customer loyalty in particular, are process-oriented, and based on a constructivist and learning-based standpoint (cf. Ferreira et al. 2015a).
3.1. Identifying concepts and quantifying relationships
Given the decision makers’ limited availability, the group meeting started with a presentation of the research objectives and of the basic concepts related to FCMs, in order to avoid any potential misunderstandings. Given these initial clarifications, the operational phase of the process was started with the following trigger question: “Based on your own values and
pro-fessional experience, what are the factors/determinants that most influence customer loyalty?”. This question provided the starting point for the debate/negotiation among the experts, and allowed the “post-its technique” to be applied.
This technique consists of writing what the expert panel members consider as important concepts/determinants on post-its (i.e. one concept per post-it), and sticking those post-its on a large piece of paper. Grounded on permanent discussion, this procedure is repeated until the group reveals satisfaction with the number and depth of the concepts identified (see Ackermann, Eden 2001; Ferreira et al. 2015b; Filipe et al. 2015). In a second phase of the process, the post-its are then organized by segments or areas of concern (i.e. clusters), allowing for additional discussion and clarification regarding the significance of each criterion. In the final stage of the technique, each area of concern is then analyzed individually and the post-its are (re)organized following a means-end-based logic.
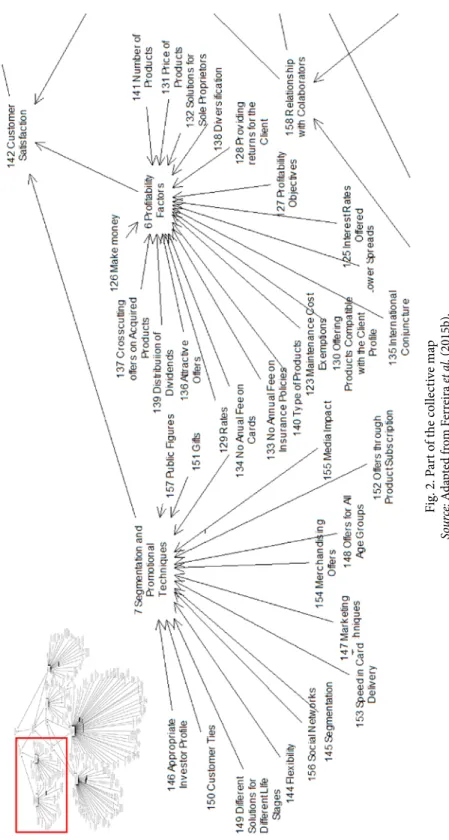
The process typically concludes with the decision makers’ agreement on the form and content of the map, which once it is consensual, is called the “collective” or “strategic” map. In this study, the conception of the map was supported by the Decision Explorer software (www.banxia.com), and the final outcome is (partially) illustrated in Figure 2 (a full and editable version of the map can be obtained from the corresponding author upon request).
Although the context-dependence of the conception of a cognitive map can be seen as a methodological limitation, this is arguably more than compensated by the experts’ direct involvement in its development, and the vast amounts of information and knowledge shared, discussed and created (Ferreira et al. 2012). Additionally, in this case, the map provided the participating decision makers with a holistic picture of bank customer loyalty, which allowed determinants typically omitted in previous research to be identified. The framework’s open-ness to continuous adjustments and updates (e.g. inclusion of new concepts) (Xue et al. 2010; Filipe et al. 2015) was considered extremely positive by the expert panel.
Aiming to dynamically analyze the cause-and-effect relationships previously identified in the cognitive map, the map was reconstructed with the support of the FCMapper (http:// www.fcmappers.net) and Pajek software (http://pajek.imfm.si/doku.php). The combination of these two software packages allowed the group to move forward in the construction of the FCM, namely in terms of the intensity of the relationships. Figure 3 illustrates the new form of the agreed collective map, where the numbers, for simplification purposes, represent the previously identified determinants (a full version using concept names instead of numbers can be obtained from the corresponding author upon request).
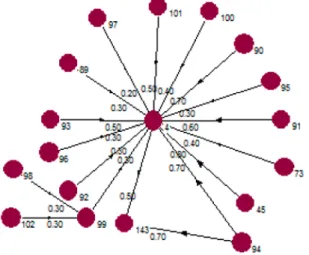
The group members were then asked to analyze the intensity of the relationships between criteria. Figure 4 exemplifies the analysis carried out for one of the segments (or clusters), where the intensity of each relationship was quantified and, as already pointed out, ranged from –1 to 1. The analysis was repeated for all the clusters and relationships identified.
Fig . 2. P ar t o f t he co lle ct iv e m ap So urc e: A da pt ed f ro m F er reira et a l. (2015b).
Fig . 3. [I ni tia l] S tr uc tur e o f t he FCM
Fig. 4. Quantification of relationships
The panel members were then asked to fill in an adjacency matrix (as described in Section 3) containing previously identified degrees of intensity. The final version of the map contained 158 interlinked determinants, resulting in a 158×158 weight matrix (which, naturally, cannot be displayed in this paper due to space constraints. The matrix can be obtained from the corresponding author upon request). This procedure served to promote additional discussion on the research outputs, and determined the basis for recommendations (see Salmeron 2009; Papageorgiou et al. 2012; Carlucci et al. 2013).
3.2. Interpreting the research outputs
The final version of our FCM was deeply discussed with and among the expert panel members, and as such represented the result of the negotiation among them, and agreement reached. Because it could have been different had the context or the experts involved been others, or had the session lasted longer, it is important to highlight that rather than a single formulaic answer, the results are aimed at encouraging discussion, while promoting knowledge devel-opment and a better understanding of the factors associated with (in this case) bank customer loyalty. As such, a battery of static and dynamic tests was carried out throughout the study; which “through a proper neural network computational model” allows us to get “an idea of the ranking of the variables in relationship to each other according to how the system is perceived in the FCM” (Carlucci et al. 2013: 216). From this premise, and based on the mathematical formulation presented in Section 2, Table 1 reveals the major determinants of bank customer loyalty that resulted from the concept interaction presented in our FCM.
All the determinants comprised in the FCM present a centrality index. However, due to the high number of concepts identified by the participating decision makers, Table 1 presents only those with the highest centrality indices. In particular, Collaborators’ Professional Training and Collaborators’ Personal Training appear to have a prominent role as driving forces of bank
customer loyalty, with centrality indices of 31.90 and 21.40 respectively. Albeit grounded on a different methodological basis, our findings allow the results of Arbore and Busacca (2009), Culiberg and Rojsek (2010), Lee et al. (2011) and Ferreira et al. (2015b) to be reinforced, namely in what refers to the crucial importance of human resources’ skills and relational quality in bank branch services.
It should be highlighted, however, that while most of the variables included in the map are not new, the completeness of our FCM allowed important details to be detected (e.g. no annual fee on cards – cf. Figure 2), which might otherwise go undetected. In this sense, and as Table 1 illustrates, the FCM developed offers a real insight into the variables which can improve bank customer loyalty, and thus also provides further empirical evidence that “FCMs are simple, yet powerful tools for modeling and simulation of dynamic systems, based on domain-specific knowledge and experience” (Papageorgiou et al. 2012: 45).
The direct extrapolation of our results should be treated with reservation (as discussed in the next subsection). However, it should be noted that, “from an Artificial Intelligence perspective, FCMs are supervised learning neural systems, where as more and more data is available to model the problem, the system becomes better at adapting itself and reaching a solution” (Salmeron 2009: 275). In this sense, our framework holds great potential for strategic planning and bank customer loyalty management.
3.3. Limitations and recommendations
The development of our FCM allowed the bank branch front office employees to: (1) identify the key determinants of bank customer loyalty; (2) engage in debate throughout the decision making process, thus sharing and co-creating knowledge; and (3) provide important insights about the driving forces and the key feedback loops in the system which can improve the understanding of service provision and bank customer loyalty.
Despite the fact that this type of knowledge basis seems to be increasingly needed in do-mains characterized as subjective and fuzzy, as is the case of customer loyalty of banks or other services, and that the system created allowed encouraging results to be achieved, it should be noted that this proposal is not without its own limitations. Due to their context-dependence and subjective nature, “FCM development methods are far from being complete and well-defined, mainly because of the deficiencies that are present in the underlying theoretical framework [...] the development of FCM models almost always relies on human knowledge [... and are] strongly Table 1. Major determinants of bank customer loyalty [based on centrality]
Concepts Reference Outdegree Indegree Centrality
Collaborators’ Professional Training 3 1.50 30.40 31.90
Collaborators’ Personal Training 2 1.30 20.10 21.40
Profitability Factors 6 0.80 11.80 12.60
Institutional Aspects 5 0.60 9.50 10.10
Segmentation and Promotional Techniques 7 0.70 7.90 8.60
depend on subjective beliefs of expert(s) from a given domain” (Stach et al. 2005: 372). However, as discussed before, these limitations are offset by the direct involvement of the decision makers, the amount of information discussed and the interactive nature of the procedures, which allow experiences to be shared and insights on the role of key feedbacks in the system to be identified, which might otherwise go undetected by statistical approaches alone (for further discussion, see Stach et al. 2010).
Conclusions and implications
Despite the significant progress achieved over the years in customer loyalty management, current available approaches fall short of comprehensively identifying the driving forces behind this phenomenon, or allowing decision makers to express their own convictions and even knowledge. From this premise, and assuming a non-prescriptive position, this paper aimed to propose and illustrate the application of FCMs to the identification of customer loyalty – in this case, in the context of banking. This methodological option resulted from the fact that FCMs are widely known as neuro-fuzzy systems able to incorporate experts’ knowledge, and model complex decision problems (Mazlack 2009).
The conception of an FCM using a panel of experts in our study allowed key determinants of bank customer loyalty to be identified in a comprehensive manner, which greatly reduced the number of omitted variables vis-a-vis conventional models for the identification of such determinants. This greater transparency was further facilitated by the large amounts of infor-mation discussed, processed and negotiated in the panel’s debates throughout the development of the FCM. Finally, the resulting knowledge-based framework provided relevant insights into bank customer loyalty, the processes driving it and how they feedback into the system.
As a result, the conception of an FCM in this study also provides empirical evidence that the use of such maps can support the identification of the determinants of customer loyalty and increase the transparency of the cause-and-effect relationships between them, thus holding great potential for strategic planning in, and the management of, service institutions. Although the managerial implications of FCMs can go far beyond the specific context of this study, the application of FCMs to this context is, to the best of our knowledge, a novel approach in the literature.
Because the procedures we have followed are context-dependent, our results are encour-aging but subjective in nature. This means that direct extrapolations of these results should be treated with caution. It should be recalled, however, that offsetting this drawback is the direct involvement of the participating decision makers, as well as the amount of informa-tion collected and discussed, which allowed experiences to be shared, and new knowledge to be created as determinants of customer loyalty and the relationships between them became better understood. The application of FCMs can thus be of practical consequence for manag-ers (within banks or in other industries) in the planning process of their business activity.
Future research might want to work toward the improvement of our knowledge-based framework. Specifically, it seems important to: (1) replicate this study in other service con-texts, to further illustrate the significant impact using FCMs can have in our understanding of customer loyalty; (2) design a panel study within a different country and/or other type of
participants to increase the generalizability; and (3) conduct a survey based on different panel studies to increase the reliability of the results. Improvements will strengthen the potential of our proposal.
Acknowledgements
A previous, non-copyrighted and less completed version of this paper was presented at the 2015 BAI International Conference, held in Macau, China, July 2015. The authors gratefully acknowledge the comments and improvement suggestions of the anonymous reviewers; and the superb contribution and infinite willingness of the panel members: Ana Luísa Morgado, António Neves, Bianca Viana, Erica Vaz, Joana Reis and João Aguiar. Support from the ISCTE Business School of the University Institute of Lisbon, Portugal, is also acknowledged.
references
Ackermann, F. 2012. Problem structuring methods “in the dock”: arguing the case for soft OR, European Journal of Operational Research 219(3): 652–658. https://doi.org/10.1016/j.ejor.2011.11.014
Ackermann, F.; Andersen, D.; Eden, C.; Richardson, G. 2011. ScriptsMap: a tool for designing multi-method policy-making workshops, Omega: The International Journal of Management Science 39(4): 427–434. https://doi.org/10.1016/j.omega.2010.09.008
Ackermann, F.; Eden, C. 2001. SODA – Journey making and mapping in practice, in J. Rosenhead, J. Mingers (Eds.). Rational analysis for a problematic world revisited: problem structuring methods for complexity, uncertainty and conflict. 2nd ed. John Wiley & Sons, Chichester, 43–60.
Aghdaie, S.; Sanayei, A.; Etebari, M. 2012. Evaluation of the consumers’ trust effect on viral marketing acceptance based on the technology acceptance model, International Journal of Marketing Studies 48(6): 79–94. https://doi.org/10.5539/ijms.v4n6p79
Amin, M.; Isa, Z.; Fontaine, R. 2011. The role of customer satisfaction in enhancing customer loyalty in Malaysian Islamic banks, The Service Industries Journal 31(9): 1519–1532.
https://doi.org/10.1080/02642060903576076
Amin, S.; Ahmad, U.; Hui, L. 2012. Factors contributing to customer loyalty towards telecommunication service provider, Procedia – Social and Behavioral Sciences 40: 282–286.
https://doi.org/10.1016/j.sbspro.2012.03.192
Arbore, A.; Busacca, B. 2009. Customer satisfaction and dissatisfaction in retail banking: exploring the asymmetric impact of attribute performances, Journal of Retailing and Consumer Services 16(4): 271–280. https://doi.org/10.1016/j.jretconser.2009.02.002
Bayraktar, E.; Tatoglu, E.; Turkyilmaz, A.; Delen, D.; Zaim, S. 2012. Measuring the efficiency of customer satisfaction and loyalty for mobile phone brands with DEA, Expert Systems with Applications 39(8): 99–106. https://doi.org/10.1016/j.eswa.2011.06.041
Belton, V.; Stewart, T. 2002. Multiple criteria decision analysis: an integrated approach. Kluwer Academic Publishers, Dordrecht. https://doi.org/10.1007/978–1-4615–1495–4
Bobâlcă, C.; Gătej, C.; Ciobanu, O. 2012. Developing a scale to measure customer loyalty, Procedia – Economics and Finance 3: 623–628.
Bontis, N.; Booker, L.; Serenko, A. 2007. The mediating effect of organizational reputation on cus-tomer loyalty and service recommendation in the banking industry, Management Decision 45(9): 1426–1445. https://doi.org/10.1108/00251740710828681
Carlucci, D.; Schiuma, G.; Gavrilova, T.; Linzalone, R. 2013. A fuzzy cognitive map based approach to disclose value creation dynamics of ABIs, in Proceedings of the 8th International Forum on Knowledge Asset Dynamics (IFKAD-2013), 12–14 June 2013, Zagreb, Croatia, 207–219.
Carvalho, J. 2013. On the semantics and the use of fuzzy cognitive maps and dynamic cognitive maps in social sciences, Fuzzy Sets and Systems 214: 6–19. https://doi.org/10.1016/j.fss.2011.12.009
Culiberg, B.; Rojsek, I. 2010. Identifying service quality dimensions as antecedents to customer satisfac-tion in retail banking, Economic and Business Review 12(3): 151–166.
Dekker, D.; Post, T. 2000. A quasi-concave DEA model with an application for bank branch performance evaluation, European Journal of Operational Research 132(2): 296–311.
https://doi.org/10.1016/S0377–2217(00)00153–3
Dhebar, A. 2013. Toward a compelling customer touchpoint architecture, Business Horizons 56(2): 199–205. https://doi.org/10.1016/j.bushor.2012.11.004
Eden, C. 2004. Analyzing cognitive maps to help structure issues or problems, European Journal of Op-erational Research 159(3): 673–686. https://doi.org/10.1016/S0377–2217(03)00431–4
Eden, C.; Ackermann, F. 2001. SODA – the principles, in J. Rosenhead, J. Mingers (Eds.). Rational analysis for a problematic world revisited: problem structuring methods for complexity, uncertainty and conflict. 2nd ed. John Wiley & Sons, Chichester, 21–41.
Eden, C.; Ackermann, F. 2004. Cognitive mapping expert views for policy analysis in the public sector, European Journal of Operational Research 152(3): 615–630.
https://doi.org/10.1016/S0377–2217(03)00061–4
Ehigie, B. 2006. Correlates of customer loyalty to their bank: a case study in Nigeria, International Journal of Bank Marketing 24(7): 494–508. https://doi.org/10.1108/02652320610712102
Farahani, R. 2012. Covering problems in facility location: a review, Computers and Industrial Engineering 62(1): 369–407. https://doi.org/10.1016/j.cie.2011.08.020
Farquhar, J.; Panther, T. 2008. Acquiring and retaining customers in UK banks: an exploratory study, Journal of Retailing and Consumer Services 15(1): 9–21. https://doi.org/10.1016/j.jretconser.2007.02.001
Ferreira, F.; Jalali, M.; Ferreira, J.; Stankevičienė, J.; Marques, C. 2015a. Understanding the dynamics behind bank branch service quality in Portugal: pursuing a holistic view using fuzzy cognitive map-ping, Service Business, AOP 21 April. https://doi.org/10.1007/s11628–015–0278-x
Ferreira, F.; Jalali, M.; Meidutė-Kavaliauskienė, I.; Viana, B. 2015b. A metacognitive decision making based-approach to bank customer loyalty measurement and management, Technological and Economic Development of Economy 21(2): 280-300. https://doi.org/10.3846/20294913.2014.981764
Ferreira, F.; Santos, S.; Rodrigues, P. 2011. Adding value to branch performance evaluation using cog-nitive maps and MCDA: a case study, Journal of the Operational Research Society 62(7): 1320–1333.
https://doi.org/10.1057/jors.2010.111
Ferreira, F.; Santos, S.; Rodrigues, P.; Spahr, R. 2014. How to create indices for bank branch financial performance measurement using MCDA techniques: an illustrative example, Journal of Business Economics and Management 15(4): 708–728. https://doi.org/10.3846/16111699.2012.701230
Ferreira, F.; Spahr, R.; Santos, S.; Rodrigues, P. 2012. A multiple criteria framework to evaluate bank branch potential attractiveness, International Journal of Strategic Property Management 16(3): 254–276.
https://doi.org/10.3846/1648715X.2012.707629
Filipe, M.; Ferreira, F.; Santos, S. 2015. A multiple criteria information system for pedagogical evalua-tion and professional development of teachers, Journal of the Operaevalua-tional Research Society 66(11): 1769–1782. https://doi.org/10.1057/jors.2014.129
Garland, R.; Gendall, P. 2004. Testing Dick and Basu’s customer loyalty model, Australasian Marketing Journal 12(3): 81–87. https://doi.org/10.1016/S1441–3582(04)70108–1
Gavrilova, T.; Carlucci, D.; Schiuma, G. 2013. Art of visual thinking for smart business education, in Proceedings of the 8th International Forum on Knowledge Asset Dynamics (IFKAD-2013), 12–14 June 2013, Zagreb, Croatia, 1754–1751.
Hartman, T.; Storbeck, J.; Byrnes, P. 2001. Allocative efficiency in branch banking, European Journal of Operational Research 134(2): 232–242. https://doi.org/10.1016/S0377–2217(00)00257–5
Howcroft, J. 2006. Customer satisfaction in retail banking, The Service Industries Journal 11(1): 11–17.
https://doi.org/10.1080/02642069100000002
Hsieh, N. 2004. An integrated data mining and behavioral scoring model for analyzing bank customers, Expert Systems with Applications 27(4): 623–633. https://doi.org/10.1016/j.eswa.2004.06.007
Jalali, M.; Ferreira, F.; Ferreira, J.; Meidutė-Kavaliauskienė, I. 2016. Integrating metacognitive and psycho-metric decision-making approaches for bank customer loyalty measurement, International Journal of Information Technology and Decision Making 15(4): 815–837.
https://doi.org/10.1142/S0219622015500236
Kardaras, D.; Mentzas, G. 1997. Using fuzzy cognitive maps to model and analyse business performance assessment, in Proceedings of the 2nd Annual International Conference on Industrial Engineering Ap-plications and Practice II, 12–15 November 1997, San Diego, California, USA, 63–64.
Kim, H.; Lee, K. 1998. Fuzzy implications of fuzzy cognitive map with emphasis on fuzzy causal relation-ship and fuzzy partially causal relationrelation-ship, Fuzzy Sets and Systems 97(3): 303–313.
https://doi.org/10.1016/S0165–0114(96)00349–1
Kok, K. 2009. The potential of fuzzy cognitive maps for semi-quantitative scenario development, with an example from Brazil, Global Environmental Change 19(1): 122–133.
https://doi.org/10.1016/j.gloenvcha.2008.08.003
Kosko, B. 1986. Fuzzy cognitive maps, International Journal of Man-Machine Studies 24(1): 65–75.
https://doi.org/10.1016/S0020–7373(86)80040–2
Kosko, B. 1992. Neural networks and fuzzy systems. Prentice-Hall, New Jersey.
Kowalski, T.; Shachmurove, Y. 2011. The financial crisis: what is there to learn?, Global Finance Journal 22(3): 238–247. https://doi.org/10.1016/j.gfj.2011.10.014
Lee, H.; Chulhyun, K. 2014. Benchmarking of service quality with data envelopment analysis, Expert Systems with Applications 41(8): 3761–3768. https://doi.org/10.1016/j.eswa.2013.12.008
Lee, P.; Cheng, T.; Yeung, A.; Lai, K. 2011. An empirical study of transformational leadership, team performance and service quality in retail banks, Omega: The International Journal of Management Science 39(6): 690–701.
Lee, W.; Chang, C.; Liu, Y. 2010. Exploring customers’ store loyalty using the means-end chain approach, Journal of Retailing and Consumer Services 17(5): 395–405.
https://doi.org/10.1016/j.jretconser.2010.04.001
Manrai, L.; Manrai, A. 2007. A field study of customers’ switching behavior for bank services, Journal of Retailing and Consumer Services 14(3): 208–215. https://doi.org/10.1016/j.jretconser.2006.09.005
Martin, W.; Ponder, N.; Lueg, J. 2009. Price fairness perceptions and customer loyalty in a retail context, Journal of Business Research 62(6): 588–593. https://doi.org/10.1016/j.jbusres.2008.05.017
Mazlack, L. 2009. Representing causality using fuzzy cognitive maps, in Proceedings of the Annual Meet-ing of the North American Fuzzy Information ProcessMeet-ing Society (NAFIPS-2009), 14–17 June 2009, Cincinnati, Ohio, USA, 1–6. https://doi.org/10.1109/nafips.2009.5156434
Mihelis, G.; Grigoroudis, E.; Siskos, Y.; Politis, Y.; Malandrakis, Y. 2001. Customer satisfaction measure-ment in the private bank sector, European Journal of Operational Research 130(2): 347–360.
https://doi.org/10.1016/S0377–2217(00)00036–9
Minami, C.; Dawson, J. 2008. The CRM process in retail and service sector firms in Japan: loyalty develop-ment and financial return, Journal of Retailing and Consumer Services 15(5): 375–385.
Nadiria, H.; Kandampully, J.; Hussain, K. 2009. Zone of tolerance for banks: a diagnostic model of service quality, The Service Industries Journal 29(11): 1547–1564.
https://doi.org/10.1080/02642060902793425
Pan, Y.; Sheng, S.; Xie, F. 2012. Antecedents of customer loyalty: an empirical synthesis and reexamina-tion, Journal of Retailing and Consumer Services 19(9): 150–158.
https://doi.org/10.1016/j.jretconser.2011.11.004
Papageorgiou, E.; Roo, J.; Huszka, C.; Colaert, D. 2012. Formalization of treatment guidelines using fuzzy cognitive maps and semantic web tools, Journal of Biomedical Informatics 45(1): 45–60.
https://doi.org/10.1016/j.jbi.2011.08.018
Salinas, U.; Schinzano, A. 2014. The factors of the bank customer (dis)loyalty in portfolio choices, Pro-cedia – Economics and Finance 17: 192–201.
Salmeron, J. 2009. Augmented fuzzy cognitive maps for modelling LMS critical success factors, Know-ledge-Based Systems 22(4): 275–278. https://doi.org/10.1016/j.knosys.2009.01.002
Salmeron, J. 2012. Fuzzy cognitive maps for artificial emotions forecasting, Applied Soft Computing 12(12): 3704–3710. https://doi.org/10.1016/j.asoc.2012.01.015
Serna, R. 2005. Where are the bank branches in my community? An analysis of branch distribution in low-income neighborhoods. California reinvestment coalition report [online], [cited 10 February 2015]. Available from Internet: https://www.centralvalleybusinesstimes.com/links/CRC_bank_ branch_analysis.pdf
Stach, W.; Kurgan, L.; Pedrycz, W. 2010. A divide and conquer method for learning large fuzzy cognitive maps, Fuzzy Sets and Systems 161(19): 2515–2532. https://doi.org/10.1016/j.fss.2010.04.008
Stach, W.; Kurgan, L.; Pedrycz, W.; Reformat, M. 2005. Genetic learning of fuzzy cognitive maps, Fuzzy Sets and Systems 153(3): 371–401. https://doi.org/10.1016/j.fss.2005.01.009
Stylios, C.; Groumpos, P. 1999. Fuzzy cognitive maps: a model for intelligent supervisory control systems, Computers in Industry 39(3): 229–238. https://doi.org/10.1016/S0166–3615(98)00139–0
Tsadiras, A.; Kouskouvelis, I.; Margaritis, K. 2003. Using fuzzy cognitive maps as a decision support system for political decisions, in Proceedings of the 8th Panhellenic Conference on Informatics (PCI-2001), 8–10 November 2001, Nicosia, Cyprus, 172–182. https://doi.org/10.1007/3–540–38076–0_12
Vesel, P.; Zabkar, V. 2009. Managing customer loyalty through the mediating role of satisfaction in the DIY retail loyalty program, Journal of Retailing and Consumer Services 16(5): 396–406.
https://doi.org/10.1016/j.jretconser.2009.05.002
Xue, X.; Ji, Y.; Li, L.; Shen, Q. 2010. Cognition driven framework for improving collaborative working in construction projects: negotiation perspective, Journal of Business Economics and Management 11(2): 227–242. https://doi.org/10.3846/jbem.2010.11
Yaman, D.; Polat, S. 2009. A fuzzy cognitive map approach for effect-based operations: an illustrative case, Information Sciences 179(4): 382–403. https://doi.org/10.1016/j.ins.2008.10.013
Yoo, M.; Bai, B. 2013. Customer loyalty marketing research: a comparative approach between hospitality and business journals, International Journal of Hospitality Management 33(3): 166–177.
https://doi.org/10.1016/j.ijhm.2012.07.009
Yoon, Y.; Lee, J.; Lee, C. 2010. Measuring festival quality and value affecting visitors’ satisfaction and loyalty using a structural approach, International Journal of Hospitality Management 29(2): 335–342.
https://doi.org/10.1016/j.ijhm.2009.10.002
Fernando A. F. FErrEIrA is Assistant Professor w/Aggregation and Vice-Dean for financial affairs at the ISCTE Business School of the University Institute of Lisbon, and Adjunct Research Professor at the Fogelman College of Business and Economics of the University of Memphis, TN, USA. He holds a PhD in Quantitative Methods Applied to Economics and Management from the University of Algarve, Por-tugal. Some of his articles are published by ISI-listed journals such as Journal of the Operational Research
Society, Journal of Business Research, Management Decision, and International Journal of Strategic Property Management. He has practical experience as group facilitator and his research interests include multiple criteria decision analysis, fuzzy logics and integrated systems for performance measurement.
João J. M. FErrEIrA is Associate Professor at the University of Beira Interior, and Scientific Coordinator of the NECE Research Unit, Portugal. He holds a PhD in Management and his research interests include: strategy, competitiveness and entrepreneurship. He is editor, editorial board member and reviewer of several international journals. He has published extensively in a variety of leading journals.
Cristina I. M. A. S. FErNANDES is Adjunct Professor at the Polytechnic Institute of Castelo Branco and researcher at the NECE Research Unit, Portugal. She holds a PhD in Management from the University of Beira Interior. She has published in a variety of leading journals and her research interests include: techno-logy entrepreneurship and entrepreneurship, knowledge services, innovation and regional competitiveness. Ieva MEIDUTĖ-KAVALIAUSKIENĖ is Associate Professor at the Faculty of Business Management of the Vilnius Gediminas Technical University, Lithuania. She holds a PhD in Technological Science from the Vilnius Gediminas Technical University. She has authored peer-reviewed papers and some of her works have been presented and published nationally and internationally. She is editorial board member of several international journals and her research interests include decision analysis and operations management.
Marjan S. JALALI is Assistant Professor at the ISCTE Business School of the University Institute of Lisbon, and researcher at the Business Research Unit (BRU-IUL), Portugal. She holds a PhD in Management from the University of Sydney, Australia. She is editorial board member of the Global Business and Economics Review, managing editor of the International Journal of Management Science and Information Technology, and some of her works have been published nationally and internationally. Her research interests include multiple criteria decision analysis, strategic decision making and consumer behavior.
![Fig. 3. [Initial] Structure of the FCM](https://thumb-eu.123doks.com/thumbv2/123dok_br/18462639.898326/9.714.81.605.111.928/fig-initial-structure-of-the-fcm.webp)