1. Rheumatology Unit, Hospital Universitário Evangélico de Curitiba
Gastrointestinal symptoms in
scleroderma patients and its influence in
body mass index and quality of life
ACTA REUMATOL PORT. 2014:39;242-247
abstract
Background: Scleroderma (SSc) gastrointestinal (GI)
symptoms may affect nutritional status and patients’ quality of life.
Objective: To study prevalence of GI symptoms and
its relationship to nutritional profile and quality of life of patients with SSc.
Methods: Fifty two SSc patients and 51 controls were
studied for BMI (body mass index), dietary recall, ma-jor GI symptoms and quality of life by SF-12 ques-tionnaire.
Results: BMI in scleroderma patients was lower than
controls (p=0.02) despite an almost similar food inta-ke. Scleroderma patients had higher prevalence of up-per gastrointestinal tract symptoms than controls (heartburn, nausea and vomiting, dysphagia and epi-gastric pain) that were not associated with BMI (p= 0.36) but diminished quality of life (p=0.02) .
Conclusions: SSc patients have a lower BMI than
con-trols and higher prevalence of GI symptoms that does not affect food intake but diminishes quality of life.
Keywords: Scleroderma; Nutrition; Gastrointestinal
symptoms; Quality of life
introduction
Gastrointestinal symptoms are very common in pa-tients with scleroderma (SSc), reported in up to 90% of the cases1. Although fibrosis, the hallmark of this
enti-ty, that characteristically affects the skin, the gastroin-testinal tract is also involved, resulting in different
de-Skare T1, Culpi M1, Yokoo P1, Dias M1
grees of dysmotility, impaired digestion, changes in nu-trient absorption and secretion1. Symptoms are
varia-ble and their expression depends on the affected re-gion. Esophageal dysmotility is often associated with dysphagia, gastroesophageal reflux and heartburn; in-volvement of small intestine with bacterial overgrowth can lead to diarrhea, flatulence and malabsorption and the involvement of the colon is a common cause of constipation2. Symptoms from the digestive tract
ap-pear early in the disease and are associated with a wor-se prognosis3.
Dysfunction of the gastrointestinal tract may com-promise not only the nutritional status of the patient but can also cause depression and loss of quality of life4,5.
In the present study, we studied the frequency of gas-trointestinal symptoms in a sample of 52 patients with scleroderma looking for an association with nutritio-nal changes and loss of quality of life.
Material and Methods
This is a cross-sectional, case-control study in a sample of 52 patients with SSc, of both genders, aged 18 years or more who met the American College of Rheumato-logy Preliminary Classification Criteria for the diagno-sis of this entity6. As control, we studied 51 individuals
who had no SSc or other inflammatory disease and who attended the outpatient ophthalmology clinic. This stu-dy was approved by the local Committee of Ethics in Research and all participants signed informed consent form. Patients were recruited from a single Rheumato-logy Clinic and included according to order of arrival for consultation (convenience sample). Individuals unable to perform anthropometric measurements, pregnant women, those with renal failure and
untrea-ted hypothyroidism were excluded. Their medical re-cords were reviewed for demographic data, cumulati-ve involcumulati-vement of major organ systems affected by SSc according to criteria of the College American Rheu-matology for organ involvement7and for auto
antibo-dies profile. Anthropometric measures comprised the following steps (a) - measurement of weight: perfor-med in a portable digital scale Marte®, with 100g di-visions and a maximum of 180 kg, with subjects wea-ring light clothing and no shoes; (b) - height measu-rement: using transposable anodized stadiometer of aluminum Cardiomed® with mark division of 1 mm. For this measurement, the subject was without shoes, and lined back against the wall stadiometer; (c) – Body mass index (BMI) measurement: calculated dividing weight in kilograms by height in meters squared, ac-cording to World Health Organization, 19958.
A questionnaire about the presence of major gas-trointestinal symptoms (heartburn, dysphagia, nausea and vomiting, epigastric pain, bloating, constipation, diarrhea, number of stools per week and use of laxati-ves, anorexia, story food allergies and lactose intole-rance) was applied and it admitted a yes/no answer. For the quality of life evaluation the SF-12 question-naire9was applied. The nutritional supply was
eva-luated by dietary recall that quantifies the patients’s food intake in the last 24 hours that preceded the in-terview. These data were recorded with their respecti-ve home measures (such as: one cup, a full spoon p. ex). In some cases, where it was difficult to measure the portion (ex: small slice of cake), the portion size re-ported was considered by the participant, taking as a standard, the table done by Pinheiro et al10, in which
the foods were weighed and analyzed in the laborato-ry. The chemical composition of individual recalls was calculated using the Virtual Nutri Program 1.0 (Skopein
System ®, 2004)11. For homemade preparations, such
as pizza, lasagna, sandwiches, in order to better clas-sify the food groups in the food pyramid, the ingre-dients were used according to standardized recipes proposed by Pinheiro et al10and Fisberg and Villar12.
The relationship between dietary intake and food groups according to the Food Pyramid Adapted Gui-de13,14was established, using the method proposed by
Fisberg et al12.
As controls, we analyzed 51 patients from the same geographical area that attended to the Outpatient cli-nic for ophthalmologic consultation (refraction) and gynecological routine examination.
Data were grouped into frequency tables. Nominal
data were calculated as percentages. For numerical pa-rametric data, the central tendency measure was cal-culated using the mean and standard deviation; the me-dian and interquartile ranges (IQR) were used for non parametric data.
Correlation studies were done by Spearman tests. Tests of association of nominal data were made by un-paired t test (parametric sample) and Mann Whitney (non parametric sample), when two samples were com-pared. One way ANOVA and Kruskal Wallis tests were used to compare more than two samples. Tests of as-sociation of nominal data were made by Fisher tests and chi-square. The significance was adopted at 5%.
Calculations were made with the aid of the softwa-re Graph Pad Prism version 5.0.
results
a) descriptive analysis of the study population
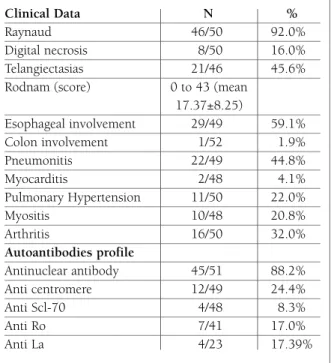
In the sample of 52 patients with scleroderma there were 17/52 (32.7%) cases of diffuse scleroderma, 27/52 (51.9%) of limited scleroderma, 7/52 (13.5%) of over-lap and 1/52 (1.9%) of scleroderma sine scleroderma. The clinical and auto antibody profile of this popula-tion can be seen in Table I.
Demographic data, associated diseases, life habits of scleroderma patients and controls as well as the pai-ring of the samples can be seen in Table II.
coMparative analysis of bMi, food intake and gastrointestinal syMptoMs and quality of life aMong patients with ssc and controls
The BMI of scleroderma patients ranged from 13.97 to 42.19 kg/m2 (mean 25.77 ± 5.41 kg/m2) and it was lo-wer than those of controls whose BMI ranged from 19.1 to 46.29 kg/m2 (mean 28.29 ± 5.99 kg/m2), p = 0.028, unpaired t test.
The comparison between BMI of scleroderma pa-tients and controls for nutritional groups can be ap-preciated in Figure 1.
Comparison of BMI in different forms of scleroder-ma (limited, diffuse and overlapping) showed no dif-ference (p = 0.76; one way ANOVA)
The dietary recall of SSc patients and controls can be seen in Table III, which shows that except for the amount of fat and calcium (that was higher in the SSc group) and micronutrients (folate and vitamin B12),
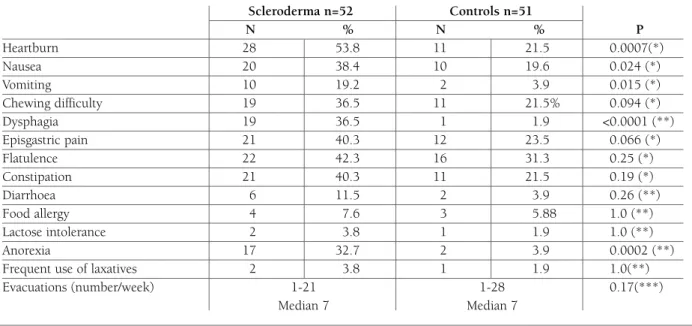
food consumption is equal in the two groups. Data obtained from comparison between clinical symptoms related to gastrointestinal tract in patients and controls are in Table IV, where it can be seen that high GI symptoms are most common in patients with scleroderma.
In 40/52 (76.9%) SSc patients, symptoms from high gastrointestinal tract were found (heartburn, nausea, vomiting, dysphagia and epigastric pain) and in 22/52 (42.3%) those from low gastrointestinal tract were pre-sent (flatulence, diarrhea, constipation). Comparing the BMI of SSc patients with gastrointestinal symptoms (mean 25.5 ± 5.6) with those with no symptoms (mean 27.9 ± 1.5) no difference was found (p=0.36; unpai-red test).
When studying the quality of life, the median SF-12 value in SSc patients was 83.90 (IQR 72.5 to 97.5) and controls 98.00 (IQR 76-98.7) with p=0.004. (Mann Whitney). Comparing the quality of life in individuals with and without gastrointestinal symptoms the SF--12 have a mean value of 81.24 ± 15.20 in those with symptoms vs 93.30 ± 7.30 in those without symptoms (p=0.02; unpaired t test). However no correlation was
desnutrition normal weight overweight obesity I obesity II obesity IIIscleroderma 7,6%36,5% 40,3%7,6%5,7%1,9% controls0,0%39,2% 31,3% 11,7% 13,7%3,9%
0,0%10,0%20,0%30,0%40,0%50,0%
desnutrition normal weight overweight obesity I obesity II obesity III scleroderma 7,6% 36,5% 40,3% 7,6% 5,7% 1,9% controls 0,0% 39,2% 31,3% 11,7% 13,7% 3,9% 0,0% 10,0% 20,0% 30,0% 40,0% 50,0%
figure 1.Distribution of body mass index in patients with scleroderma and control (expressed in percentage) NOTE: BMI below 18.5 - malnutrition; BMI between 18.5 and 24.9 - normal weight;
BMI between 25.0 and 29.9 - overweight; BMI between 30.0 and 34.9 - grade I obesity; BMI between 35.0 and 39.9 - grade II obesity; BMI 40.0 and above - morbid obesity.
table i. clinical and auto antibodies profile of 52 patients with scleroderMa
Clinical Data N %
Raynaud 46/50 92.0%
Digital necrosis 8/50 16.0%
Telangiectasias 21/46 45.6%
Rodnam (score) 0 to 43 (mean 17.37±8.25) Esophageal involvement 29/49 59.1% Colon involvement 1/52 1.9% Pneumonitis 22/49 44.8% Myocarditis 2/48 4.1% Pulmonary Hypertension 11/50 22.0% Myositis 10/48 20.8% Arthritis 16/50 32.0% Autoantibodies profile Antinuclear antibody 45/51 88.2% Anti centromere 12/49 24.4% Anti Scl-70 4/48 8.3% Anti Ro 7/41 17.0% Anti La 4/23 17.39%
table ii. pairing data of 52 scleroderMa patients and 51 controls
Scleroderma N=52 Control N=51 P
Gender (male/female) 4/52 4/51 1.0
Mean age (years) 50.7±12.9 51.0±14.7 0.91
Tobacco exposure 24/52= 46.1% 21/51=26% 0.55
Ethnic background 28 caucasians and 30 caucasians and
24 afro-descendants 21 afro-descendants 0.69
found between BMI values and the SF-12 (r=-003; 95%CI=0.30 to 0.24; p=0.80; Spearman test).
discussion
The results of the present study show that patients with SSc have a high prevalence of gastrointestinal sym -ptoms and such sym-ptoms are associated with their quality of life. In this sample the symptoms were mos-tly from the higher gastrointestinal tract as had been detected by Wielosz Xi15that found high GI symptoms
in 74% of their patients versus only 30% for low GI tract.
The study of BMI showed that around 8% of SSc patients were malnourished, while 36% had normal weight and 40% were overweight. Obesity grade 1,2,3
were less common and appeared in smaller propor-tion than in the control populapropor-tion. The data obtained follow the pattern observed by Krause et al16in German
patients with SSc. These authors found 13.7% of mal-nutrition, 55.6% of normal weight and obesity grade 1 in 25.8% of their patients. Interestingly, despite the difference found for BMI, nutritional support did not vary much between SSc patients and controls except for lipids and calcium intake that was higher and B12 vitamin and folic acid which was lower in the SSc group. Lundberg et al17studying 30 patients with
scle-roderma also found that the food intake of these pa-tients was similar to that of the normal population. Thus, it is not possible to attribute the difference in the BMI to change in food consumption, despite the high prevalence of observed gastrointestinal symptoms. It is possible that metabolic disorders and disturbances in
table iii. coMparative analysis of food consuMption aMong patients with scleroderMa and controls
Scleroderma n=52 Control n=51 P Kilocalories (mean) 1703±730.3 1500±610.1 0.13 (*) Carbohidrate (median- g) 211.1; 186.1; 0.20 (**) IQR de 150.9 a 305.1 IQR de 133.0 a 252.0 Protein (median-g) 61.02; 60.45; 0.51 (**) IQR de 43.9 a 75.7 IQR de 43.05 a 93.41 Lipids (median g) 58.1; 40.6; 0.01 (**) IQR de 38.4 a 82.7 IQR de 22.8 a 61.33
Saturated fat (median- g.) 15.56; 13.6; 0.16 (**)
IQR de 9.48 a 19.8 IQR de 7.4 a 18.8
Monounsaturated fat (median-g) 11.29; 13.9; 0.09 (**)
IQR de 6.62 a 15.54 IQR de 8.0 a 22.5
Polyunsaturated fat (median g) 5.81; 6.48; 0.21 (**)
IQR de 2.84 a 8.81 IQR 4.2 a 10.5 Cholesterol (median- mg) 156.9 132.6; 0.45 (**) IQR de 102.6 a 236.7 IQR de 74.4 a 238.3 Sodium (median- mg) 1723; 1347; 0.46 (**) IQR de 1021 a 2261 IQR de 828.7 a 2220.0 Calcium (median- mg) 599.0±315.9 455.4±263.0 0.014 (**) Iron (median- mg) 9.48; 11.07; 0.12 (**) IQR de 6.71 a 13.43 IQR de 7.93 a 14.34 Vitamin B12 (median -μg) 0.89; 2.05; 0.0008 (**) IQR de 0.26 a 2.50 IQR de 1.30 a 4.51 Vitamin A (median- μg) 312.1; 249.9; 0.38 (**) IQR de 190.5 a 561.4 IQR de 105.1 a 525.3 Folate (median- μg) 133.4; 230.0; <0.0001 IQR de 83.2 a 246.7 IQR 188.7 a 374.1
absorption can explain this finding. A minority of pa-tients complained of diarrhea but subclinical malabsor ption cannot be excluded. According to Bu-res et al18half of patients with scleroderma and
intes-tinal bacterial overgrowth may not present clinically relevant complaints. Krause et al16attributed the
mal-nutrition seen in SSc patients to the chronic inflam-matory process and noted that it was closely linked to mortality. The same was observed Hesselstrand et al19.
The role of adipokines although accepted as an ele-ment that establishes a link between inflammation and nutritional status in patients with systemic lupus ery -thematosus and rheumatoid arthritis, is little studied in SSc. It is known that adiponectin, an adipokine with anti-inflammatory properties made in subcutaneous and visceral fat tissue, which regulates the metabolism of glucose and fatty acids, have been found to be de-creased in scleroderma. This decrease was associated with greater thickening of skin and lung fibrosis20.
The gastrointestinal tract is probably the third most affected site in SSc patients, followed by skin and by Raynaud21. It happens in all forms of scleroderma21. In
our sample it was not possible to associate the occur-rence of gastrointestinal symptoms to changes in BMI, although the small number of patients included did not allow the analysis for specific gastrointestinal
symptoms. A multicenter Canadian22involving 586
patients with scleroderma found that the risk of malnutrition was associated with specific gastrointes-tinal symptoms mainly with loss of appetite, flatulen-ce, nausea, diarrhea and constipation.
Although gastrointestinal symptoms did not explain changes in BMI in the present study, these were linked to significant loss of quality of life. The association between gastrointestinal complaints and lessened qua-lity of life has been studied by Omair et al4that
com-pared the life quality of patients with scleroderma and gastrointestinal involvement with other rheumatic pa-tients. Depressive symptoms were also more common in symptomatic patients5.
Limitations of this study are the nutritional assessment made by BMI, which does not allow distinction of mus-cle mass from adipose tissue, and the gastrointestinal tract exploration based on clinical symptoms that does not exclude asymptomatic minor involvements.
In conclusion we noted a high prevalence of gas-trointestinal symptoms in this SSc population which diminished the quality of life but did not explain the lower BMI than controls. Weight changes also could not be explained by lower food consumption. Further studies are needed do understand this phenomenon in more details.
table iv. coMparative study of gastrointestinal coMplaints in patients with scleroderMa and controls Scleroderma n=52 Controls n=51 N % N % P Heartburn 28 53.8 11 21.5 0.0007(*) Nausea 20 38.4 10 19.6 0.024 (*) Vomiting 10 19.2 2 3.9 0.015 (*) Chewing difficulty 19 36.5 11 21.5% 0.094 (*) Dysphagia 19 36.5 1 1.9 <0.0001 (**) Episgastric pain 21 40.3 12 23.5 0.066 (*) Flatulence 22 42.3 16 31.3 0.25 (*) Constipation 21 40.3 11 21.5 0.19 (*) Diarrhoea 6 11.5 2 3.9 0.26 (**) Food allergy 4 7.6 3 5.88 1.0 (**) Lactose intolerance 2 3.8 1 1.9 1.0 (**) Anorexia 17 32.7 2 3.9 0.0002 (**)
Frequent use of laxatives 2 3.8 1 1.9 1.0(**)
Evacuations (number/week) 1-21 1-28 0.17(***)
Median 7 Median 7
correspondence to Thelma Skare
Rua João Alencar Guimarães, 796 Curitiba PR BRAZIL E-mail: [email protected] references
1. Harrison E, Herrick AL, McLauglin JT, Lal S. Malnutrition in systemic sclerosis. Rheumatology 2012; 51: 1747-1756. 2. Ejaovisidha K, Csuka ME, Almagro UA, Spergel KH. Severe
gastrointestinal involvement in systemic sclerosis: report of five cases and review of the literature. Sem Arthritis Rheum 204; 34: 689-702.
3. Al-Dhaher FF, Pope JE, Ouimet JM. Determinants of morbidi-ty and mortalimorbidi-ty of systemic sclerosis in Canada. Sem Arthritis Rheum 2010; 39: 269-277.
4. Omair MA, Lee P. Effect of gastrointestinal manifestations on quality of life in 87 consecutive patients with systemic sclero-sis. J Rheumatol 2012; 39: 992-996.
5. Bodukan V, Hays RD, Maranian P, et al. Association of gas-trointestinal involvement and depressive symptoms in patients with systemic sclerosis. Rheumatology 2011; 50: 330-334. 6. Masi AT, Rodnan GP, Medsger, TA Jr, et al. Preliminary criteria
for the classification of systemic sclerosis (scleroderma). Arth-ritis Rheum 1980; 23: 581–590.
7. Furst DE, Clements PJ, Won WK, et al. Effects of the American College of Rheumatology systemic sclerosis trial guidelines on the nature of systemic sclerosis patients entering a clinical trial. Rheumatology 2001; 40: 615-622.
8. World Health Organization. Last accessed on 2011 Sep 30. Available from: http://www.who.int/nutrition/publications/obe-sity/09577082_1_1/en/
9. Ware J Jr, Kosinski M, Keller SD. A 12-Item Short-FormHealth Survey: Construction of scales and preliminary tests of reliabi-lity and validity. Med Care 1996; 34: 220-233.
10. Pinheiro ABV, Lacerda EMA, Benzecry EH, Gomes MCS, Cos-ta VM. Tabela para avaliação de consumo alimenCos-tar e medidas caseiras. São Paulo: Atheneu; 2002.
11. U.S. Department of Agriculture. Agricultural Research Service. USDA National Nutrient Database for Standard Reference, Re-lease 16. [tabela de composição de alimentos] 2003; [cited 2004 Jan 28]. Available from: http://www.nal.usda.gov/fnic/ foodcomp
12. Fisberg RM, Villar BS. Manual de Receitas e Medidas Caseiras para Cálculo de Inquéritos Alimentares. 1. ed. São Paulo: Sig-nus, 2002.
13. Philippi ST. Tabela de composição química de alimentos: su-porte para decisão nutricional. Brasília: ANVISA; 2001. 14. Souci SW, Farchman W, Kraut. Food composition and nutrition
tables. 5th ed. Stutgard: Medpharm Scientific Publishers; 1994. 15. Wielosz E, Borys O, Zychowska I, Madjan M. Gastrointestinal
involvement in patients with systemic sclerosis. Pol Arch Med Wewn 2010; 120: 13213-13216.
16. Krause L, Becker MO, Brueckner CS, et al. Nutritional status as marker of disease activity and severity predicting mortality in patients with systemic sclerosis. Ann Rheum Dis 2010; 69: 1951-1957
17. Lundberg AC, Akesson A, Akesson B. Dietary intake and nu-tritional status in patients with systemic sclerosis. Ann Rheum Dis 1992; 51: 1143-1148.
18. Bures J, Cyrany J, Kohoutova D, et al. Small intestinal bacterial overgrowth syndrome. World J Gastroenterol 2010; 16: 2978--2990.
19. Hesselstrand R, Scheja A, Akensson A. Mortality and causes of death in a Swedish series of systemic sclerosis patients. Ann Rheum Dis 1998; 57: 682-686.
20. Arakawa H, Jinnin M, Muchemwa FC, et al. Adiponectin ex-pression is decreased in the involved skin and sera of diffuse cu-taneous scleroderma patients. Exp Dermatol 2011, 20: 749--775
21. Sallam H, Mc Nearney, Chen JDZ. Systematic review: pathop-hysiology and management of gastrointestinal dysmotility in systemic sclerosis (scleroderma). Aliment Pharmacol Ther 2006; 23: 691-712.
22. Baron M, Hudson M, Steele R, Canadian Scleroderma Research Croup. Malnutrition is common in systemic sclerosis: results from the Canadian Scleroderma Research Group Database. J Rheumatol 2009; 36: 2737-2743.