The Journal of Experimental Biology
ABSTRACT
Some fish show a low metabolic ability to use dietary carbohydrates. The use of early nutritional stimuli to program metabolic pathways in fish is ill defined. Therefore, studies were undertaken with zebrafish to assess the effect of high glucose levels during the embryonic stage as a lifelong modulator of genes involved in carbohydrate metabolism. Genes related to carbohydrate metabolism were expressed at low levels at 0.2 and 1 day post-fertilization (dpf). However, from 4 dpf onwards there was a significant increase on expression of all genes, suggesting that all analysed pathways were active. By microinjection, we successfully enriched zebrafish egg yolk with glucose (a 43-fold increase of basal levels). Acute effects of glucose injection on gene expression were assessed in larvae up to 10 dpf, and the programming concept was evaluated in juveniles (41 dpf) challenged with a hyperglucidic diet. At 4 dpf, larvae from glucose-enriched eggs showed a downregulation of several genes related to glycolysis, glycogenolysis, lipogenesis and carbohydrate digestion in comparison with control (saline-injected) embryos. This inhibitory regulation was suppressed after 10 dpf. At the juvenile stage, and upon switching from a low to a high digestible carbohydrate diet, early glucose enrichment had no significant effect on most analysed genes. However, these same fish showed altered expression of the genes for cytosolic phosphoenolpyruvate carboxykinase, sodium-dependent glucose cotransporter 1 and glycogen synthase, suggesting changes to the glucose storage capacity in muscle and glucose production and transport in viscera. Overall, supplementation of egg yolk with high glucose levels had little effect on the long-term modulation of carbohydrate metabolic genes in zebrafish.
KEY WORDS: Glucose metabolism, Nutritional programming, Gene expression, Zebrafish
INTRODUCTION
Mammalian models show that prenatal or early neonatal events at crucial developmental windows may result in lifelong contributions growth potential and health status (Burdge and Lillycrop, 2010; Lucas, 1998; Patel and Srinivasan, 2002; Patel et al., 2009). Crucial periods are likely to occur when the developing organism has high genetic plasticity such as cell proliferation, organs and tissues formation or in a later stage, when immature regulatory mechanisms
RESEARCH ARTICLE
1CCMAR/CIMAR, Centro de Ciências do Mar do Algarve, Universidade do Algarve, Campus de Gambelas, 8005-139 Faro, Portugal. 2INRA, UR1067 Nutrition Metabolism Aquaculture, F-64310 Saint-Pée-sur-Nivelle, France. *Author for correspondence ([email protected])
Received 7 August 2013; Accepted 26 November 2013
that still are not functional (Srinivasan and Patel, 2008). Possible biological mechanisms for ‘imprinting’ the nutritional event until adulthood comprise adaptive changes on gene expression pattern or cellular phenotype (epigenetic phenomenon), nutrient-sensitive signalling pathways and adaptive clonal selection, which could be transmitted to future offspring (Lucas, 1998; Symonds et al., 2009; Waterland and Jirtle, 2004). Knowledge on the broad concept of nutritional programming in fish is extremely scarce. Despite not targeting nutrients, there are now several studies indicating that, as in terrestrial vertebrates, environmental factors (e.g. temperature) can lead to genomic imprinting in fish, through changes in DNA methylation (Campos et al., 2013; Navarro-Martín et al., 2011). Moreover, important elements associated with epigenetic mechanisms have been recently reported in zebrafish (Andersen et al., 2012).
Some teleost fish exhibit a poor utilization of dietary carbohydrates, especially those with carnivorous feeding habits (Panserat and Kaushik, 2010; Wilson, 1994). Important research work was undertaken to establish the role of carbohydrates at a metabolic and physiological level in fish (Panserat and Kaushik, 2010). Such studies focused mainly on the role of dietary factors as modulators of glucose utilization and expression of key enzymes of intermediary metabolism (Enes et al., 2011; Panserat et al., 2002; Seiliez et al., 2013). However, the mechanisms underlying the relatively poor ability of fish to utilize dietary carbohydrates as a major energy yielding substrate remain to be elucidated. Numerous studies in mammals have shown that increasing carbohydrate intake through maternal nutrition (prenatal) or by newborn during suckling period (neonatal) can cause long-term modifications on glucose metabolism and later diseases related to metabolic syndromes and diabetes (Burdge and Lillycrop, 2010; Olsen et al., 2012; Waterland and Jirtle, 2004). The opportunities to exert a nutritional stimulus during a stage of high metabolic plasticity, such as fish embryogenesis or early larval development, are limited to, e.g. maternal nutrient transfer (Fernández-Palacios et al., 1997; Fernández-Palacios et al., 1995) and the onset of exogenous feeding (Geurden et al., 2007; Vagner et al., 2007). A previous study by Geurden et al. showed that a short hyperglucidic stimulus exerted at the onset of feeding, upregulated carbohydrate digestive enzymes in rainbow trout at a later juvenile stage, suggesting some long-term physiological changes (Geurden et al., 2007).
Once spawned and fertilized, fish eggs operate as semi-closed systems, given the extremely low permeability of the egg surface membrane (Babin et al., 2007; Kamler, 2008). This period of rapid embryonic development, prior to hatching, when fish rely exclusively on yolk nutrients appears of specific interest for testing the nutritional programming concept in fish. At this stage, target delivery of specific nutrient loads during early embryonic
Glucose overload in yolk has little effect on the long-term
modulation of carbohydrate metabolic genes in zebrafish
(Danio rerio)
Filipa Rocha1, Jorge Dias1, Sofia Engrola1, Paulo Gavaia1, Inge Geurden2, Maria Teresa Dinis1and Stephane Panserat2,*
The Journal of Experimental Biology
development may be performed through microinjection directly in the yolk. Zebrafish (Danio rerio Hamilton 1822) is now firmly established as an important and informative model system for studying vertebrate embryogenesis and organogenesis, as well for the analysis of developmentally regulated genes in aspects related to human disease modelling (Ali et al., 2011; Kudoh et al., 2001). In addition to the wide variety of molecular tools and resources available for genomic analysis in zebrafish, the ease of breeding, the large number of offspring (embryos), the ex utero development of embryos and their optical transparency during early embryogenesis (Ulloa et al., 2011) make it a powerful model for studying early nutritional programming in fish through modification of embryo nutritional status. Fish eggs contain relatively low levels of carbohydrates in the vitellus and are generally rich in free amino acids and fatty acids (Hoar and Randall, 1988; Kamler, 2008). Whether a targeted supplementation of yolk reserves with glucose during embryogenesis could act as a nutritional stimulus to program life-long metabolic pathways in fish is unknown.
The main objective of our work was to assess the short- and long-term effects of supplementing zebrafish embryos with high levels of glucose on the gene regulation of several pathways of intermediary metabolism.
RESULTS
Expression of target metabolic genes at relevant embryonic and larval stages
In this first trial, the survival rate was high (88%) for zebrafish fed with Artemia nauplii until 10 days post-fertilization (dpf; Table 1). Glucose is scarcely available during zebrafish embryonic development, mainly during the first hours of development. At
0.2 dpf (relevant stage for injection) the total glucose level was
0.06 mmol l−1, the lowest concentration recorded. An increase up to
0.4 mmol l−1was recorded at 1 dpf followed by a slight decrease to
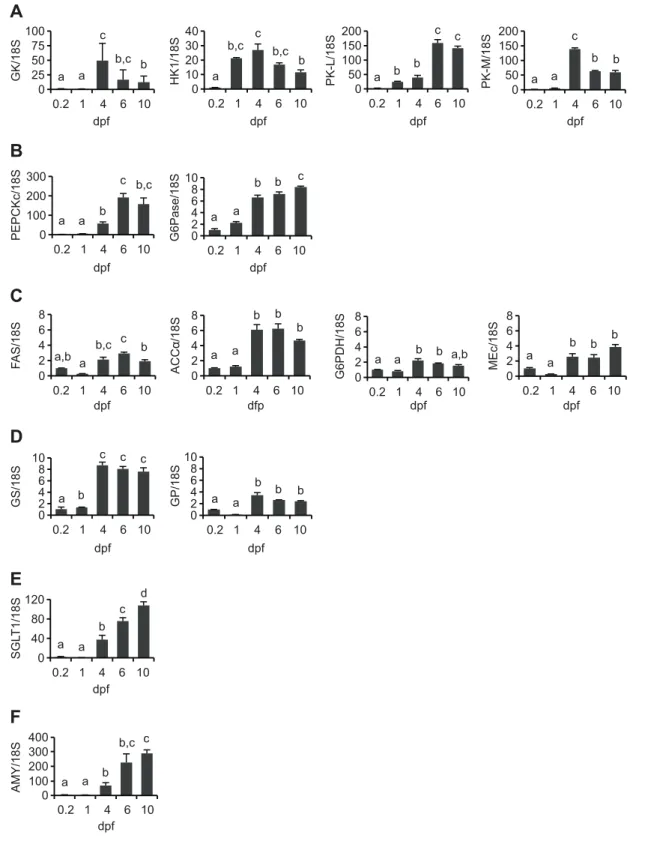
0.3 mmol l−1at 4 dpf (Fig. 1). Fig. 2 shows data on the transcript
levels during zebrafish embryogenesis of genes related to: glycolysis [glucokinase (GK), hexokinase 1 (HK1), pyruvate kinase (PK-L, PK-M, isoforms from liver and muscle, respectively)]; gluconeogenesis [cytosolic phosphoenolpyruvate carboxykinase (PEPCKc), glucose-6-phosphatase (G6Pase)]; lipogenesis [fatty acid
synthase (FAS); acetyl-CoA carboxylase isoform alpha (ACCα), glucose-6-phosphate dehydrogenase (G6PDH), malic enzyme
cytosolic (MEc)]; glycogen metabolism [glycogen synthase (GS),
glycogen phosphorylase (GP)]; glucose transport (sodium-dependent glucose cotransporter 1 (SGLT1)] and carbohydrate
digestion [amylase (AMY)]. These results clearly show that at 0.2 dpf, the expression levels of all genes were significantly lower (P<0.05) than at later stages. Towards the end of the exclusively endogenous feeding stage (4 dpf), the mRNA levels of all analysed genes related to glucose, glycogen and lipid metabolism, as well as to glucose transport and carbohydrate digestion, had considerably increased. During the transition to exogenous feeding (6 and 10 dpf) all genes continued to be expressed, with a significant (P<0.05) increase in SGLT1, AMY, PEPCKc, G6Pase and PK-L, a significant reduction for GK and PK-M, and unchanged for all other studied genes.
Tolerance of zebrafish embryos to high glucose levels in yolk
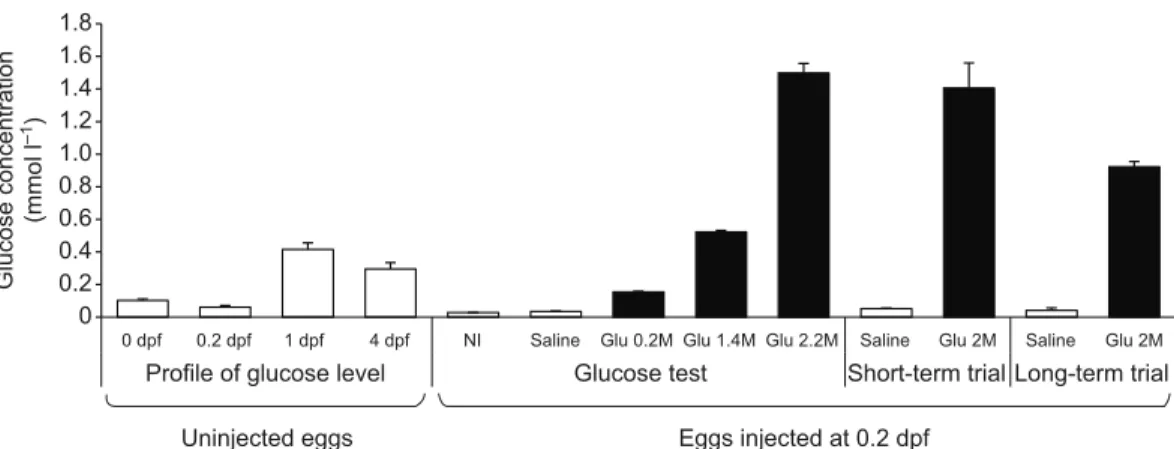
Three highly concentrated solutions of D-glucose were injected into yolks and the glucose concentration in zebrafish embryos (0.2 dpf; 30% epiboly) examined (Fig. 1). Results show that in comparison to saline-injected eggs (controls), it was possible to achieve an increase of 4-, 15- and 43-fold glucose concentration in eggs injected with
0.2, 1.4 and 2.2 mol l−1doses, respectively. Embryos injected with
saline solution had low levels of glucose (0.03 mmol l−1) that were
similar to the levels found in non-injected embryos. In contrast,
embryos injected with the highest dose (2.2 mol l−1) reach a level of
1.5 mmol l−1 of glucose, right after the injection. It is worth
mentioning that quantified glucose levels found in zebrafish eggs after injection were considerably lower than estimated injected doses. No leaking of glucose was registered in the eggs immediately after the injection. However, we cannot exclude the possibility that injected embryos quickly released excess glucose as a mechanism of cellular homeostasis to cope with osmolality changes. Despite the high osmolality value of concentrated of glucose solutions, values measured in eggs were not affected by glucose injection, ranging
from 80 mOsm kg−1in glucose-injected eggs to 70 mOsm kg−1in
saline-injected and non-injected eggs (data not shown). No
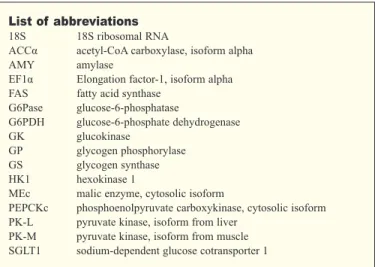
List of abbreviations
18S 18S ribosomal RNA
ACCα acetyl-CoA carboxylase, isoform alpha AMY amylase
EF1α Elongation factor-1, isoform alpha FAS fatty acid synthase
G6Pase glucose-6-phosphatase G6PDH glucose-6-phosphate dehydrogenase GK glucokinase GP glycogen phosphorylase GS glycogen synthase HK1 hexokinase 1
MEc malic enzyme, cytosolic isoform
PEPCKc phosphoenolpyruvate carboxykinase, cytosolic isoform PK-L pyruvate kinase, isoform from liver
PK-M pyruvate kinase, isoform from muscle SGLT1 sodium-dependent glucose cotransporter 1
Table 1. Survival of zebrafish larvae and juveniles at 4, 10 and 41 dpf during the trials
Survival (%)
Experiment Condition 4 dpf 10 dpf 41 dpf Expression profile Non-injected 98±7.3 88±3.1 n.d. Short-term trial Non-injected 97 92 n.d. Saline 86±9.1 82±7.0 n.d. Glucose (2 mol l−1) 79±8.0 72±4.6 n.d.
Long-term trial Non-injected 99 84 40 Saline 87±6.6 73±7.1 42±7.68 Glucose (2 mol l−1) 86±3.1 76±7.8 43±5.24
dpf, days post-fertilization.
Values are means ± s.d. (n=3) for saline and glucose injection treatments in the short- and long-term trials. Non-injected group was reared without replicates. Values were tested with Student’s t-test. Absence of superscript letter indicates no statistical differences (P>0.05). n.d., not determined.
The Journal of Experimental Biology
differences (P>0.05) in larval weight, embryonic development (length and yolk volume) and survival were found between treatments, at the end of the experiment (Tables 1, 2). Larvae
injected with 1.4 mmol l−1glucose were shorter at 4 dpf compared
with those injected with 0.2 mol l−1 (P=0.002) and 2.2 mol l−1
(P=0.01), but not different from the saline-injected embryos. At 10 dpf, survival was high for eggs injected with saline and glucose solutions. Overall, zebrafish larvae seemed to tolerate well the enrichment of yolk reserves with high concentrations of glucose up
to 2.2 mol l−1, without compromising growth and survival.
Effect of glucose injection on short-term and long-term metabolic gene expression
Glucose levels were measured in embryos injected (0.2 dpf) with
either saline or glucose (2 mol l−1) solution (Fig. 1). Immediately
after microinjection, a 28- and 23-fold increase of basal glucose levels was achieved in the short-term (4, 6 and 10 dpf) and long-term (41 dpf) trials, respectively. In addition, saline-injected eggs showed similar levels of glucose in both trials (approximately
0.05 mmol l−1). These results confirm that an effective enrichment
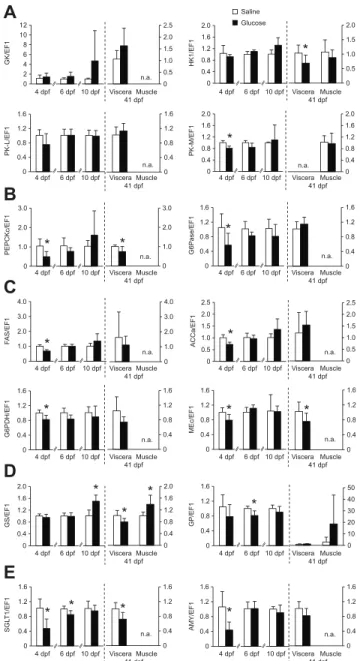
of yolk glucose reserves of zebrafish embryos at 0.2 dpf was achieved. In both trials, the survival rate at 10 dpf was not significantly different (P>0.05) between the glucose and saline treatments (Table 1). Considering the long-term trial, no significant differences (P>0.05) were found for growth (dry mass and fork length) and development of juvenile fish between glucose and saline treatments (Table 2). For the short-term trial, gene expression was firstly analysed in non-injected, saline-injected and glucose-injected embryos. No significant differences were found between non-injected eggs and saline-non-injected eggs, meaning that the injection procedure itself (puncturing and injecting) had no effect on gene expression (data not shown). The effects of glucose injection on the expression of metabolic genes in the short-term and long-term trials are illustrated in Fig. 3. At 4 dpf, a period during which larvae rely exclusively of endogenous reserves, glucose-injected larvae showed a downregulation of several genes related to glucose metabolism, lipid metabolism, glucose transport and carbohydrate digestion (Fig. 3A–C,E) in comparison with the saline-injected group. At 6 dpf, when actively feeding, the inhibitory effect of glucose injection on gene expression started to fade. Of all genes that were downregulated at 4 dpf only those for SGLT1 and GP remained at lower levels of expression in glucose-injected larvae (Fig. 3D,E). At 10 dpf the early downregulation of genes expression associated with glucose injection was suppressed and no significant differences
(P>0.05) were found between treatments. Exceptionally, GS gene expression was upregulated in the glucose-injected larvae (Fig. 3D). In brief, the inhibitory effect of glucose injection on gene expression observed at 4 dpf was no longer present at 10 dpf, which means that effects were reversible. In viscera and muscle of juvenile fish (41 dpf) injected with glucose at early embryo stages and later submitted to a feeding challenge with a high digestible carbohydrate diet, it was possible to detect differences on gene regulation. In viscera, the genes for HK1, PEPCKc, MEc, GS and SGLT1 were significantly downregulated in the glucose-injected fish (Fig. 3A–E). The decrease in mRNA of visceral tissue of juvenile fish was identical to the short-term effect found at 4 dpf, with the exception of the HK1 gene. In contrast, in muscle, the GS gene was upregulated in the glucose treatment (Fig. 3D), reflecting once more the pattern found during the acute effect (10 dpf) on gene expression. However, for this gene, at 41 dpf, the opposite was found. Therefore the effect of glucose treatment was different depending on the tissue in which the gene was expressed: in viscera the expression was downregulated whereas in muscle it was induced.
DISCUSSION
Several studies on metabolic programming in mammals showed that nutrient supply at crucial development stages early in life may have long-term genetic and physiological consequences during adulthood (Lucas, 1998; Patel and Srinivasan, 2002; Patel et al., 2009). Geurden et al. tested the concept of nutritional programming in fish, by feeding rainbow trout larvae with a high dextrin diet (Geurden et al., 2007). This short-term hyperglucidic stimulus resulted in molecular adaptations of carbohydrate digestive enzymes (AMY and maltase) at a later juvenile stage. However, no persistent effect was recorded for enzymes involved in glucose metabolism or transport. In our study, using a microinjection technique, we attempted to modify the glucose content of zebrafish yolk reserves at early stages of embryogenesis in order to assess the short-term and possible long-term modifications on gene regulation. The panel of genes selected for qPCR analysis in this study has been previously validated as good molecular markers for nutritional regulation of glucose metabolism in zebrafish (Seiliez et al., 2013).
Glucose supplementation of yolk has no detrimental effects on growth and development of larvae
In zebrafish, microinjection of RNA, DNA, proteins, antisense oligonucleotides and other small molecules into the developing 0 0.2 0.4 0.6 0.8 1.0 1.2 1.4 1.6 1.8
0 dpf 0.2 dpf 1 dpf 4 dpf NI Saline Glu 0.2M Glu 1.4M Glu 2.2M Saline Glu 2M Saline Glu 2M
Profile of glucose level Glucose test Short-term trial Long-term trial
Uninjected eggs Eggs injected at 0.2 dpf
Glucose concentration
(mmol l
–1
)
Fig. 1. Glucose levels in zebrafish embryos and larvae. Natural changes from zygote to endogenous feeding larvae (up to 4 dpf) in non-injected eggs and
changes after injection into the yolk (at 0.2 dpf) of graded glucose doses in comparison with basal levels in saline-injected (saline) and non-injected eggs (NI); Values are means + s.d. of N=3 groups per treatment and time.
The Journal of Experimental Biology
embryo allows a quick and robust approach for exploring gene function in vivo (Xu, 1999). The time frame selected for performing microinjection can vary between the 1- to 2-cell and later gastrula stages, depending on the study requirements (Culp et al., 1991; Janik
et al., 2000). In this study, the microinjection of glucose into the yolk of zebrafish embryos was performed at the 30% epiboly stage (0.2 dpf). The choice of this particular developmental stage took into consideration the facts that: (1) the yolk syncytial layer (YSL) was
A
B
C
D
E
0 25 50 75 100 0.2 1 4 6 10 GK/18S dpf 0 10 20 30 40 0.2 1 4 6 10 HK1/18S dpf 0 50 100 150 200 0.2 1 4 6 10 PK-L/18S dpf 0 50 100 150 200 0.2 1 4 6 10 PK-M/18S dpf 0 100 200 300 0.2 1 4 6 10 PEPCKc/18S dpf 0 2 4 6 8 10 0.2 1 4 6 10 G6Pase/18S dpf 0 2 4 6 8 0.2 1 4 6 10 F AS/18S dpf 0 2 4 6 8 0.2 1 4 6 10 ACCα/18S dfp 0 2 4 6 8 0.2 1 4 6 10 G6PDH/18S dpf 0 2 4 6 8 0.2 1 4 6 10 MEc/18S dpf 0 2 4 6 8 10 0.2 1 4 6 10 GS/18S dpf 0 2 4 6 8 10 0.2 1 4 6 10 GP/18S dpf 0 40 80 120 0.2 1 4 6 10 SGL T1/18S dpf 0 200 400 0.2 1 4 6 10 AMY/18S dpf c b,c b,c b a b c a a c b a a b c a b c b,c a c b a a b,c b b a a c b a b,c a,b a b b a,b b b a a a b b c c a c b a d a b c b a b,c c a b c b a b a b a b bF
300 100Fig. 2. Relative expression profiles (fold variation) of genes from zebrafish larvae up to 10 dpf in comparison to the levels observed at 0.2 dpf (30% epiboly stage). The genes analysed were those involved in (A) glycolysis: GK, HK1, PK-L, PK-M; (B) gluconeogenesis: PEPCKc, G6Pase; (C) lipogenesis:
FAS, ACCα, G6PDH, MEc; (D) glycogen metabolism: GS, GP; (E) glucose transport: SGLT1; and (F) carbohydrate digestion: AMY. Total RNA was extracted from whole embryos or larvae (N=3). Relative expression levels were measured using real-time quantitative RT-PCR and normalized to the 18S rRNA gene (18S). Values are means + s.d.; significant differences among developmental stages were analysed using a non-parametric test, Kruskal–Wallis one-way ANOVA followed by the Dunnett’s test (P<0.05; different letters above the bars denote a significant difference).
The Journal of Experimental Biology
formed; (2) the blastoderm cells were beginning to spread over the yolk; and (3) the percentage of yolk coverage by the blastoderm was reduced (30% covered) (Kimmel et al., 1995). The YSL has an important function in transporting nutrients from the yolk to the embryonic cells and later to larval tissues and is also responsible for the degradation of some nutrients (Carvalho and Heisenberg, 2010; Hölttä-Vuori et al., 2010). It has been demonstrated before that injection into the yolk during the epiboly stage leads to successful diffusion of the injected material within the yolk without later outward flux (Hagedorn et al., 1997; Janik et al., 2000; Robles et al., 2006). Furthermore, injecting the yolk at 30% epiboly stage can be advantageous for later embryo recovery because the blastoderm is expected to cover the puncture hole during its rapid spreading. Thus, the injection period as well as the volume (4.6 nl) seemed appropriate for the zebrafish embryos because no negative effects on survival or development were recorded. Using Danieau solution, all injection trials yielded good survival rate up to 4 dpf (86–92%), comparable with the results obtained by Janik et al. who injected eggs with embryo medium (Janik et al., 2000). Moreover, the low permeability of YSL and its role in regulating yolk consumption (Carvalho and Heisenberg, 2010), could have protected the developing embryo from immediate exposure to the high glucose load in the yolk reserve. This possibly explains why survival rate was not affected by the injection of such high concentrations of glucose. In natural conditions, a cyprinid egg contains low amounts of carbohydrates (1.5–6.2% dry mass) of which glycogen represents the major constituent (up to 3 mg per egg) (Hoar and Randall, 1988; Linhart et al., 1995). This is confirmed by the relatively low level of
glucose in non-injected eggs at 0.2 dpf (~0.03 mmol l−1), which then
slightly increased to 0.4 mmol l−1prior to hatching. A similar profile
of glucose utilization and production has been described for zebrafish by Soanes et al. (Soanes et al., 2011). Consequently, all injected glucose doses led to a substantial increase of the glucose concentration in eggs, up to 43-fold, showing that yolk reserves can be enriched with this nutrient and that microinjection is an effective way to do it.
Expression of metabolic genes in embryos and larvae
The expression of the selected metabolic genes was analysed during different stages of zebrafish development to better understand the ability to use endogenous glucose at nutritionally relevant stages of development. Genes related to glucose, lipid and glycogen metabolism as well as to glucose transport and carbohydrate digestion were all expressed at low levels at 0.2 dpf, compared with
later stages of development. This could be expected because the onset of gene expression that occurs before 0.2 dpf, during the mid-blastula transition stage, is mostly related to early processes of cell cycle and transcriptional regulation (Kane and Kimmel, 1993; Mathavan et al., 2005). This supports the hypothesis that 0.2 dpf could be a relevant period for genomic imprinting in zebrafish. At 4 dpf, larvae still rely fully on yolk-sac endogenous reserves as the only source of nutrients for growth and development (Holt, 2011). During this period the majority of genes analysed showed a significant increase in expression with the exception of the HK1 gene that showed increased expression earlier, at 1 dpf. This enhancement should be considered as a peak level during larval development and not as the onset of expression at that precise time. The high expression level indicates that important metabolic pathways were fully active at 4 dpf. In fact Mathavan et al. described that from the segmentation period (0.4 dpf) to later larval stages, a set of genes related to organogenesis begin to be expressed (Mathavan et al., 2005). During the transitional period from endogenous to exogenous feeding (6–10 dpf), larvae undergo a remarkable metamorphosis in preparation for ingesting food (Holt, 2011). PK-L, PEPCKc and AMY genes showed a higher induction of expression at 6 dpf compared with 4 dpf, probably because during this period, the formation and differentiation of two main organs involved in glucose homeostasis (liver and pancreas) is still ongoing (Chu and Sadler, 2009). A similar expression pattern to the one found in this study for the SGLT1 gene was described for the zebrafish ortholog of GLUT2, which strongly increased at 3 dpf (Castillo et al., 2009). Together these results demonstrate that, at a molecular level, the metabolic pathways associated with glucose homeostasis are fully functional in zebrafish larvae.
Yolk glucose enrichment transiently modifies metabolic gene expression in larvae
The low transcript levels of the target genes at 0.2 dpf renders this period susceptible for gene modulation. We therefore injected the yolk of embryos with very high levels of glucose, in order to determine if this early glucose stimulus could durably modify the genomic expression at later larval stages. Organogenesis begins early in zebrafish, and before the onset of exogenous feeding (5–6 dpf) all major organ systems are formed and partially functional: eyes, gut, liver, pancreas among others (Holmberg et al., 2004; Tao and Peng, 2009; Tehrani and Lin, 2011; Wallace and Pack, 2003). However, attention should be given to determining the delicate balance between the establishment of complex metabolic
Table 2. Growth parameters of zebrafish larvae and juveniles injected at 0.2 dpf with different concentrations of glucose
Control Glucose solution
dpf Saline 0.2 mol l−1 1.4 mol l−1 2.2 mol l−1
Larvae
Dry mass (mg individual−1) 4 0.06±0.00 0.06±0.00 0.04±0.01 0.04±0.01
10 0.07±0.01 0.08±0.01 0.07±0.03 0.05±0.01 Total length (mm individual−1) 4 4.02±0.07a,b 4.22±0.12b 3.92±0.23a 4.17±0.22b
10 4.75±0.67 4.96±0.97 4.74±0.91 4.45±0.81 Yolk volume (mm3) 1 0.16±0.04 0.17±0.03 0.15±0.03 0.14±0.04
4 0.01±0.00 0.03±0.01 0.03±0.02 0.02±0.01
Juveniles *
Dry mass (mg individual−1) 41 6.0±4.01 − − 6.9±4.15
Fork length (mm individual−1) 41 13.3±2.43 − − 13.9±2.45
dpf, days post-fertilization.
*For the long-term trial, the injected glucose solution was 2 mol l−1.
Values are means ± s.d.; different superscript letters represent significant differences (P<0.05, one-way ANOVA followed by Tukey’s post hoc test or Games–Howell test, when equal variances were not assumed).
The Journal of Experimental Biology
pathways controlling organ formation and the ability to achieve a genomic imprint of the nutritional stimulus exerted at early embryo stage. An acute effect of glucose injection was observed in larvae at 4 dpf, showing that most of the genes related to glucose metabolism and transport, lipid metabolism and carbohydrate digestion were downregulated compared with those in larvae from saline-injected eggs. Similar results to those found in this study (4 dpf) of the downregulation of PEPCKc and G6Pase, genes involved in gluconeogenesis, were described for juveniles of sea bream and
common carp after feeding on a high carbohydrate diet (Panserat et al., 2002). Also, it was shown that PEPCK expression responded to insulin self-production in zebrafish, suggesting that this pathway could be regulated in a similar manner to that in mammals (Elo et al., 2007). However, some of our results were unexpected, because it has been demonstrated in different fish species that dietary carbohydrates can induce enzymes involved on glycolysis, lipogenesis and carbohydrate digestion, as occurs in mammals (Caseras et al., 2000; Geurden et al., 2007; Kersten, 2001; Panserat et al., 2001a; Panserat et al., 2000; Panserat et al., 2001b; Polakof et al., 2011; Seiliez et al., 2013). Several scenarios can be proposed to explain the overall reduction in gene expression as a result of glucose overloading in the glucose-injected group (4 dpf), but further studies are needed to confirm each suggested hypothesis: (1) intensive cellular oxidative stress as a response to excessive nutrient (glucose) uptake (Wellen and Thompson, 2010); (2) susceptibility to modulation of mRNA transcription, as demonstrated for the phospholipase A2 gene in β-cells of rat with excess glucose availability (Metz et al., 1991); and (3) repression of master genes that control key regulatory systems (Corkey and Shirihai, 2012). Whether such inhibition of gene expression in the glucose-injected group at 4 dpf would persist at lower yolk glucose levels remains to be elucidated. However, cyprinid eggs (data from common carp) contain 68% water, 26% proteins, 2% fat, 1% ash and 2% carbohydrates (Hadjinikolova, 2008). Thus to achieve a marked increase of the relatively small carbohydrate fraction a high supplementation dose is required. A lower dose could mask the stimulus effect by not being enough to alter the nutrients ratio the total biochemical constituents of zebrafish eggs. Throughout larval development, the inhibitory effect on gene regulation was less pronounced, as confirmed at 6 dpf, when only glycogen phosphorylase (GP) and glucose transporter (SGLT1) were downregulated. Later still, at 10 dpf, the inhibition caused by the early glucose supplementation was no longer observed in all metabolic pathways. It seems that the early gene expression pattern faded after larvae had totally consumed the yolk reserve (into which glucose was injected), suggesting a transient effect on gene regulation. Maddison and Chen showed that the number of zebrafish β-cells was rapidly increased after a persistent, but not intermittent, exposure to glucose excess (Maddison and Chen, 2012). In our study, from 5 dpf onwards, larvae were only fed with Artemia nauplii, which have a low carbohydrate content (approximately 11% dry mass) (Lavens and Sorgeloos, 1996), making this dietary regime inappropriate for enhancing the expression of glucose-related genes. A combination of genetic, metabolic and physiological factors could be associated with the regulation of target genes at 10 dpf. Nevertheless, 10 dpf zebrafish larvae relying exclusively on exogenous food from the glucose-injected eggs showed an upregulation of the GS gene, suggesting a possible enhancement of glycogen storage. The induction of glycogenesis by carbohydrate intake has been demonstrated for other species such as sea bream, cod, Atlantic salmon and common carp (Ekmann et al., 2012; Hemre et al., 2002; Panserat et al., 2000; Shimeno et al., 1995).
Yolk glucose enrichment has little effect on metabolic genes in juveniles fed high levels of digestible
carbohydrates
Mammalian programmed cells are able to quickly react to an external stimulus (e.g. nutrient) and ‘remember’ the response once the stimulus is removed and reintroduced at later stages (Bird, 2002). Recently, Olsen et al. showed that diabetic metabolic memory could be heritable to new generations of hyperglycemic
A
B
C
0 2 4 6 8 10 12 4 dpf 6 dpf 10 dpf GK/EF1 0 0.5 1.0 1.5 2.0 2.5 Viscera Muscle 41 dpf 0 0.4 0.8 1.2 1.6 2.0 HK1/EF1 0 0.5 1.0 1.5 2.0 0 0.4 0.8 1.2 1.6 PK-L/EF1 0 0.4 0.8 1.2 1.6 0 0.4 0.8 1.2 1.6 2.0 PK-M/EF1 0 0.4 0.8 1.2 1.6 2.0 0 1.0 2.0 3.0 PEPCKc/EF1 0 1.0 2.0 3.0 0 0.4 0.8 1.2 1.6 G6Pase/EF1 0 0.4 0.8 1.2 1.6 0 1.0 2.0 3.0 4.0 F AS/EF1 0 1.0 2.0 3.0 4.0 0 0.5 1.0 1.5 2.0 2.5 ACCa/EF1 0 0.5 1.0 1.5 2.0 2.5 0 0.4 0.8 1.2 1.6 G6PDH/EF1 0 0.4 0.8 1.2 1.6 0 0.4 0.8 1.2 1.6 MEc/EF1 0 0.4 0.8 1.2 1.6 n.a. n.a. n.a. n.a. n.a. n.a. n.a. n.a. n.a.D
E
0 0.4 0.8 1.2 1.6 2.0 GS/EF1 0 0.4 0.8 1.2 1.6 2.0 0 0.4 0.8 1.2 1.6 GP/EF1 0 10 20 30 40 50 0 0.4 0.8 1.2 1.6 SGL T1/EF1 0 0.4 0.8 1.2 1.6 0 0.4 0.8 1.2 1.6 AMY/EF1 0 0.4 0.8 1.2 1.6 n.a. n.a. Saline Glucose 4 dpf 6 dpf 10 dpf Viscera Muscle 41 dpf 4 dpf 6 dpf 10 dpf Viscera Muscle 41 dpf 4 dpf 6 dpf 10 dpf Viscera Muscle 41 dpf 4 dpf 6 dpf 10 dpf Viscera Muscle 41 dpf 4 dpf 6 dpf 10 dpf Viscera Muscle 41 dpf 4 dpf 6 dpf 10 dpf Viscera Muscle 41 dpf 4 dpf 6 dpf 10 dpf Viscera Muscle 41 dpf 4 dpf 6 dpf 10 dpf Viscera Muscle 41 dpf 4 dpf 6 dpf 10 dpf Viscera Muscle 41 dpf 4 dpf 6 dpf 10 dpf Viscera Muscle 41 dpf 4 dpf 6 dpf 10 dpf Viscera Muscle 41 dpf 4 dpf 6 dpf 10 dpf Viscera Muscle 41 dpf 4 dpf 6 dpf 10 dpf Viscera Muscle 41 dpf * * * * * * * * * * * * * * * * * *Fig. 3. Short-term and long-term effects of glucose injection on gene expression in larvae at 4, 6 and 10 dpf and juveniles at 41 dpf. The
genes were those involved in (A) glycolysis: GK, HK1, PK-L, PK-M; (B) gluconeogenesis: PEPCKc, G6Pase; (C) lipogenesis: FAS, ACCα, G6PDH, MEc; (D) glycogen metabolism: GS, GP; and (E) glucose transport and carbohydrate digestion: SGLT1 and AMY, respectively. The control group was injected with saline solution. Total RNA was extracted from whole larvae (N=6, up to 10 dpf) or viscera and muscle (N=8, juveniles). Relative expression levels were measured using real-time quantitative RT-PCR and normalized to the α-elongation factor 1 (EF1α) gene. Values are means + s.d. *P<0.05, significantly different (Student’s t-test) among injection treatment. n.a., not applicable.
The Journal of Experimental Biology
zebrafish, through mechanisms related to DNA demethylation (Olsen et al., 2012). After establishing that acute effects of the early glucose injection on the expression of several genes associated with intermediary metabolism were transient, we investigated whether such stimulus could have a long-term effect, by challenging juvenile fish with a high digestible carbohydrate regime. A previous study applying a hyperglucidic stimulus at the onset of exogenous feeding of rainbow trout failed to demonstrate persistent molecular adaptations of genes involved in glucose transport or metabolism (Geurden et al., 2007). Similarly in our work, the expression of the most studied genes associated with glucose metabolism was not affected by the supplementation of glucose to the embryo and subsequent feeding of juvenile fish with a diet rich in digestible carbohydrates. Only a few genes showed signs of a long-term regulation, similar to the one observed in the acute effect (4 dpf): the PEPCKc and SGLT1 genes were downregulated in viscera, whereas the GS gene was upregulated in muscle (but a different effect was registered, with GS inhibition occurring in viscera). These results suggest that the few molecular adaptations achieved on juvenile fish (with the exception of HK1) could be already present at larval stages as a result of the early glucose supplementation. The lower level of SGLT1 gene expression found in juveniles subjected to early glucose stimulus may indicate a potential decrease of postprandial glycaemia by lowering the intestinal transport of glucose. The reason why the HK1 gene was downregulated in visceral tissue remains unclear, because unlike GK, this enzyme does not seem to be regulated by nutritional factors, at either the molecular expression or activity levels (Enes et al., 2009; González-Alvarez et al., 2009; Soengas et al., 2006). Despite being rather weak effects and based only on molecular data, juveniles conditioned by an early glucose stimulus tend to show an enhanced capacity for glucose storage in muscle, lower glucose production in liver and lower glucose transport in the intestinal lumen. However, to substantiate such regulation of metabolic pathways further studies are needed to assess its physiological relevance at the enzymatic and metabolic level.
In our study, we have explored the concept of nutritional programming in fish, a process that has mainly been studied in mammals, whereby maternal nutrition can induce alterations in offspring gene regulation. Mammals and fish are physiological different in terms of embryonic development, and therefore embryos are exposed to external stimuli in distinct ways: in the uterus the foetus is directly linked to maternal nutritional experiences, whereas in fish eggs the embryos rely exclusively on their endogenous yolk reserves. But despite this difference, it has been shown that fish share a high genetic similarity with mammals and thus some mechanisms for gene regulation, including nutritional regulation, can be conserved (Hemre et al., 2002; Ulloa et al., 2011). The present study showed that glucose supplementation in the early embryo had no marked benefits (at a molecular level) on the ability of zebrafish larvae and juveniles to cope with high glucose as a metabolic substrate. A possible impairing effect of glucose overload at such an early embryonic stage should be taken into consideration while assessing the few molecular changes observed in juveniles. Consequently, the nutritional programming concept was not fully established for zebrafish.
Conclusions
Little is known about the mechanisms underlying nutrient supplementation during fish embryogenesis and the ability to achieve a genomic imprinting at early embryo stages. Given the marked differences existing between mammals and teleost fish
regarding the exposure of embryos to nutritional stimuli (continuous in uterus maternal transfer versus exclusive endogenous egg yolk reserves) comparisons between mammals and fish should be more focused on molecular aspects than physiological aspects. Our study presented a novel approach on how to manipulate nutritional reserves of fish embryos in order to study its effects on the long-term molecular regulation of metabolic pathways. However, our data showed that glucose supplementation in the early embryo had no marked effect, at a molecular level, on the ability of zebrafish juveniles to cope with high carbohydrate intake. But despite this lack of effects, we cannot conclude that nutritional programming is not viable in fish. Based on our results, future studies on the use of glucose as a trigger for nutritional programming, would benefit from: (1) targeting a highly carnivorous fish species with low tolerance to dietary carbohydrates; (2) using embryos at a later development stage with fully functional metabolic pathways; (3) defining an adequate supplemental dose of glucose to avoid a potential overload status and consequently cellular damage; (4) exploring the effect of intermittent versus persistent nutritional stimulus and use of a high carbohydrate/low protein diet to validate the effects at the juvenile stage.
MATERIALS AND METHODS Rearing conditions
For each trial, zebrafish eggs were obtained from natural spawnings of wild-type fish maintained at the Centre of Marine Sciences, University of Algarve, Faro, Portugal. Eggs were incubated and larvae were raised under identical and standardized conditions as described previously (Westerfield, 2000). In all trials, experimental treatments were conducted in triplicate and larvae were conditioned to an initial stock density of 100 individuals per litre. At 5 dpf larvae were fed with Artemia nauplii, three times per day in excess. In the long-term trial, a gradual replacement of Artemia nauplii with an inert diet occurred from 10 to 15 dpf, after which the larvae were fed exclusively with an inert diet. A schematic view of the feeding plan adopted for the various trials is presented in Fig. 4. Animal care and experiments were carried out in compliance with the Guidelines of the European Union Council (86/609/EU) and Portuguese legislation for the use of laboratory animals.
Microinjection of zebrafish eggs with glucose
Embryos were microinjected using a nanoliter 2000 injector (World Precision Instruments, Sarasota, FL, USA) linked to a stereoscopic microscope. Needles for microinjection were made in a puller (Narishige PN-30, Setagaya, Tokyo, Japan) using glass capillary with an internal filament (1.14 o.d.; 0.5 mm i.d.). For injection, embryos were lined up on an agar holder (1.5%), as described by Westerfield (Westerfield, 2000). Eggs were injected at 0.2 dpf [approximately at 30% epiboly stage, according to Kimmel et al. (Kimmel et al., 1995)] into the yolk with 4.6 nl of either saline solution (Danieau: 58 mmol l−1 NaCl, 0.7 mmol l−1 KCl, 0.4 mmol l−1
MgSO4, 0.6 mmol l−1 Ca(NO3)2, 5 mmol l−1 Hepes, pH 7.6) or glucose
solutions. Glucose solutions were prepared with D-glucose (Sigma-Aldrich, St Louis, MO, USA) dissolved in saline solution. To assess the tolerance of zebrafish embryos to yolk supplementation with glucose by microinjection, preliminary experiments were carried out with graded concentrations of glucose (0.2, 1.4 and 2.2 mol l−1). The highest dose was based on the
maximum solubility of glucose in water. Additional treatments consisted of no injection and saline injection. Criteria used to assess glucose supplementation tolerance of zebrafish were egg osmolality, embryonic development (total length and yolk volume; N=15 larvae), growth (dry mass;
N=3 of pooled samples) and mortality.
Experimental design and sampling
Three experimental trials were conducted separately, each using a pool of eggs from several zebrafish breeders.
The Journal of Experimental Biology
Expression of target metabolic genes at relevant embryonic and larval stages
To assess the expression levels of target metabolic genes, triplicate groups of zebrafish (N=300) were reared up to 10 dpf according to standardized procedures mentioned above. Glucose levels in eggs, embryos and larvae (25 individuals per replicate) were determined from fertilization (0 dpf) to 4 dpf. Based on critical periods for larval nutrition (exclusive reliance on endogenous yolk nutrients, transition to exogenous feeding and exclusive reliance on exogenous feeding), samples for gene expression analysis (N=3 per developmental stage) were collected at 0.2, 1, 4, 6, 10 dpf (Fig. 4A). Embryos and larvae were randomly sampled, snap-frozen in liquid nitrogen and stored at –80°C until further analysis.
Short-term effect of early glucose injection in zebrafish larvae
This trial evaluated the effect of injecting the yolk with glucose on the gene expression of target metabolic pathways in zebrafish larvae. The concentration of glucose solution was set at 2 mol l−1in order to achieve a
high supplementation dose. Fertilized eggs were injected either with glucose or with saline solution. Triplicate groups (N=200) of each treatment were reared up to 10 dpf and larvae were fed with Artemia nauplii (Fig. 4A). An additional group of non-injected eggs was maintained as a biological control of egg quality. Mortality was recorded daily. Following injection, eggs (N=30) we collected to confirm glucose supplementation. Larvae (whole body) of each injection treatment as well as the non-manipulated group were randomly sampled at 4, 6 and 10 dpf (N=6, per treatment), frozen in liquid nitrogen and stored at –80°C for molecular analyses. Exogenous feeding larvae (6 and 10 dpf) were sampled 4 h after the last meal to avoid food being present in the gastric tract.
Long-term effect of early glucose injection in zebrafish juveniles This trial assessed the long-term effects of yolk supplementation with glucose on growth and gene expression of target metabolic pathways of zebrafish juveniles subjected to a dietary challenge with a high carbohydrate content. Triplicate groups of eggs (N=100) were injected with either glucose (2 M) or saline solution. Each treatment group was reared under standardized conditions until 41 dpf (juvenile stage). A group of non-injected eggs was included as an egg quality control. After injection, samples (N=30 eggs) were taken from both treatments for glucose quantification. Larvae from both injection treatments were initially fed with Artemia nauplii for 10 days (5−15 dpf). During this period, a gradual transition to inert diet was conducted by co-feeding. From 15 to 25 dpf fish were fed exclusively with the control diet (low in digestible carbohydrates). From 25 to 41 dpf, both treatments received the ‘challenge’ diet, with a high level of digestible carbohydrates. The feeding plan is detailed in Fig. 4B. Both the control and challenge diets were isoproteic (52% crude protein) and isolipidic (14.5% crude lipid), but contained very distinct levels of digestible carbohydrates. Changes in the digestible carbohydrate content of the diets were achieved by the use of raw starch and cellulose as carbohydrate sources in the control diet and their total replacement by a pre-gelatinized starch and D-glucose in the challenge diet. Diets were manufactured by low-shear extrusion
(SPAROS Lda., Olhão, Faro, Portugal). Formulation and proximate composition of diets is presented in Table 3. Diets were sieved into three size classes of 50–100, 100–200 and 200–400 μm and delivered according to larval size. Feed was distributed by hand, three to four times a day to visual satiety, and a good acceptance of both diets was recorded. At the end of the trial (4 dpf), individual samples were randomly collected from each treatment for dry mass and fork length determination (N=30 per treatment) and gene expression analysis (N=8 per treatment), where each individual was dissected for separate collection of viscera (all abdominal content) and muscle (remaining body parts). Samples were then snap-frozen in liquid nitrogen and kept at –80°C until molecular analysis.
Analytical methods
The diets was analysed for the following components: dry matter, after drying at 105°C for 24 h; ash content, by incineration in a muffle furnace at 500°C for 12 h; crude protein (N×6.25), by a flash combustion technique followed by a gas chromatographic separation and thermal conductivity detection Table 3. Formulation and composition of diets used for zebrafish larvae and juveniles
Ingredients (%) Control Challenge
Fishmeal 45.0 45.0
Fish protein concentrate 5.0 5.0 Wheat gluten 10.0 10.0 Raw pea starch 10.0 − Gelatinised pea starch − 10.0
Cellulose 10.0 −
Fish oil 5.0 5.0
Krill phospholipids 10.0 10.0 Vitamin & Mineral Premix* 2.0 2.0
D-glucose − 10.0
Binder (guar gum) 3.0 3.0 Proximate composition Dry matter (DM) (%) 95.6±0.21 95.3±0.17 Crude protein (% DM) 52.1±0.92 52.2±0.56 Crude fat (% DM) 14.6±0.43 14.6±0.32 Ash (% DM) 9.2±0.07 9.2±0.02 Gross energy (KJ g−1) 19.3±0.05 19.3±0.03
*Commercial premix for freshwater fish. Vitamins (IU or mg kg−1diet):
DL-alpha tocopherol acetate, 100 mg; sodium menadione bisulphate, 25 mg; retinyl acetate, 20,000 IU; DL-cholecalciferol, 2000 IU; thiamin, 30 mg; riboflavin, 30 mg; pyridoxine, 20 mg; B12, 0.1 mg; nicotinic acid, 200 mg; folic acid, 15 mg; ascorbic acid, 1000 mg; inositol, 500 mg; biotin, 3 mg; calcium panthotenate, 100 mg; choline chloride, 1000 mg, betaine, 500 mg. Minerals (g or mg kg−1diet): cobalt sulphate, 2.5 mg; copper sulphate, 1.1 mg; ferric
citrate, 0.2 g; potassium iodide, 5 mg; manganese sulphate, 15 mg; sodium selenite, 0.2 mg; zinc sulphate, 40 mg; magnesium hydroxide, 0.6 g; potassium chloride 1.1 g; sodium chloride, 0.5 g; calcium carbonate, 4 g.
0 Control diet Artemia nauplii Challenge diet dpf 0.2 1 4 6 10 0 5 10 15 25 41 Sampling Developmental period Embryo Larvae Juvenile
Hatching
A
B
Juvenile Mixed feeding Embryo late stage Exogenous feeding Injection period Endogenous feeding Artemia nauplii dpfFig. 4. Feeding plan and sampling regimes during the various experimental trials.
(A) Gene expression profile and short-term trial; (B) long-term trial. Age is given in days post-fertilization (dpf) at 28°C.
The Journal of Experimental Biology
(LECO FP428, St Joseph, MI, USA); fat, by dichloromethane extraction (Soxhlet method); gross energy, in an adiabatic bomb calorimeter (IKA C2000, Staufen, Germany). Glucose levels of eggs and embryos were determined by fluorescence spectroscopy using a commercial kit (Amplit Glucose Quantitation Kit, AAT Bioquest, Sunnyvale, CA, USA). Fluorescence readings were performed in triplicate using a SynergyTM 4 Multi-Mode
Microplate Reader controlled by Gen5TMsoftware (BioTek Instruments,
Winooski, VT, USA). The osmolality of non-injected and injected eggs as well as of all injected solutions was measured using the OSMOMAT 030 system (Gonotec, Berlin, Germany). For dry mass determination samples were freeze-dried for 24 h and weighed in a balance with 0.01 mg precision (Denver Instruments, Glendale, CA, USA). Total length, fork length and yolk dimensions were measured from digital photographs using AxioVision 4.8.2 image analysis software (Carl Zeiss Ltd, Cambridge, UK). Yolk volume was calculated using the formula V=(π /6)×LH2, where L is the length and H is the
height of the yolk sac (Bagarinao, 1986).
Analysis of metabolic gene expressions by qRT-PCR
The molecular analysis was focused on the expression of target genes involved in intermediary metabolism such as glucose metabolism (GK; HK1; PK-L, PK-M; PEPCKc; G6Pase) and transport (SGLT1), lipogenesis (FAS; ACCα; G6PDH; MEc), glycogen metabolism (GS; GP) and carbohydrate digestion (AMY). Genes related to lipogenesis were included in this study because most of the lipogenic enzymes are upregulated by an increase of dietary carbohydrates which stimulates glucose metabolism (Towle et al., 1997). Total RNA was extracted from a pool of embryos and larvae (whole body) and from individual viscera and muscle of juveniles using TRIzol®reagent (Invitrogen, Carlsbad, CA, USA), following the
manufacturer’s recommendations (1 ml for all homogenizations). RNA samples were quantified spectrophotometrically and integrity was assessed by electrophoresis through a 1% agarose gel containing ethidium bromide. Total RNA (1 μg) was reverse transcribed into cDNA using the SuperScriptTMIII Reverse Transcriptase kit (Invitrogen) and random primers
(Promega, Charbonniéres, France). mRNA levels were determined by quantitative real-time RT-PCR using the MYiQTM iCycler (Bio-Rad,
Hercules, CA, USA). Analyses were performed on 5 μl of the diluted cDNA using the iQ™ SYBR®Green supermix in a total PCR reaction volume of
15 μl containing 200 nmol l−1of each primer. Specific primers for zebrafish
were used according to Seiliez et al. and in some cases primers were designed using Primer3 software (Table 4) (Seiliez et al., 2013). Thermal cycling was initiated by incubation at 95°C for 90 s for Taq DNA polymerase activation. Thirty-five steps of q-PCR were performed, each one consisting of denaturing at 95°C for 20 s and annealing and extension at 55°C for 30 s. After the final cycle of the PCR, melting curves were systematically monitored (55°C temperature gradient at 0.5°C s−1from 55
to 94°C). For some pairs of primers the annealing temperature was 62°C, as indicated in Table 4. Each q-PCR run included duplicates of samples (reverse transcription) and negative controls (wells without reverse transcriptase, mRNA and cDNA). Elongation factor-1 alpha (EF1α) was employed as a reference gene and it was found to be stably expressed in this study, except during early embryo stages of development were it was replaced by 18S rRNA gene (18S) (McCurley and Callard, 2008). Relative quantification of target gene expression was performed using the mathematical model described by Pfaffl (Pfaffl, 2001).
Statistical analysis
The results are presented as means ± s.d. For survival, dry mass, yolk volume and total length of the samples from the preliminary experiment (tolerance to high glucose levels), a one-way ANOVA was performed to assess differences between the saline injection and the several concentrations of glucose injection. Tukey’s test (HSD) was used to identify differences between the means and in cases of unequal variances the Games–Howell test was used. Differences of gene expression levels during embryogenesis were analysed by the non-parametric Kruskal–Wallis test followed by Dunnett’s test, because of the reduced sample amount (N=3) analysed in each time point. The control group for gene expression analysis during embryogenesis was 0.2 dpf. To analyse the results of gene expression between glucose and saline injection an unpaired two-tailed Student’s t-test was performed. Control group for the injection trials was the saline treatment. Results from growth performance of juveniles were analysed with an unpaired two-tailed Student’s t-test. All analyses were performed using the software package SPSS® 16.0 for Windows® and the level of
significance was set at P<0.05. Acknowledgements
The authors would like to acknowledge C. Barrios, H. Teixeira and R. Colen for their assistance during embryo microinjection and to E. Plagnes-Juan for advice and support on molecular biology procedures.
Competing interests
The authors declare no competing financial interests. Author contributions
F.R. conducted the experiments, analysed all data, performed the statistical analysis, prepared the figures and wrote the manuscript; J.D. and S.P. designed the study and supervised the research; F.R. and S.P. were responsible for gene expression analysis; J.D. formulated and manufactured the diets; S.E., P.G., I.G., M.T.D., J.D. and S.P. contributed to the final version of the manuscript. Funding
This work was supported by Fundação para a Ciência e a Tecnologia, Portugal [project number PTDC/CVT/102481/2008 and grant numbers SFRH/BD/ Table 4. Primers used for mRNA quantification by qRT-PCR
Gene Forward primer (5′–3′) Reverse primer (5′–3′) Accession Ta(°C)
GK GCTGTGAAGTCGGCATGATA CTTCAACCAGCTCCACCTTAC BC122359.1a 55
HK1 ACTTTGGGTGCAATCCTGAC AGACGACGCACTGTTTTGTG BC067330.1a 55
PK-L TCCTGGAGCATCTGTGTCTG GTCTGGCGATGTTCATTCCT BC152219.1a 55
PK-M TGGGCTTATTAAGGGCAGTG TGCACCACCTTTGTGATGTT BC165710.1a 55
PEPCKc ATCACGCATCGCTAAAGAGG CCGCTGCGAAATACTTCTTC NM_214751.1a 55
G6Pase TCACAGCGTTGCTTTCAATC AACCCAGAAACATCCACAGC BC164161.1a 55
GS GCAGCTCAGTGTGACGAACC GGTCCCCTGCTTCCTTATCC NM_201180.1b 62
GP AGAAGCCGGAGAGGAAAACC TCTCAGGCTGTTTCGGTGAA BC085616.2b 62
SGLT1 GGATTGACCTGGAGGCAGAC GCGTTGACCACATTTCTCCA BC067621.1b 62
FAS GAGGGAAATCCGACAGTTGA GACTCCAACAGAGCCTGAGC XM_001923608.3a 55
ACCα CACGATGCTCAGTTGTGTCC CCATGACAGTGGACTTGACG XM_001919780.3a 55
G6PDH CGTCTTTTGTGGCAGTCAGA TGATGGGTGGTGTTTTCTCA XM_694076.5a 55
MEc TCAAGGCTATGGCATCCTTC ATATCCCCCTTCCCTCAGTG BC152078b 55
AMY AGACCAGCCTCCAGGGTACA AAGCGACCAATAGGCTGGAA XM_001919100.3b 62
18S GAACGCCACTTGTCCCTCTA GTTGGTGGAGCGATTTGTCT FJ915075.1a 55
EF1α CTGGAGGCCAGCTCAAACAT ATCAAGAAGAGTAGTACCGCTAGCATTAC NM_131263b 55 aFrom Seiliez et al., 2013.
bAccession number from http://www.ncbi.nlm.nih.gov.
The Journal of Experimental Biology
74921/2010 and SFRH/BPD/49051/2008 to F.R. and S.E. respectively]; and travelgrants in in the framework of Program PESSOA-EGIDE 2011-2012 to J.D., S.E., P.G. and S.P.].
References
Ali, S., Champagne, D. L., Spaink, H. P. and Richardson, M. K. (2011). Zebrafish embryos and larvae: a new generation of disease models and drug screens. Birth
Defects Res. C Embryo Today 93, 115-133.
Andersen, I. S., Reiner, A. H., Aanes, H., Aleström, P. and Collas, P. (2012). Developmental features of DNA methylation during activation of the embryonic zebrafish genome. Genome Biol. 13, R65.
Babin, P. J., Cerdà, J. and Lubzens, E. (2007). The Fish Oocyte: From Basic Studies
to Biotechnological Applications. Dordrecht, The Netherlands: Springer.
Bagarinao, T. (1986). Yolk resorption, onset of feeding and survival potential of larvae of three tropical marine fish species reared in the hatchery. Mar. Biol. 91, 449-459. Bird, A. (2002). DNA methylation patterns and epigenetic memory. Genes Dev. 16,
6-21.
Burdge, G. C. and Lillycrop, K. A. (2010). Nutrition, epigenetics, and developmental plasticity: implications for understanding human disease. Annu. Rev. Nutr. 30, 315-339.
Campos, C., Valente, L., Conceição, L., Engrola, S. and Fernandes, J. (2013). Temperature affects methylation of the myogenin putative promoter, its expression and muscle cellularity in Senegalese sole larvae. Epigenetics 8, 389.
Carvalho, L. and Heisenberg, C. P. (2010). The yolk syncytial layer in early zebrafish development. Trends Cell Biol. 20, 586-592.
Caseras, A., Metón, I., Fernández, F. and Baanante, I. V. (2000). Glucokinase gene expression is nutritionally regulated in liver of gilthead sea bream (Sparus aurata).
Biochim. Biophys. Acta 1493, 135-141.
Castillo, J., Crespo, D., Capilla, E., Díaz, M., Chauvigné, F., Cerdà, J. and Planas, J. V. (2009). Evolutionary structural and functional conservation of an ortholog of the GLUT2 glucose transporter gene (SLC2A2) in zebrafish. Am. J. Physiol. 297, R1570-R1581.
Chu, J. and Sadler, K. C. (2009). New school in liver development: lessons from zebrafish. Hepatology 50, 1656-1663.
Corkey, B. E. and Shirihai, O. (2012). Metabolic master regulators: sharing information among multiple systems. Trends Endocrinol. Metab. 23, 594-601. Culp, P., Nüsslein-Volhard, C. and Hopkins, N. (1991). High-frequency germ-line
transmission of plasmid DNA sequences injected into fertilized zebrafish eggs. Proc.
Natl. Acad. Sci. USA 88, 7953-7957.
Ekmann, K. S., Dalsgaard, J., Holm, J., Campbell, P. J. and Skov, P. V. (2012). Glycogenesis and de novo lipid synthesis from dietary starch in juvenile gilthead sea bream (Sparus aurata) quantified with stable isotopes. Br. J. Nutr. 109, 2135-2146. Elo, B., Villano, C. M., Govorko, D. and White, L. A. (2007). Larval zebrafish as a
model for glucose metabolism: expression of phosphoenolpyruvate carboxykinase as a marker for exposure to anti-diabetic compounds. J. Mol. Endocrinol. 38, 433-440.
Enes, P., Panserat, S., Kaushik, S. and Oliva-Teles, A. (2009). Nutritional regulation of hepatic glucose metabolism in fish. Fish Physiol. Biochem. 35, 519-539. Enes, P., Panserat, S., Kaushik, S. and Oliva-Teles, A. (2011). Dietary carbohydrate
utilization by European Sea Bass (Dicentrarchus labrax L.) and Gilthead Sea Bream (Sparus aurata L.) Juveniles. Rev. Fish. Sci. 19, 201-215.
Fernández-Palacios, H., Izquierdo, M. S., Robaina, L., Valencia, A., Salhi, M. and Vergara, J. (1995). Effect of n − 3 HUFA level in broodstock diets on egg quality of gilthead sea bream (Sparus aurata L.). Aquaculture 132, 325-337.
Fernández-Palacios, H., Izquierdo, M., Robaina, L., Valencia, A., Salhi, M. and Montero, D. (1997). The effect of dietary protein and lipid from squid and fish meals on egg quality of broodstock for gilthead seabream (Sparus aurata). Aquaculture 148, 233-246.
Geurden, I., Aramendi, M., Zambonino-Infante, J. and Panserat, S. (2007). Early feeding of carnivorous rainbow trout (Oncorhynchus mykiss) with a hyperglucidic diet during a short period: effect on dietary glucose utilization in juveniles. Am. J. Physiol. 292, R2275-R2283.
González-Alvarez, R., Ortega-Cuellar, D., Hernández-Mendoza, A., Moreno-Arriola, E., Villaseñor-Mendoza, K., Gálvez-Mariscal, A., Pérez-Cruz, M. E., Morales-Salas, I. and Velázquez-Arellano, A. (2009). The hexokinase gene family in the zebrafish: structure, expression, functional and phylogenetic analysis. Comp.
Biochem. Physiol. 152B, 189-195.
Hadjinikolova, L. (2008). Investigations on the chemical composition of carp (Cyprinus
carpio L.), bighead carp (Aristichthys nobilis Rich.) and pike (Esox lusius L.) during
different stages of individual growth. Bulgarian Journal of Agricultural Science 14, 121-126.
Hagedorn, M., Hsu, E., Kleinhans, F. W. and Wildt, D. E. (1997). New approaches for studying the permeability of fish embryos: toward successful cryopreservation.
Cryobiology 34, 335-347.
Hemre, G. I., Mommsen, T. P. and Krogdahl, A. (2002). Carbohydrates in fish nutrition: effects on growth, glucose metabolism and hepatic enzymes. Aquac. Nutr. 8, 175-194.
Hoar, W. S. and Randall, D. J. (1988). The Physiology of Developing Fish, Eggs and
Larvae (Fish Physiology, Vol. 11). London: Academic Press.
Holmberg, A., Schwerte, T., Pelster, B. and Holmgren, S. (2004). Ontogeny of the gut motility control system in zebrafish Danio rerio embryos and larvae. J. Exp. Biol. 207, 4085-4094.
Holt, G. J. (2011). Larval Fish Nutrition. Danvers, MA: Wiley-Blackwell, John Wiley & Sons.
Hölttä-Vuori, M., Salo, V. T., Nyberg, L., Brackmann, C., Enejder, A., Panula, P. and Ikonen, E. (2010). Zebrafish: gaining popularity in lipid research. Biochem. J. 429, 235-242.
Janik, M., Kleinhans, F. W. and Hagedorn, M. (2000). Overcoming a permeability barrier by microinjecting cryoprotectants into zebrafish embryos (Brachydanio rerio).
Cryobiology 41, 25-34.
Kamler, E. (2008). Resource allocation in yolk-feeding fish. Rev. Fish Biol. Fish. 18, 143-200.
Kane, D. A. and Kimmel, C. B. (1993). The zebrafish midblastula transition.
Development 119, 447-456.
Kersten, S. (2001). Mechanisms of nutritional and hormonal regulation of lipogenesis.
EMBO Rep. 2, 282-286.
Kimmel, C. B., Ballard, W. W., Kimmel, S. R., Ullmann, B. and Schilling, T. F. (1995). Stages of embryonic development of the zebrafish. Dev. Dyn. 203, 253-310. Kudoh, T., Tsang, M., Hukriede, N. A., Chen, X., Dedekian, M., Clarke, C. J., Kiang,
A., Schultz, S., Epstein, J. A., Toyama, R. et al. (2001). A gene expression screen in zebrafish embryogenesis. Genome Res. 11, 1979-1987.
Lavens, P. and Sorgeloos, P. (1996). Manual on The Production and Use of Live
Food For Aquaculture. Rome: Food and Agriculture Organization of the United
Nations.
Linhart, O., Kudo, S., Billard, R., Slechta, V. and Mikodina, E. V. (1995). Morphology, composition and fertilization of carp eggs: a review. Aquaculture 129, 75-93.
Lucas, A. (1998). Programming by early nutrition: an experimental approach. J. Nutr. 128 Suppl., 401S-406S.
Maddison, L. A. and Chen, W. (2012). Nutrient excess stimulates β-cell neogenesis in zebrafish. Diabetes 61, 2517-2524.
Mathavan, S., Lee, S. G. P., Mak, A., Miller, L. D., Murthy, K. R. K., Govindarajan, K. R., Tong, Y., Wu, Y. L., Lam, S. H., Yang, H. et al. (2005). Transcriptome analysis of zebrafish embryogenesis using microarrays. PLoS Genet. 1, e29. McCurley, A. T. and Callard, G. V. (2008). Characterization of housekeeping genes in
zebrafish: male-female differences and effects of tissue type, developmental stage and chemical treatment. BMC Mol. Biol. 9, 102.
Metz, S., Holmes, D., Robertson, R. P., Leitner, W. and Draznin, B. (1991). Gene expression of type I phospholipase A2 in pancreatic beta cells. Regulation of mRNA levels by starvation or glucose excess. FEBS Lett. 295, 110-112.
Navarro-Martín, L., Viñas, J., Ribas, L., Díaz, N., Gutiérrez, A., Di Croce, L. and Piferrer, F. (2011). DNA methylation of the gonadal aromatase (cyp19a) promoter is involved in temperature-dependent sex ratio shifts in the European sea bass. PLoS
Genet. 7, e1002447.
Olsen, A. S., Sarras, M. P., Jr, Leontovich, A. and Intine, R. V. (2012). Heritable transmission of diabetic metabolic memory in zebrafish correlates with DNA hypomethylation and aberrant gene expression. Diabetes 61, 485-491.
Panserat, S. and Kaushik, S. (2010). Regulation of gene expression by nutritional factors in fish. Aquac. Res. 41, 751-762.
Panserat, S., Médale, F., Blin, C., Brèque, J., Vachot, C., Plagnes-Juan, E., Gomes, E., Krishnamoorthy, R. and Kaushik, S. (2000). Hepatic glucokinase is induced by dietary carbohydrates in rainbow trout, gilthead seabream, and common carp. Am. J.
Physiol. 278, R1164-R1170.
Panserat, S., Capilla, E., Gutierrez, J., Frappart, P. O., Vachot, C., Plagnes-Juan, E., Aguirre, P., Brèque, J. and Kaushik, S. (2001a). Glucokinase is highly induced and glucose-6-phosphatase poorly repressed in liver of rainbow trout (Oncorhynchus
mykiss) by a single meal with glucose. Comp. Biochem. Physiol. 128B, 275-283.
Panserat, S., Plagnes-Juan, E. and Kaushik, S. (2001b). Nutritional regulation and tissue specificity of gene expression for proteins involved in hepatic glucose metabolism in rainbow trout (Oncorhynchus mykiss). J. Exp. Biol. 204, 2351-2360. Panserat, S., Plagnes-Juan, E. and Kaushik, S. (2002). Gluconeogenic enzyme
gene expression is decreased by dietary carbohydrates in common carp (Cyprinus
carpio) and gilthead seabream (Sparus aurata). Biochim. Biophys. Acta 1579, 35-42.
Patel, M. S. and Srinivasan, M. (2002). Metabolic programming: causes and consequences. J. Biol. Chem. 277, 1629-1632.
Patel, M. S., Srinivasan, M. and Laychock, S. G. (2009). Metabolic programming: role of nutrition in the immediate postnatal life. J. Inherit. Metab. Dis. 32, 218-228. Pfaffl, M. W. (2001). A new mathematical model for relative quantification in real-time
RT-PCR. Nucleic Acids Res. 29, e45.
Polakof, S., Médale, F., Larroquet, L., Vachot, C., Corraze, G. and Panserat, S. (2011). Regulation of de novo hepatic lipogenesis by insulin infusion in rainbow trout fed a high-carbohydrate diet. J. Anim. Sci. 89, 3079-3088.
Robles, V., Cabrita, E., Anel, L. and Herráez, M. P. (2006). Microinjection of the antifreeze protein type III (AFPIII) in turbot (Scophthalmus maximus) embryos: Toxicity and protein distribution. Aquaculture 261, 1299-1306.
Seiliez, I., Médale, F., Aguirre, P., Larquier, M., Lanneretonne, L., Alami-Durante, H., Panserat, S. and Skiba-Cassy, S. (2013). Postprandial regulation of growth-and metabolism-related factors in zebrafish. Zebrafish 10, 237-248.
Shimeno, S., Kheyyali, D. and Shikata, T. (1995). Metabolic response to dietary carbohydrate to protein rations in carp. Fish. Sci. 61, 277-281.
Soanes, K. H., Achenbach, J. C., Burton, I. W., Hui, J. P., Penny, S. L. and Karakach, T. K. (2011). Molecular characterization of zebrafish embryogenesis via DNA microarrays and multiplatform time course metabolomics studies. J. Proteome
Res. 10, 5102-5117.
Soengas, J. L., Polakof, S., Chen, X., Sangiao-Alvarellos, S. and Moon, T. W. (2006). Glucokinase and hexokinase expression and activities in rainbow trout tissues: changes with food deprivation and refeeding. Am. J. Physiol. 291, R810-R821. Srinivasan, M. and Patel, M. S. (2008). Metabolic programming in the immediate
The Journal of Experimental Biology
Symonds, M. E., Sebert, S. P., Hyatt, M. A. and Budge, H. (2009). Nutritionalprogramming of the metabolic syndrome. Nat. Rev. Endocrinol. 5, 604-610. Tao, T. and Peng, J. (2009). Liver development in zebrafish (Danio rerio). J. Genet.
Genomics 36, 325-334.
Tehrani, Z. and Lin, S. (2011). Endocrine pancreas development in zebrafish. Cell
Cycle 10, 3466-3472.
Towle, H. C., Kaytor, E. N. and Shih, H. M. (1997). Regulation of the expression of lipogenic enzyme genes by carbohydrate. Annu. Rev. Nutr. 17, 405-433.
Ulloa, P. E., Iturra, P., Neira, R. and Araneda, C. (2011). Zebrafish as a model organism for nutrition and growth: towards comparative studies of nutritional genomics applied to aquacultured fishes. Rev. Fish Biol. Fish. 21, 649-666. Vagner, M., Zambonino, J. L., Robin, J. and Person, J. (2007). Is it possible to
influence European sea bass (Dicentrarchus labrax) juvenile metabolism by a nutritional conditioning during larval stage? Aquaculture 267, 165-174.
Wallace, K. N. and Pack, M. (2003). Unique and conserved aspects of gut development in zebrafish. Dev. Biol. 255, 12-29.
Waterland, R. A. and Jirtle, R. L. (2004). Early nutrition, epigenetic changes at transposons and imprinted genes, and enhanced susceptibility to adult chronic diseases. Nutrition 20, 63-68.
Wellen, K. E. and Thompson, C. B. (2010). Cellular metabolic stress: considering how cells respond to nutrient excess. Mol. Cell 40, 323-332.
Westerfield, M. (2000). The Zebrafish Book. A Guide for the Laboratory Use of
Zebrafish (Danio rerio). Eugene, OR: University of Oregon Press.
Wilson, R. P. (1994). Utilization of dietary carbohydrate by fish. Aquaculture 124, 67-80.
Xu, Q. (1999). Microinjection into zebrafish embryos. In Molecular Methods in
Developmental Biology, Vol. 127 (ed. M. Guille), pp. 125-132. Totowa, NJ: Humana