A Survey on the Brazilian Assets, its performance and the investing behavioral
biases of its Investment Fund Managers
Berenice Righi Damke
William Eid Junior
Ricardo Ratner Rochman
EAESP – Fundação Getulio Vargas
Abstract
Behavioral Investing Biases are cognitive and emotional aspects that may intervene in investment decisions. In order to search for evidences of behavioral biases in the Investment Fund Managers (IFM) in Brazil, a survey with 28 questions was created and sent to 936 IFM. 98 responses were obtained. Biases lik e Optimism and Regret Aversion were present in more than 75% of the respondents. Afterwards, performance of the investment funds managed by the respondents were also analyzed in terms of Excess Return on its benchmark . Finally, fund’s performance and IFM biases were crossed, confirming that top performance IFM tend to have less biases (only 4-5 average along 18 searched biases) and rarely present Recency or Representativeness(cognitive biases).
Keywor ds: behavioral biases; investment fund managers; excess return; Brazil.
___________________________________________________________
The authors thank to João Fraga, Pedro Luiz Albertin Bono Milan, Claudia Emiko Yoshinaga, Adalto Barbaceia Gonçalves, Marcelo Bego, Ronan Cunha, Adalto Acir Althaus Junnior, Lucas Dreves, Carlos São Miguel and Andre Nardy for helpful comments and suggestions on this research.
1. Introduction
Behavioral biases are “systematic errors in judgment” (Pompian, 2006). So Behavioral Investing Biases can be
understood as cognitive and emotional aspects that may intervene in investment decisions. Cognitive biases are unconscious distortions in one’s perception that influence judgment and should be corrected or mitigated in the investing process. Emotional Biases, on the other hand, are distortions in the decision-making process due to emotional disorders and it is hard to prevent them because they are related to instinct and intuition. In the literature several studies can be found about how emotions can influence perceptions and the decision -making process. Those psychological studies have been applied to Finance aiming to explain financial and economic behavior, from the individual (micro) and from the market (macro) perspectives, especially from 1980 on.
Searching for evidences of cognitive and emotional biases in the Investment Fund managers (IF managers) in Brazil, a survey with 28 questions was created including personal and Assets characteristics and 18 questions to identify the presence or absence of behavioral investing biases. IF managers’ personal characteristics were investigated through questions about gender, age, graduation, post-graduation and personal investments. Asset’s information was searched through questions about being Independent or part of a conglomerate, Brazilian or foreign, location (São Paulo, Rio de Janeiro or other), fund categories (fixed income, equities, multi-markets or other funds) and total assets under management. The eighteen tested bias were: Overconfidence, Anchoring, Mental Accounting, Loss Aversion, Status Quo, Availability, Recency, Regret Aversion, Conservatism, Confirmation, Illusion of Control, Outcome, (Lack of) Self-Control, Optimism, Affinity, Representativeness, Hindsight and Framing.
The questionnaire was sent to 936 Investment Fund managers in Brazil and 98 responses were obtained. Not all tested biases were confirmed. Some biases like Optimism and Regret Aversion were present in more than 75% of the respondents , according to their answers . On the other hand, some biases like Overconfidence and Status Quo were present in less than 10% of the respondents , thus not confirming the presence of this bias in the analyzed IF managers. A detailed explanation about the meaning of each bias, the questions used to test (confirm or not) them and results obtained with this survey are presented further.
Eleven of the eighteen tested biases had at least 20% of positive responses confirming the presen ce of those biases in the 98 respondents . IF managers’ personal characteristics (like gender, age, graduation, post-graduation and personal investments) and Asset’s information (like Independent or part of a conglomerate, Brazilian or foreign, location, fund categories and total assets under management) presented low explanatory power when modeled with different regression methods against the tested biases. So descriptive statistics and relations between the questions were made to better understand the profile of IF managers in Brazil and their behavioral investing biases.
The most relevant observed characteristics can be summarized as follows. In terms of personal profile, respondents are predominantly male, on average 36 years old, with a standard deviation of 8 years, bachelors in business administration or economics, with a Master’s Degree in Brazil or abroad. Their personal investments are more
conservative (up to 20% in equities) despite of the majority of them being Equities or Multi-Markets Fund Managers and having more than R$ 100 million under their management . Their Assets were in general Independent, Brazilian, and located in São Paulo.
Afterwards, it was analyzed the performance of all funds managed by the respondents that identified themselves (it was optional). In all 63 investment funds were considered valid for this analysis, as explained in Section 5. Performance was calculated in terms of excess return on its benchmarks, from 3 years before to 1 year after the questionnaire, similarly to Tuckett and Taffler (2012). Finally, funds were ranked in terms of 10 top best and worst performance in average of the four observed years. Therefore, performance of the funds and biases of the IFM were crossed.
Analyzing the top 10 best and worst performance in terms of excess return and linking the IF managers of these funds with their cognitive and emotional biases and other personal characteristics, some of the main findings are listed below. In Section 5 it is presented the full list of findings.
1) Recency is a cognitive bias, which is present in 8 of 10 of the IFM with the worst performances. But is present in only one of 10 of the IFM with the top best performances.
2) Representativeness is a cognitive biases which is present in only 20% of the IFM with the top best performance, while is present in 60% of the IFM with the worst performances.
3) The top performance IFM in terms of excess return has only two biases: Optimism and Illusion of Control. 4) IF Managers that outperformed its benchmarks in the analyzed period tend to have less biases, ranging from 1 to 8 biases (average 4.8) among the 18 searched biases. Similarly, IFM that performed poo rly (10 worst) answered the questionnaire confirming 4 to 11 biases (average 6.6).
5) Top best performance IFM are younger (34 years old average) than the 10 worst performance IFM (40 years old average).
In this article, Section 1 introduces; Section 2 brings a review on the main articles and books about Behavior Finance and individual’s investment decisions; Section 3 is about the Investment Funds Industry and Regulation in Brazil, including the role of the IFM; Section 4 presents Data and Methodology, as well as the questionnaire results; Section 5 links Behavioral Finance and the Performance of Investment Funds, presenting the applied literature and the results of this research in terms of excess return of the funds managed by the respondents linked to its biases; and Section 6 concludes.
2. Behavioral Finance applied to the Indivi dual’s Investment Decisions: Historical Perspective
The studies on Behavioral Finance started in the end of 1970’s with the publication of Kahneman and Tversky (1979), Prospect Theory: An analysis of Decision under Risk , about human behavior and the decision process under risk. Aiming to comprehend financial investor’s day-by-day attitudes, the authors presented several problems to different groups, in which people should decide based on the benefits (win or loss) and risks involved in each decision. From this
study arose one of the most important concepts in Behavioral Finance, i.e. the “loss aversion”, and the authors concluded that people suffer much more the pain for a loss than the delight for an equivalent gain (Halfeld and Torres, 2001).
Kahneman and Tversky (1979) explain that their paper “presents a critique of expected utility theory as a descriptive model of decision making under risk, and develops an alternative model, called prospect theory. Choices among risky prospects exhibit several pervasive effects that are inconsistent with the basic tenets of utility theory. In particular, people underweight outcomes that are merely probable in comparison with outcomes that are obtained with certainty”. So, when taking financial decisions, people do not behave as the “Rational Economic Man” (REM) seeking to maximize their economic well-being, utility-optimizing goals, and ignoring social values. REM “is an individual who tries to achieve discretely specified goals to the most comprehensive, consistent extent possible while minimizing economic costs. REM´s choices are dictated by his utility function ” (Pompian, 2006).
“Facing uncertainty, most people cannot and do not systematically describe problems, record all the necessary data, or synthesize information to create rules for making decisions. Instead, most people venture down somewhat more subjective, less ideal paths of reasoning in an attempt to determine the course of action consistent with their basic judgments and preferences ” (Pompian, 2006).
Kakneman and Riepe (1998), in Aspects of investor psychology: beliefs, preferences, and biases investment
advisor should k now about, brought an important contribution to the use of behavioral finance in investment decisions.
They start by saying that “financial advising is a prescriptive activity whose main objective should be to guide investors to make decisions that best serve their interests. To advice effectively, advisors must be guided b y an accurate picture of the cognitive and emotional weaknesses of investors that relate to making investment decisions: their occasionally faulty assessment of their own interests and true wishes, the relevant facts that they tend to ignore, and the limit s of their ability to accept advice and to live with the decisions they make”. They add that “people make judgments about the probabilities; they assign value (sometimes called utilities) to outcomes; and they combine these beliefs and values to form preferences about risky options”. They identify some behavioral biases, like Overconfidence, Optimism, Hindsight, and Narrow Framing, using financial and day-by-day questions, and make several recommendations to advisors on how to deal with these biases in the client’s investment decision-making process and its possible harmful consequences.
Still in this matter, in 2005, Pompian with Longo published the article The Future of Wealth Management:
Incorporating behavioral finance into your practice, presenting some experiments to identify investor’s behavioral biases
and bringing the idea that some of those biases should be moderated and others should be adapted – and this is the main role of a financial advisor in the individual’s asset allocation process . They explain better: “Behavioral biases fall into two broad categories, cognitive and emotional, though both types yield irrational decisions. Because cognitive biases stem from faulty reasoning, better information and advice can often correct them. Conversely , because emotional biases originate from impulsive feelings or intuition – rather than conscious reasoning – they are difficult to correct. Cognitive biases include heuristics, such as anchoring and adjustment, availability, and representativeness biases. Other cognitive
biases include selective memory and overconfidence. Emotional biases include regret, self-control, loss aversion, hindsight, and denial”.
Pompian’s ideas especially guided the elaboration of a questionnaire that was applied to Investment Fund Managers in Brazil with the purpose of identifying their behavioral investing biases. These mentioned biases will be further carefully explained.
3. Investment Funds Industry and Regulation in Brazil
Brazilian regulation establishes a formal difference between “administrator” (“administrador”, in Portuguese) and “manager” (“gestor”, in Portuguese) of an investment fund. The focus of this study is to identify the behavioral investing biases from the individual point of view, i.e., from the manager’s persp ective. According to the current regulation1, the “manager” is responsible for the professional management of the financial assets that are in the fund’s portfolio (asset allocation), according to the policies established in the fund’s brochure2. He/she is entitled to: negotiate in the fund’s name its financial assets and to have the right to vote in its name, when applicable; decide the assets that will compose the portfolio, choosing those with better profitability perspectives given a certain risk level compatible with the fund’s investment policy; give buy/sell orders in the fund’s name.
In this paper, when the term “manager” is used, it is referring to “gestor” of the Investment Fund manager. In Brazil, investment funds are regulated by Comissão de Valores Mobiliários (CVM) and they are under supervision of Anbima3 (Associação Brasileira das Entidades dos Mercados Financeiro e de Capitais). Anbima establishes the parameters for the investment fund’s managers in terms of the investment fu nd’s creation and asset management’s policies, in order to standardize procedures and increase the information quality and publicity and the fiduciary patterns4. In the last two decades, the amount under management in investment funds has risen from less than R$ 100 billion to R$ 2.3 trillion – the sixth net asset in the world –, and mean net asset by fund to R$ 151 million. The number of funds increased six times in 2012, from 289 to almost 12,000 in the end of the year. Brazilian investment funds market had a very quick recover since the 2008 crisis, with a growth of 100% in its net asset since 2008 (Anbima, 2013).
Investment funds in Brazil are currently divided in 46 different categories according to the fund’s asset allocation policy and its correspondent benchmarks. For example: fixed income (5 different types), equities (11 different types), multi-markets funds (“multimercados”, in Portuguese, 10 different types), off-shore (3 different types), etc. So its
1 Source: Comissão de Valores Mobiliários (CVM – similar to Security Exchange Commission in Brazil) website: http://www.portaldoinvestidor.gov.br/menu/Menu_Investidor/fundos_investimentos/obrigacoes.html
2 “Regulamento”, in Portuguese, is here translated in English as “brochure”.
3 Anbima represents institutions in the Brazilian capital markets, including banks, assets and broker dealers to act in front of the Government, the market and the society.
4 Source: Anbima website: http://portal.anbima.com.br/fundos -de-investimento/regulacao/codigo-de-fundos-de-investimento/Pages/codigo-e-documentos.aspx
managers have to adhere to these asset allocation categories and they do not have total free will to make his/her own investment decision.
4. Methodol ogy and Results
Based on Pompian (2012), Pompian (2006), Belsky and Gilovich (1999) questionnaire with 18 questions was created. Each one of these questions aims to capture a behavioral bias, defined as “systematic erro rs in judgment”, and most commonly divided in cognitive and emotional biases.
Biases, questions and results are presented below. Questions were selected in the applied bibliog raphy considering the target interviewees (Investment Fund managers in Brazil). Questions involving bets simulations and calculation of statistic proportions were not used as well as questions involving images comparison. The study focused on questions related to investments decisions.
4.1. Data Gathering
An e-mail describing the survey was sent to 936 Investment Fund managers in Brazil, which also invited them to answer to the questions and affirmations. It was sent in total to 861 different e-mails because for some assets it was not possible to obtain the direct e-mail of each Investment Fund manager (individual corporative e-mail) but only a “generic” one (like contact@institution) – and these cases were those from which we obtained the lowest response percentage. In total, we obtained 98 responses – equivalent to 11.4% response degree. As a result of having only general e -mails especially from large Assets , which are in general part of bank conglomerates, almost 91% of the resp ondents were from Independent Assets.
The questionnaire was open for responses from March 10 to March 21, 2014.
4.2. The Questionnaire and the Behavioral Biases
As mentioned, a questionnaire with 18 questions was created (besides other 10 questions about IF managers’ characteristics and Asset’s information) based on the applied bibliography, especially in Pompian (2012), Pompian (2006) and Belsky and Gilovich (1999). Each question refers to a specific emotional or cognitive bias, as follows.
Affirmation 1: You make investment decisions with not much previous research.
Source: Belsky and Gilovich (1999), p. 170.
Tested Bias: Overconfidence
Overconfidence is an emotional bias. It is present in people who tend to overestimate both their own predictive abilities and the precision of the information received. “People think they are smarter and they have better information than they actually do” (Pompian, 2006), tending to confuse amount with quality of the information held to make decisions.
Affirmation 2: It is difficult for you to sell an asset/investment for a lower price than you paid.
Tested Bias: Anchoring
Anchoring is a cognitive bias. “Price anchoring is related to the heuristics bias and to the investor’s memory. It is based on the presupposition that an investor evaluates the price and the market expectative regarding an asset’s price based on its historical information” (KUTCHUKIAN, EID JR., and DANA, 2010). In other words : “people are generally better at estimating relative comparisons rather than absolute figures” (Pompian, 2006).
Affirmation 3: You classify your investments in categories like “new car”, “vacation” , etc.
Source: Pompian (2012), p. 98.
Tested Bias: Mental Accounting
Mental Accounting is a bias first introduced by Richard Thaler, a professor at University of Chicago. “Mental accounting is the set of cognitive operations used by individuals and households to organize, evaluate, and keep track of financial activities . (…) Both the sources and uses of funds are labeled in real as well as in mental accounting systems. Expenditures are grouped into categories (housing, food, etc.) and spending is sometimes constrained by implicit or explicit budgets. (…) components of mental accounting violate the economic principle of fungibility. As a result, mental accounting influences choice, that is, it matters ” (Thaler, 1999). People with this bias tend to save money in separated investment accounts and sometimes keep on debt in current account and/or in credit cards while holding money invested in a lower interest rate than their cost of credit.
Affirmation 4: If you buy a stock and later you read or hear news that may potentially affect the stock’s price negatively, you will wait for checking the market’s reaction and only afterwards you will decide what to do.
Source: Pompian (2012).
Tested Bias: Loss Aversion
Loss Aversion is an emotional bias developed by KAHNEMAN and TVERSKY (1979) as part of the Prospect Theory when presenting relative preferences (e.g., “I prefer avoiding a loss to realizing a gain”) (Pompian, 2006). This bias “can make investors dwell excessively on risk avoidance when evaluating possible gain s, since dodging a loss is a more urgent concern than seeking a profit. When their investments do begin to succeed, loss -averse individuals hasten to look in profits, fearing that, otherwise, the market might reserve itself and rescind their returns. The problem here is that divesting prematurely to protect gains limits upside potential. In sum, loss aversion causes invest ors to hold their losing investments to sell their winning ones, leading to suboptimal portfolio returns ” (Pompian, 2006).
Affirmation 5: When seeking for new investment alternatives, you think about this topic but end up doing nothing.
Source: Pompian (2012), p. 97.
Tested Bias: Status Quo
Status Quo is an emotional bias first introduced by SAMUELSON and ZECKHAUSER (1988) which “predispose people facing an array of choice options to elect whatever option ratifies or extends the existing condition
(i.e., the “status quo”) in lieu of alternative options that might brin g about change” (Pompian, 2006). It is a kind of “inertia”. This bias can make an investor take excessive risks or keep on investing in too conservative investments.
Affirmation 6: You frequently decide suddenly for an investment (with no much afterthought) when an investment makes sense to you.
Source: Pompian (2012), p. 96.
Tested Bias: Availability
Availability is a cognitive bias that “allows people to estimate the probability of an outcome based on how prevalent or familiar that outcome appears in their lives. People exhibiting this bias perceive easily rec alled possibilities as being more likely than those prospects that are harder to imagine or diffic ult to comprehend” (Pompian, 2006). Investors with this bias tend to estimate the probability of an event according to how familiar it seems to them. For example, events that appear more in the media seem more likely to happen than others that are ignored.
Affirmation 7: When considering investing your money in an investment fund, you consider positive return’s track record in the recent months as very relevant information to make your decision.
Source: Pompian (2006), p. 222.
Tested Bias: Recency
Recency “is a cognitive predisposition that causes people to more prominently recall and emphasize recent events and observations than those that occurred in the near or distant past” (Pompian, 2006). This bias “refers to the errors people make when the recency effect prejudices their recollections. Recency bias privileges information recently retained and neglects events and observations not as fresh in the mind” (Pompian, 2006).
Affirmation 8: Investment decisions you made in the past and ended up not succeeding alter your future decisions.
Source: Pompian (2012), p. 96.
Tested Bias: Regret Aversion
Regret Aversion is an emotional bias. People with this bias “avoid taking decisive actions because they fear that, in hindsight, whatever course they select will prove less than optimal. Basically, it seeks to forestall the pain of regret associated with poor decision making” (Pompian, 2006). Investors with regret aversion bias tend to “hold on to losing positions too long in order to avoid admitting errors and realizing losses”, according to the same author.
Affirmation 9: Once you make your investment decision, you will rarely change it later.
Source: Pompian (2012), p. 97.
Tested Bias: Conservatism
Conservatism is a cognitive bias linked to “a mental process in which people cling to their prior views or forecasts at the expense of acknowledging new information. (…) it may cause the investor to underreact to t he new information, maintaining impressions derived from the previous estimate rather than acting on the updated information” (Pompian,
2006). Investors with this bias tend to keep attached to previous expectations and are incapable of changing their view when facing a new scenario.
Affirmation 10: When an investment is not performing very well, you seek new information that even though confirms you made the correct decision in the past.
Source: Pompian (2012), p. 99.
Tested Bias: Confirmation
Confirmation is a cognitive bias. It “refers to a type of selective perception that emphasizes ideas that confirm our beliefs, while devaluing whatever contradicts your beliefs. (…) We attach undue emphasis to events that corroborate the outcomes we desire and downplay whatever contrary evidence arises” (Pompian, 2006).
Affirmation 11: You believe that when you make your investment decision on your own, the result will be better than when you follow an advisor or another person’s advice.
Source: Pompian (2012), p. 99.
Tested Bias: Illusion of Control
Illusion of Control is a cognitive bias which “describes the tendency of human beings to believe that they can control or at least influence outcomes when, in fact, cannot. This bias can be observed in Las Vegas, where casinos play host to many forms of this psychological fallacy. (…) Some people, when successful at trying to predict the outcome of a series of coin tosses, actually believe that they are ‘better guessers’, and some claim that distractions might diminish their performance at this statistically arbitrary task” (Pompian, 2006).
Affirmation 12: To you, what matters is a positive result on your investments. You do not care about following a plan.
Source: Pompian (2012), p. 99.
Tested Bias: Outcome
Outcome is a cognitive bias that drives an investor to make decisions considering only recent results no matter how they were obtained. “In monetary gambles, subjects rated the thinking as better when the outcome of the option not chosen turned out poorly than when it turned out well. Although subjects who were asked felt that they should not consider outcomes in making these evaluations, they did so. This effect of outcome knowledge on evaluation may be explained partly in terms of its effect on the salience of arguments for each side of the choice” (BARON and HERSHEY, 1988).
Affirmation 13: Most of the times you buy what you desire at the moment without considering whether you are paying a fair price.
Source: Pompian (2012), p. 95.
(Lack of) Self-Control is an emotional bias present in individuals that spend too much at the present moment at the expense of future savings. These investors have difficult y to meet their long run plans and goals because of their poor discipline in saving enough money for hard times or for retirement, for example.
Affirmation 14: Relative to other investors, co-workers, friends and relatives, how good an investor are you?
Source: Pompian (2006), p. 169.
Tested Bias: Optimism
Optimism is an emotional bias that makes investors consider themselves better than the average. These people believe that bad things happen only to others and not to themselves. “Investors tend to be overly optimist about the markets, the economy, and the potential positive performance of the investments they make. (…) Such oversights can damage portfolios because people fail to mindfully acknowledge the potential for adverse consequences in the investment decisions they make” (Pompian, 2006).
Affirmation 15: You prefer to buy stocks of well-known companies which produce goods that you normally buy.
Source: Pompian (2012), p. 98.
Tested Bias: Affinity
Affinity is an emotional bias present in people who make decisions of consumption or investment based on affinity or positive first impressions without considering the costs involved in that decision or other possibly similar goods or assets at a more convenient price.
Affirmation 16: Most of your investment decisions are made based on past returns of that same investment.
Source: Pompian (2012), p. 98.
Tested Bias: Representativeness
Representativeness is a cognitive bias that makes people come to conclusions based on few representative events. Sometimes people have difficulties in understanding something new and so they try to classify it into something more familiar or to connect it to pre-existent ideas. Pompian (2006), referring to Kahneman, Slovic and Tversky in Judgment
under Uncertainty: Heuristics and Biases, mentions examples of harmful effects of sample-size neglect for investors:
“Investors can make significant financial errors when they examine a money manager’s track record. They peruse the past few quarters or even years and conclude, based on inadequate statistica l data, that the fund’s performance is the result of skilled allocation and/or security selection”.
Affirmation 17: When reflecting about an investment you made in the past which did not succeed, you conclude that it was a mistake that could easily be avoided.
Tested Bias: Hindsight
Hindsight is a cognitive bias. It is “the impulse that insists: ‘I knew it all along!’. Once the event has elapsed, people afflicted with hindsight bias tend to perceive that the event was predictable – even if it wasn’t. (…) people tend to overestimate the accuracy of their own predictions” (Pompian, 2006).
Affirmation 18: You believe that investment recommendations from large financial institutions are more trustful than those from smaller institutions.
Source: Pompian (2012), p. 97.
Tested Bias: Framing
Framing is a cognitive bias that “notes the tendency of decision makers to respond to various situations differently based on the context in which a choice is presented (framed). (…) People subject to framing experience an optical illusion” (Pompian, 2006). Depending on how an alternative is described, it will be chosen or not. The decision is influenced by how a situation is presented and by personal habits and characteristics.
4.3. Metrics for the Survey’s Possible Answers
Using 1-5 Linkert Scale, a metric scale created by the psychologist Rensis Likert and widely used in the social sciences to survey attitudes and individual’s behavior, respondents could choose one between the following possible answers, except for the Affirmation 14:
Possible Answers Bias
Totally Agree Confirmed
Partially Agree Confirmed
Indifferent Not confirmed
Partially Disagree Not confirmed
Totally Disagree Not confirmed
For Affirmation 14, related to the Optimism bias, the possible answers were:
Possible Answers Bias
Much better than average Confirmed
Above average Confirmed
Average Not confirmed
Below average Not confirmed
4.4. Confirmation of the Tested Biases: Answers to the Survey
The table below summarizes IF managers’ answers to the 18 tested biases. Percentages refer to respondents that chose “Totally Agree” or “Partially Agree”, confirming the respective emotional or cognitive bias.
Table 1: Confirmation of the 18 searched biases
Affirmation Number Bias % of Confirmation (*)
14 Optimism 77,55% 8 Regret Aversion 75,51% 11 Illusion of Control 60,20% 10 Confirmation 45,92% 16 Representativeness 36,73% 17 Hindsight 35,71% 7 Recency 33,67% 4 Loss Aversion 28,57% 2 Anchoring 23,47% 12 Outcome 23,47%
13 (Lack of) Self-Control 23,47%
6 Availability 19,39% 9 Conservatism 17,35% 3 Mental Accounting 16,33% 15 Affinity 16,33% 18 Framing 11,22% 5 Status Quo 8,16% 1 Overconfidence 5,10%
(*) "Totally Agree" or "Partially Agree" responses.
Source: by the authors
Analyzing results in terms of the highest confirmed bias, what attracts attention is that some biases were strongly confirmed, like Optimism, Regret Aversion, Illusion of Control and Confirmation. On the other hand, some biases were not confirmed, such as Overconfidence, Status Quo and Framing. When at least 20% of the responses were “Totally Agree” or “Partially Agree”, the item was considered a “confirmed bias”.
4.5. IF Managers’ profile and their Asset’s characteristics
In a methodology similar to Rield and Smeets (2014), which analyzed investor’s choice in American investment funds and related it to their personal profile, 10 initial questions were created with the aim of identifying personal characteristics of IF managers and their Assets which could be related to the their measured emotional and cognitive biases. These questions were the following:
Table 2: Questions and Possible Answers from the Questionnaire
No Question Possible Answers
1 Gender Male Female
2 Age In years
3 Graduation Business
Administration
Economics Engineering Other
4 Post-Graduation MBA in Brazil MBA Abroad Master Degree PhD Other No Post- Graduation 5 Asset Property Independent Part of a Conglomerate or a Bank
6 Asset Origin Brazilian Foreign
7 Asset Location São Paulo Rio de Janeiro Other
8 Assets under your management Up to R$ 20 million From R$ 20 to 100 million From R$ 100 to 500 million More than R$ 500 million 9 Fund Class under
your management
Fixed Income
Equities Multi-Markets Funds Other 10 Percentage of
Equities in your personal investments
Until 20% From 20% to 50% From 50% to 100%
Source: by the authors
Investment Fund managers’ responses to these first 10 questions are summarized in the table below. Table 3: IFM personal and assets characteristics
Source: by the authors
IF manager’s personal characteristics Asset’s characteristics
1 Gender Male 89,8% 5 Asset Property Independent 90,82%
Female 10,2% Part of a Conglomerate or a Bank 9,18%
2 Age Untill 30 years-old 19,4% 6 Asset Origin Brazilian 89,80%
From 30 to 40 years-old 48,0% Foreign 10,20%
Up to 40 years-old 32,7% 7 Asset Location São Paulo 61,22%
3 Graduation Business Administration 41,8% Rio de Janeiro 21,43%
Economics 33,7% Other 17,35%
Engineering 18,4% 8 Until R$ 20 million 7,14%
Other 6,1% From R$ 20 to R$ 100 million 22,45%
4 Post-Graduation(*) MBA in Brazil 29,6% From R$ 100 to 500 million 30,61%
MBA Abroad 12,2% More than R$ 500 million 39,80%
Master Degree 21,4% 9 Fixed Income 27,55%
PhD 1,0% Equities 73,47%
Other 14,3% Multi-Markets Funds 51,02%
No Post-Graduation 29,6% Other 21,43%
10 Until 20% 42,9%
From 20% to 50% 25,5% From 50% to 100% 31,6% (*) Some IF Managers have more than one Post-Graduation.
Percentage of Equities in your personal investments
Assets under your management
Fund Class under your management (**)
(**) 38.8% of the IF managers have more than one fund class under management. In some cases, they have both fixed income, equities and multi-markets funds under their responsibility.
Table 4: Fund categories under management of a single IF Manager: Number of Respondents % of Total Only FIFM 3 3.1% Only EFM 36 36.7% Only MFM 16 16.3%
FIFM and EFM 4 4.1%
FIFM and MFM 2 2.0%
EFM and MFM 14 14.3%
FIFM, EFM and MFM 18 18.4%
Other Fund Category 5 5.1%
Total 98
Source: by the authors
In total, 38.8% of the IF managers have more than one fund class under management , being FIFM: Fixed Income Fund Manager; EFM: Equity Fund Manager; and MFM: Multimarket Fund Manager.
Table 5: IF Managers Categories x Personal Investments, in percentage of 98 respondents
FIFM EFM MFM Number of Respondents 27 72 50 PIN in Equities: Up to 20% 63,0% 36,1% 60,0% PIN in Equities: From 20% to 50% 29,6% 26,4% 20,0% PIN in Equities: From 50% to 100% 7,4% 37,5% 20,0%
Source: by the authors
It is interesting to notice that 63% of the respondents’ personal investments are up to 20% in equities (80% in fixed income and/or low risk investments) while 67.4% of them are Equity and/or Multi-Market Fund Managers – which usually take higher risks than Fixed Income Managers.
4.5.1. Personal IF Managers and Assets Characteristics and the investigated Behavioral Investing Biases
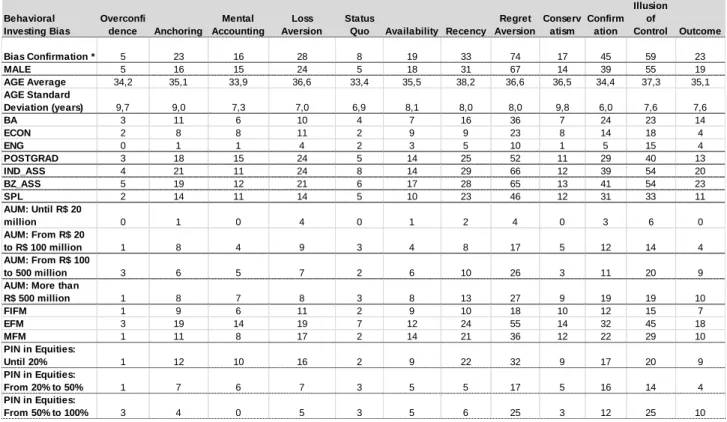
The table below reports the main data obtained through the survey, in number of respondents, crossing biases with respondent’s personal and assets characteristics .
Table 6: Main results on the Questionnaire
Where BA: Business Administration bachelor; ECON: bachelor in Economics; ENG: bachelor in Engineering; POST GRAD: if the respondent has some post -graduation (MBA, PhD or similar); IND_ASS: Independent Asset; BZ_ASS: Brazilian Asset; SPL: São Paulo Located ( if so); AUM: Assets Under Management; FIFM: Fixed Income Fund Manager; EFM: Equity Fund Manager; and MFM: Multimarket Fund Manager; PIN: Personal Investments.
Source: by the authors.
The most relevant observed characteristics can be summarized as follows. In terms of personal profile, respondents are predominantly male, on average 36 years old with a standard deviation of 8 years, bachelors in business administration or economics , with a Master’s Degree in Brazil or abroad. Their personal investments are mo re conservative (up to 20% in equities) despite of the majority of them being Equities or Multi-Markets Fund Managers having more than R$ 100 million under their management. Their Assets are in general Independent, Brazilian, and located in São Paulo.
5. Linking Behavioral Finance and the Performance of Investment Funds 5.1. Applied Literature Review
Tuckett and Taffler published in 2012 a study about Investment Fund Managers and its role from an emotional perspective. They interviewed 52 IF mangers, with more than 10-year experience, running in special global equity funds, located in London, Edinburg, Boston, New York, Paris or Asia, with US$ 503 billion of assets under management in total.
In this study, they measured the number of funds that outperformed their benchmarks (i) three year before interview, (ii) 12 months before interview and (iii) 12 months after interview. In a 45 investment funds sample, in average 30 of them outperformed theirs benchmarks. Interesting to comment that 76% of the respondents were “active equity managers using fundamental analysis for stock selection”.
Behavioral Investing Bias Overconfi dence Anchoring Mental Accounting Loss Aversion Status
Quo Availability Recency Regret Aversion Conserv atism Confirm ation Illusion of Control Outcome Bias Confirmation * 5 23 16 28 8 19 33 74 17 45 59 23 MALE 5 16 15 24 5 18 31 67 14 39 55 19 AGE Average 34,2 35,1 33,9 36,6 33,4 35,5 38,2 36,6 36,5 34,4 37,3 35,1 AGE Standard Deviation (years) 9,7 9,0 7,3 7,0 6,9 8,1 8,0 8,0 9,8 6,0 7,6 7,6 BA 3 11 6 10 4 7 16 36 7 24 23 14 ECON 2 8 8 11 2 9 9 23 8 14 18 4 ENG 0 1 1 4 2 3 5 10 1 5 15 4 POSTGRAD 3 18 15 24 5 14 25 52 11 29 40 13 IND_ASS 4 21 11 24 8 14 29 66 12 39 54 20 BZ_ASS 5 19 12 21 6 17 28 65 13 41 54 23 SPL 2 14 11 14 5 10 23 46 12 31 33 11 AUM: Until R$ 20 million 0 1 0 4 0 1 2 4 0 3 6 0 AUM: From R$ 20 to R$ 100 million 1 8 4 9 3 4 8 17 5 12 14 4 AUM: From R$ 100 to 500 million 3 6 5 7 2 6 10 26 3 11 20 9
AUM: More than
R$ 500 million 1 8 7 8 3 8 13 27 9 19 19 10 FIFM 1 9 6 11 2 9 10 18 10 12 15 7 EFM 3 19 14 19 7 12 24 55 14 32 45 18 MFM 1 11 8 17 2 14 21 36 12 22 29 10 PIN in Equities: Until 20% 1 12 10 16 2 9 22 32 9 17 20 9 PIN in Equities: From 20% to 50% 1 7 6 7 3 5 5 17 5 16 14 4 PIN in Equities: From 50% to 100% 3 4 0 5 3 5 6 25 3 12 25 10
These authors did not categorized the interviewees in terms of emotional or cognitive biases. They report ed the emotional aspects of the IF manager role and the pressure for results involved in day-by-day activities.
Wright, Banerjee and Boney (2008) analyzed 16 US mutual funds that are self-proclaimed or media-identified disciples of behavioral finance to determine whether 1) they successfully attract investment dollars and 2) their strategies earn abnormal returns for their investors , using four factors in the Carhart [1997] model. They structured the model to identify the loadings of the behavioral mutual funds separately from those of their counterparts.
Wright, Banerjee and Boney (2008) conclude that: “1) behavioral mutual funds are successful at attracting investment dollars relative to S&P 500 funds and AMMFs [actively managed mutual f/unds], 2) behavioral funds generally outperform S&P 500 funds and, to a lesser degree, outperform AMMFs on a non-risk-adjusted basis, 3) behavioral mutual funds have been unable to garner any positive abnormal returns outside of the four factors of the Carhart [1997] model, and 4) their ability to beat the S&P 500 funds seems to be a function of their relatively high loading on the HML factor of the Fama and French [1993] model during a period of time when the realization to the HML factor was relatively high. ”
So they conclude that “behavioral mutual funds are virtually indistinguishable from a value investing strategy in the sense that the lion’s share of their success relative to the S&P 500 is explained by their loading on the value factor (HML) from Fama and French’s [1993] model. Publicizing and presumably using “behavioral finance” in a fund’s investment strategy does seem to offer a significant advantage, however, in terms of attracting capital. Viewed together, these findings suggest that the practical application of behavioral finance may be best asserted as a marketing tool rather than as a means of generating abnormal returns. Stated another way, behavioral finance seems to be receiving a warm embrace and positive acceptance in the practitioner world, but our findings suggest that behavioral funds do not generate abnormal returns over the Carhart [1997] model (although a few of them beat the Vanguard 500).”
Santoni and Kelshiker (2010) paper “analyzes 31 mutual funds whose portfolio construction methodologies employ aspects of behavioral finance. The assets of the mutual funds in the study were valued at approximately US$ 16 billion as of August 2009. Major findings of the authors include the following. First, evidence exists of a strong seasonality effect among behavioral funds. Second, behavioral fund managers exh ibit an inability to predict equity market reversals due, in large part, to their willingness to attempt to benefit from trend momentum. Third, they have superior performance during bull market periods vis -à-vis bear market periods, notably with small-cap behavioral funds generally outperforming their large-cap peers. When examining the outperformance of behavioral funds against a respective benchmark, there is no conclusive evidence to suggest that these strategies outperform. The most common observations that behavioral funds attempt to exploit include the momentum effect, winner–loser effect, post-earnings-announcement drift, and prospect theory. Insider buying was also observed as a key signal used by behavioral fund managers to anticipate future market trends”.
Goodfellow, Schiereck and Wippler (2013) examined the performance of 59 behavioral finance funds for the 21-year period 1990-2010 in both U.S. and global markets. They found that: (1) the performance of behavioral finance funds is disappointing, implying that markets are highly efficient; (2) adjusted for risk, there was no evidence of outperformance; (3) on a raw-returns basis, U.S. behavioral funds outperformed during bull markets but underperformed in bear markets (in special in the 2007-2009 period); (4) while behavioral funds do not outperform passive benchmarks, they do outperform active funds in general. This finding is consistent with prior research of Wright, Banerjee and Boney (2008). (Swedroe, 2013)
In Brazil, we have only a few self-proclaimed Behavioral Investing Funds (ex.: Mint Capital) neither there is an Anbima category for this kind of investment funds. Therefore, it is not possible to reply those American studies as is. However, it is possible to follow traditional measures like as Excess Return and Sharpe Index (1963) to analyze investment fund’s performance, aiming to link performance to personal and Asset’s characteristics and/or IFM’s biases.
5.2. Performance in the Brazilian Surveyed Assets
Regarding to this survey, respondent’s identification was optional. However, most of the respondents identified themselves with their name and/or Asset name. Analyzing its identification and comparing it to Anbima’s IF registration, we found 154 different opened investment funds , being 196 in all. There was other 42 closed investment funds , which are not opened to receive new investors. For this performance analysis purpose, only the opened funds were taken in count, where market-to-market and taxation is equal for all funds, and dead funds were eliminated.
In addition, in some cases, the respondent was not the official Investment Fund Manager, considering the investment fund manager register at Anbima. These cases were excluded from the sample, since the purpose was not only to measure performance but also link it with the respondent’s performance. Consequently disregarding these inconsistences and counting only on matches , it end up with 63 “valid” investment funds for this analysis, aiming to link emotional and cognitive biases with performance.
Regarding to these 63 valid investment funds, some statistics: they are in 26 different Assets; managed by 26 different IFM; and allocated as follows in 3 different categories, in line with its managers:
Grafic 1: Investment fund type of the 63 valid funds
13% 29% 59%
Investment Fund Type
Interesting to note that 33 of 37 Equity Funds are active investment funds, equivalent to 50% of the sample, alinging with Tuckett and Taffler (2012) interviewed sample.
In terms of investment fund’s benchmark, for performance calculation purpose, it was settle the following for each category and type of fund:
Table 7: Valid Funds for analyzing performance crossed with biases
Invetment Fund Type Type Benchmark % Quant.
Fixed Income Fund FIF 92% CDI 12.7% 8
Multi-Markets Fund MMF 100% CDI 28.6% 18
Equity Fund EQF Ibovespa 58.7% 37
No. of Valid Funds 63
Source: elaborated by the authors.
It is shown in the Table 7 above that the benchmark of Fixed Income Funds (FIF) is 92% of the CDI (Certificado de Depósito Interbancário, the Brazilian 1-day interbank rate). It is adopted 92% instead of 100% for the Excess Return calculations following the methodology of Guia Exame de Fundos de Investimento.
Based on Tuckett and Taffler (2012), it was calculated the number of funds that outperformed their benchmarks from three year before to 12 months after the questionnaire was answered. So data ranges from March 04, 2011 to March 06, 2015 (252 business days after), since the questionnaire was opened to collect responses from March 10 to 21, 2014.
Some of the 63 valid funds started less then 3 years before the questionnaire, as show in the Table 8 below:
Table 8: Number of funds opened from 3 years before to 1 year after the questionnaire
Date No. Funds
3 years before questionnaire 03/04/2011 - 03/07/2014 33 2 years before questionnaire 03/07/2012 - 03/07/2014 40
12 months before questionnaire 03/07/2013 - 03/07/2014 55 12 months after questionnaire 03/10/2014 - 03/06/2015 63
Total Valid Funds 63
Source: elaborated by the authors.
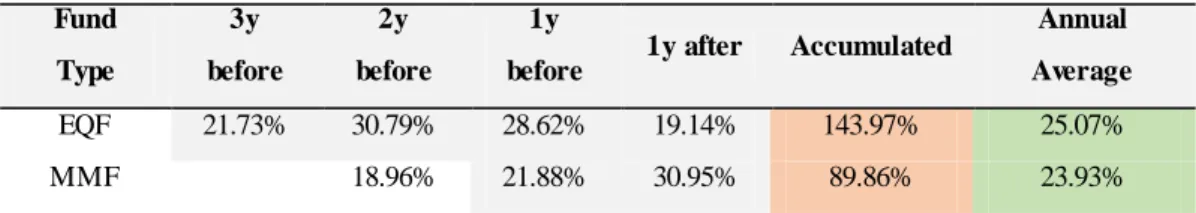
Performance of the valid funds was analyzed similarly to Tuckett and Taffler (2012), in terms of excess return of the Investment Funds benchmarks, and ranked in top 10 best and worst performance, considering its Annual Average excess return. Results of the funds along the years are shown in the tables bellow.
Table 9: Top 10 best performance in terms of Excess Return of the IF benchmarks Fund Type 3y before 2y before 1y
before 1y after Accumulated
Annual Average
EQF 21.73% 30.79% 28.62% 19.14% 143.97% 25.07%
EQF 40.89% 20.32% 2.66% 74.03% 21.29% MMF 39.72% 0.13% 20.82% 69.03% 20.22% EQF 26.19% 36.00% 10.73% -5.13% 80.27% 16.95% EQF 26.24% 35.95% 10.65% -5.27% 79.90% 16.89% EQF 22.11% 10.75% 35.25% 16.43% EQF 23.62% 31.17% 8.27% -5.13% 66.56% 14.48% EQF 20.27% 25.37% 12.15% -3.02% 63.99% 13.69% EQF 19.13% 18.10% 11.23% -0.16% 56.26% 12.08%
Source: elaborated by the authors.
In the table above it can be seen some funds that widely outperformed its benchmarks and some for more than 2 ou 3 years along the observed period. Eight of ten are equity funds and all of them are active equity funds.
Table 10: Top 10 worst performance in terms of Excess Return of the IF benchmarks Fund Type 3y before 2y before 1y
before 1y after Accumulated
Annual Average EQF 1.05% -39.20% -38.56% -19.07% EQF -12.00% -12.00% -12.00% EQF 11.11% -23.14% -14.60% -6.01% FIF -15.13% -0.17% -2.97% -5.55% -22.35% -5.95% MMF -7.68% -3.70% -11.09% -5.69% EQF -3.56% -0.37% -4.22% -14.14% -20.98% -5.57% EQF -5.39% -5.39% -5.39% EQF -6.24% -0.53% -7.28% -13.53% -4.68% EQF -4.42% -4.42% -4.42% MMF -4.39% -4.39% -4.39%
Source: elaborated by the authors.
Equity funds are also seven in the ten top worst performance in terms of excess return along the years observed. Six of these funds are also active equity funds.
Therefore, one could ask what makes an active IF manager outperform its benchmark or, in the opposite, perform so poorly. A possible answer can be its cognitive and emotional biases, in addition to its personal characteristics, educational background or abilities in terms of stock selection and factor timing (CREMERS and PETAJISTO, 2009).
5.3. Performance and Investment Fund Managers Biases in the Brazilian Surveyed Assets
Analyzing the top 10 best and worst performance in terms of excess return and linking the IF managers of these funds with their cognitive and emotional biases and other personal characteristics, the main findings are:
6) Recency is a cognitive bias, which is present in 8 of 10 of the IFM with the worst performances. But is present in only one of 10 of the IFM with the top best performances.
7) Representativeness is a cognitive biases which is present in only 20% of the IFM with the top best performance, while is present in 60% of the IFM with the worst performances.
8) The top performance IFM in terms of excess return has only two biases: Optimism and Illusion of Control. 9) The second best performance IFM has seven biases but does not have Recency among them.
10) IF Managers that outperformed its benchmarks in the analyzed period tend to have less biases, ranging from 1 to 8 biases (average 4.8) among the 18 searched biases. Similarly, IFM that performed poorly (10 worst) answered the questionnaire confirming 4 to 11 biases (average 6.6).
11) The four top confirmed biases (Optimism, Regret Aversion, Illusion of Control and Confirmation) are widely present in the IFM with the both top best and worst performance s.
12) IFM education and gender do not present significant differences between top best and worst performance. 13) Asset location as well as Asset independent or part of a conglomerate also do not present significant
differences between top best and worst performance.
14) Top best performance IFM are younger (34 years old average) than the 10 worst performance IFM (40 years old average).
15) Type of the fund (FIF, MMF or EQF) is not relevant for performance. Most of the top best and worst IFM have more than one type of fund under management.
6. Conclusion
This paper had the purpose of analyzing 18 Behavioral Investing Biases of the Investment Fund Managers in Brazil based on 98 answers to a 28-question survey. Eleven of the eighteen searched biases were considered confirmed as they had more than 20% of positive answers (“Totally Agree” or “Partially Agree”) between respondents . In terms of highest confirmation order: Optimism, Regret Aversion, Illusion of Control, Confirmation, Representativeness, Hindsight, Recency, Loss Aversion, Anchoring, Outcome and (Lack of) Self-Control. Searched but not confirmed biases (less than 20% of positive answers) were, in decreasing confirmation order: Availability, Conservatism, Mental Accounting, Affinity, Framing, Status Quo and Overconfidence – according to the respondent’s answers .
This survey also aimed to map the personal profile of Investment Fund Managers in Brazil and their Assets characteristics. In terms of personal characteristics, 90% of the respondents were male, on average 36 years old (with standard deviation of 8 years), Bachelors in Business Administration or Economics , with MBA in Brazil, Abroad or Master’s Degree. Most of them are Equities or Multi-Markets Investment Fund Managers with more than R$ 100 million under management but their personal investments are mostly in fixed income (up to 20% in equities). The analyzed Assets are 90.8% Independent (not part of a Bank or a Conglomerate), Brazilian, São Paulo located.
Regarding to the relation between performance in terms of excess return, investment biases, personal and assets characteristics, main findings are presented in Section 5. It calls attention that the 10 top performance funds among 63
valid funds are managed by IFM with: 34 years old average, younger than the 10 worst performance IFM; a few investment biases (1-8 in 18 searched biases); and only 10% of Recency bias and 20% of Representativeness bias. These biases were massively present in the top 10 worst performance funds.
For further studies, it may be interesting try to obtain more answers from IFM managers working at conglomerates (and not at independent assets), to check out the results obtained in these sample. In addition, other metrics like Sharpe Index (1963) can also be applied to measure performance and link it to the investing biases.
References
BARON, J. and HERSHEY, J. “Outcome Bias in Decision Evaluation”. Journal of Personality and Social Psychology, Vol. 54, no. 4,569-579, 1988: 569-579.
BELSKY, G. and GILOVICH, T. “Why Smart People Make Big Mistakes – and How To Correct Them. Lessons from the new science of Behavioral Finance.” New York: Simon & Schuster, 1999.
Cremers, K. J. M. and Petajisto, A. “How Active Is Your Fund Manager? A New Measure That Predicts Performance.” Review of Financial Studies, September 2009.
GOODFELLOW, C., SCHIERECK, D. and WIPPLER, S. "Are Behavioral Finance Equity Funds a Superior Investment? A Note on Fund Performance and Market Efficiency". Journal of Asset Management, April 2013.
HALFELD, M. and TORRES, F. F. L. “Finanças Comportamentais: aplicações no contexto brasileiro.” São Paulo: RAE
– Revista de Administração de Empresas, v. 41, no. 2, 2001: 64-71.
KAHNEMAN, D. and RIEPE, M. W. “Aspects of Investors Psychology. Beliefs, preferences, and biases investment advisors should know about.” The Journal of Portfolio Management, 1998: 52 -65.
KAHNEMAN, D., and TVERSKY, A. “Prospect Theory: An Analysis of Decision Under Risk”. Econometrica 47(2), 1979: 263-291.
KUTCHUKIAN, E., EID Jr., W., and DANA, S. “Herding Behavior on mutual fund investors in Brazil”. São Paulo: EAESP – Fundação Getulio Vargas, 2010, in
http://www.cass.city.ac.uk/__data/assets/pdf_file/0020/56900/4A_Dana.pdf
POMPIAN, M. “Behavioral Finance and Investor Types: Managing Behavior to M ake Better Investment Decisions.” New Jersey: John Wiley & Sons, Inc., 2012.
POMPIAN, M. “Behavioral Finance and Wealth Management. How to build optimal portfolios that accounts for investors biases.” New Jersey: John Wiley & Sons, Inc., 2006.
POMPIAN, M. and LONGO. “The Future of Wealth Management: Incorporating Behavioral Finance into Your Practice.” 2005, in http://www.dartmouth.edu/
~lusardiworkshop/Papers/FPA%20BEHAVIORA L%20BIAS%20PA PER.pdf
RIEDL, A. and SMEETS, P. “Social Preferences and Portfolio Choice.” Center for Economics Studies & Ifo Institute. Working Paper no 4403, 2014.
SAMUELSON, W. and ZECKHAUSER, R. J. “Status Quo Bias in Decision Making”. Journal of Risk and Uncertainty, no 1, 1988: 7-59.
SANTONI, A. and KELSHIKER, A. “Behavioral Finance: An Analysis of the Performance of Behavioral Finance Funds”. The Journal of Index Investing, Fall 2010. Vol. 1, No. 2: p. 56-72
SHARPE, W. F. “A simplified model for portfolio analysis”. Management science, 1963, 9(2), 277-293.
SWEDROE, L. “Are Behavioral Funds Superior?” Moneywatch, July 25, 2013, in http://www.cbsnews.com/news/are- behavioral-funds-superior/ (on August 24, 2014)
THALER, R. “Mental Accounting Matters”. Journal of Behavioral Decision Making, no 12, 1999: 183-206.
TUCKETT, D. and TAFFLER, R. “Fund Management: An Emotional Finance Perspective”. CA, US: The Research Foundation of CFA Institute, 2012.
TREYNOR, J. How to Rate Management of Investment Funds . Harvard Business Review, p.63-75, January 1965. WRIGHT, C., BANERJEE, P. ansd BONEY, V. “Behavioral Finance: Are the Disciples Profiting from the Doctrine?” The Journal of Investing, 2008. Vol. 17, No. 4: p. 82-90. (Also available in http://www.iijournals.com/doi/full/
10.3905/JOI.2008.17.4.082)