http://dx.doi.org/10.1590/0104-07072018003250017
PRESSURE INJURY RISK PREDICTION IN CRITICAL CARE PATIENTS: AN
INTEGRATIVE REVIEW
Guilherme dos Santos Zimmermann1, Mariana Fernandes Cremasco2, Suely Sueko Viski Zanei3, Satomi Mori Takahashi4, Cibelli Rizzo Cohrs5, Iveth Yamaguchi Whitaker6
1 Nurse. Hospital Alemão Osvaldo Cruz. São Paulo, São Paulo, Brazil. E-mail: guizimmer@gmail.com
2 M.Sc. in Sciences. Nurse. Hospital Israelita Albert Einstein. São Paulo, São Paulo, Brazil. E-mail: maricremasco@yahoo.com.br 3 Ph.D. in nursing Professor, Department of Clinical and Surgical Nursing of the Escola Paulista de Enfermagem (EPE), Universidade
Federal de São Paulo (Unifesp). São Paulo, São Paulo, Brazil. E-mail: suelyzanei@unifesp.br
4 M.Sc. in Sciences. Nurse, Department of Clinical and Surgical Nursing EPE/Unifesp. São Paulo, São Paulo, Brazil. E-mail: satomi. mori@uniesp.br
5 M.Sc. in Sciences. Nurse, Department of Clinical and Surgical Nursing EPE/Unifesp. São Paulo, São Paulo, Brazil. E-mail: cibellicohrs@uniesp.br
6 PhD. in nursing. Professor, Graduate Program in Nursing EPE/Unifesp. São Paulo, São Paulo, Brazil. E-mail: iveth.whitaker@ unifesp.br
ABSTRACT
Objective: to identify instruments used to assess pressure injury risk in adult critically ill patients in an intensive care unit and analyze their predictive capacity.
Method: an integrative review was carried out, observing the following criteria for study selection: pressure injury risk assessment in patients hospitalized in adult intensive care units by means of a scale or index; predictive capacity measurement of the instrument used; English, Portuguese, or Spanish languages; period between 1962 and 2016. The descriptors used were: pressure ulcer or pressure sores and risk assessment. The variables of interest were: sensitivity; specificity; positive predictive value; negative predictive value; and area under the receiver operating characteristic curve.
Results: a total of 1,032 publications were identified, of which 13 studies were selected for analysis. Pressure injury risk prediction was
only measured with generic scales in seven of the 13 studies. In the comparative studies of intensive care unit specific scales with generic scales, the negative predictive value was high and they all presented an area of receiver operating characteristic curve with values higher than 0.700. There was a prevalence of the Braden scale among generic scales. Six scales that presented good predictive capacity to assess pressure injury risk in intensive care patients were identified.
Conclusion:the present review showed a range of predictive, generic, and specific scales used for pressure injury risk assessment in
intensive care unit patients.
DESCRIPTORS: Pressure ulcer. Risk assessment. Predictive value. Nursing care. Intensive care units.
PREDIÇÃO DE RISCO DE LESÃO POR PRESSÃO EM PACIENTES DE
UNIDADE DE TERAPIA INTENSIVA: REVISÃO INTEGRATIVA
RESUMO
Objetivo: identificar os instrumentos que são utilizados para avaliar o risco de lesão por pressão em pacientes críticos adultos de unidade
de terapia intensiva e analisar a capacidade preditiva dos mesmos.
Método: revisão integrativa observando-se os critérios para seleção dos estudos: avaliação do risco de lesão por pressão em pacientes internados em unidade de terapia intensiva de adultos por meio de escala ou índice; mensuração da capacidade preditiva do instrumento aplicado; idiomas inglês, português ou espanhol; período entre 1962 e 2016. Os descritores utilizados foram: pressure ulcer ou pressure sores e risk assessment. As variáveis de interesse foram: sensibilidade, especificidade, valor preditivo positivo, valor preditivo negativo e área sob a curva receiver operator characteristic.
Resultados: foram identificadas 1032 publicações e deste total foram selecionados 13 estudos para análise. A predição do risco para lesão por pressão foi mensurada unicamente com escalas genéricas em sete dos 13 estudos. Nos estudos comparativos de escalas específicas de unidade de terapia intensiva com escalas genéricas, o valor preditivo negativo foi elevado e todos com área da curva receiver operator characteristic com valores acima de 0,700. Entre as escalas genéricas predominou a escala de Braden. Foram identificadas seis escalas que apresentaram boa capacidade preditiva para avaliar risco de lesão por pressão em pacientes de unidade de terapia intensiva.
Conclusão: esta revisão revelou uma variedade de escalas preditivas, genéricas e específicas, que são utilizadas para avaliação de risco de lesão por pressão no paciente de unidade de terapia intensiva.
PREDICCIÓN DE RIESGO DE LESIÓN POR PRESIÓN EN PACIENTES DE
UNIDAD DE TERAPIA INTENSIVA: REVISIÓN INTEGRATIVA
RESUMEN
Objetivo: identificar los instrumentos que se utilizan para evaluar el riesgo de lesión por presión en pacientes críticos adultos de unidad
de terapia intensiva y analizar la capacidad predictiva de los mismos.
Método: revisión integrativa observándose los criterios para la selección de los estudios: evaluación del riesgo de lesión por presión en
pacientes internados en unidad de terapia intensiva de adultos por medio de escala o índice; medición de la capacidad predictiva del instrumento aplicado; idiomas Inglés, portugués o español; período entre 1962 y 2016. Los descriptores utilizados fueron: pressure ulcer o pressure sores y risk assessment. Las variables de interés fueron: sensibilidad, especificidad, valor predictivo positivo, valor predictivo negativo y área bajo la curva receptor operador.
Resultados: se identificaron 1032 publicaciones y de este total se seleccionaron 13 estudios para análisis. La predicción del riesgo para la
lesión por presión se midió únicamente con escalas genéricas en siete de los 13 estudios. En los estudios comparativos de escalas específicas de unidad de terapia intensiva con escalas genéricas, el valor predictivo negativo fue elevado y todos con área de la curva receptor operator con valores por encima de 0,700. Entre las escalas genéricas predominó la escala de Braden. Se identificaron seis escalas que presentaron buena capacidad predictiva para evaluar riesgo de lesión por presión en pacientes de unidad de terapia intensiva.
Conclusión: esta revisión reveló una variedad de escalas predictivas, genéricas y específicas, que se utilizan para evaluar el riesgo de lesión
por presión en el paciente de unidad de terapia intensiva.
DESCRIPTORES: Úlcera por presión. Evaluación de riesgo. Valor predictivo. Cuidados de enfermería. Unidades de terapia intensiva.
INTRODUCTION
Patients’ vulnerability to pressure injury (PI), especially with difficulty in bed mobilization, put their safety at risk during hospitalizations. Considered as an adverse event because it may be prevented, the incidence of PI in health institutions is an indicator of care quality and reflects directly on nursing and multidisciplinary quality of care.1
Pressure injuries bring negative consequences for both patients and healthcare services, because of pain and psychological distress to patients and their families, in addition to increasing risk of infection, hospital stay, mortality rates, and hospital costs.2-3
According to the National Pressure Ulcer Advisory Panel,4 the expenditure on the treatment of each PI may range from 2,000 to 30,000 dollars, and the annual cost is about 8.5 billion dollars. In the United States, the PI incidence in hospitalized pa-tients ranges from 2% to 40%,4 and an analysis with 42,817 hospitalized patients showed a prevalence of 21.5% patients in intensive care units (ICUs).5
The following factors related to the clinical condition of critically ill patients may contribute to PI development: bed immobility, hemodynamic instability, use of sedation and mechanical venti-lation, and long hospital stay.6-10 Bed immobility results from both patients’ clinical condition and therapeutic treatment, such as the use of sedatives and analgesics, thus reducing sensorial perception. In case of hemodynamic instability, the use of vaso-active drugs and reduction in tissue perfusion will favor PI development.
Results of Brazilian studies also show a high PI incidence in Brazilian ICUs.11-13 Analysis of PI
risk factors in 160 patients hospitalized in the ICU of a teaching hospital in the city of São Paulo showed a PI incidence of 34.4%.11 Another Brazil-ian study, also carried out in the ICU of a teaching hospital, showed a PI incidence of 41.02%.12 The analysis on PI in ICU patients by means of the Braden scale and photographic assessment showed a PI incidence of 59.5%.13
Pressure injury incidence in healthcare insti-tutions is a major problem, and its reduction is of utmost importance. The effective way to face this harm is preventing its occurrence. For this purpose, PI risk prediction scales, associated with nurses’ clinical judgment, have been effective in up to 50% to prevent the occurrence of this type of lesion. Ac-cording to studies, PI risk prediction based only on clinical judgment is not fully effective.14-16 Therefore, PI predictive scales are tools that help nurses in patients’ assessment and must be associated with clinical judgment and definition of care goals aim -ing at prevention.
The most known and used PI risk assessment scales are: Norton; Gosnell; Waterlow; and Braden.7-8 Braden scale is the most used in adults and the most studied in Brazil.8
as Sunderland, EVARUCI, Norton, Mod. Bienstein, and Cubbin-Jackson.16-17
The assessment of PI risk factors in critically ill patients is a challenge, due to the complexity of their clinical status and therapeutic treatment used. Risk assessment scales must have high specificity, sensitiv -ity, and predictive capac-ity, and be of fast analysis and easy applicability in clinical practice, in order to fa-cilitate the establishment of professionals’ procedures.
Pressure injury risk prediction with the help of assessment instruments is a well-elucidated issue in the care context of non-critically ill patients. Studies with generic scales have been carried out, and the Braden scale has presented good risk prediction. Re-garding critically ill patients, further studies on the use of PI risk prediction scales must be conducted, considering specificities of these patients’ profile.16-18
The use of an appropriate scale in the inten-sive care environment may bring benefits with the reduction in PI incidence. With the identification of patients with high risk for PI, preventive interven-tions such as change of decubitus every two hours, protection of bony prominences, reduction of skin exposure to humidity, especially incontinence, reduction of friction and shear, use of skin protec-tors, and nutritional support optimization may be early undertaken.12
In the face of the complexity of PI risk as-sessment, the following questions emerged: which scales have been used to assess PI risk in ICU criti-cally ill patients? What is the predictive capacity of these scales? The following objectives were pro-posed to respond to these questions: To identify PI risk assessment instruments in adult ICU critically ill patients and analyze their predictive capacity.
METHOD
This integrative review consisted of the syn-thesis of findings of studies that evaluated PI risk in adult ICU patients, with the use of a scale or index to evidence the predictive capacity of the instruments used in this context.19-20
The criteria for study selection were: assess-ment of PI risk in patients hospitalized in adult ICUs by means of a scale or index; predictive capac-ity measurement of the instrument used; English, Portuguese, or Spanish languages; and studies published between 1962 and 2016. The year of 1962 was chosen due to the creation of the Norton scale, which served as parameter for the development of other scales and beginning of studies on PI risk prediction scales.
The descriptors used for study search were: pressure ulcer or pressure sores and risk assessment. Study search was carried out in March 2016 and up-dated in December of the same year in the following databases: MEDLINE (Medical Literature Analysis and Retrieval System Online); COCHRANE (Co -chrane Library); BDENF (Nursing Database); LI -LACS (Latin American and Caribbean Literature on Health Sciences); and CINAHL (Cumulative Index to Nursing and Allied Health Literature).
Search in the databases was carried out using the descriptors, followed by search refinement crite -ria, whatever the year of publication and language. Then, the titles and abstracts of all studies identified were read. When information from abstracts did not enable the decision on study inclusion, full reading of articles was carried out independently by two researchers, with subsequent information cross-checking. Studies that met the selection criteria were recovered in their entirety for analysis.
With the purpose of analyzing scales’ predic-tive capacity to evaluate PI risk in ICU patients, the variables of interest were: sensitivity; specificity; positive predictive value (PPV); negative predictive value (NPV); and area under the receiver operating characteristic (ROC) curve. Sensitivity is related to the scales’ capacity to correctly identify patients with potential risk to develop PI; in contrast, specificity is related to the instruments’ capacity to identify patients who will not develop PI. A highly sensitive test will rarely not be able to categorize individuals who will develop PI. However, in a quite specific instrument, individuals will hardly be categorized as patients at risk if they are not. The analysis of PPV and NPV seeks to identify the prob-ability of patients who will really develop PI or not, that is, the PPV is related to the capacity to identify patients categorized as at risk and who really had PI, and the NVP is related to patients categorized as without risk and who did not develop PI.21-23
One way of expressing the relationship be -tween sensitivity and specificity is the establishment of the ROC curve area, a graphical representation of these values that may range from 0 to 1 (0 to 100%). The counterbalance of these variables may establish the scale’s best cut-off point and, con-sequently, the best accuracy values. To present a satisfactory performance, a scale must present an area of ROC>0.7.21,23
study objective; assessment scale used; data col-lection period; PI incidence; sensitivity; specificity; PPV; NPV; area under ROC curve; and conclusions.
RESULTS
The study selection process in the databases resulted in the identification of 1,032 publications, being 585 from MEDLINE, 266 from CINAHL, 51 from LILACS, 23 from BDENF, and 107 from COCHRANE. Of this total, 789 were excluded be -cause they did not present analysis of risk predic-tion as defined in the present review, 51 because they were studies with analyses of predictive
values without specific results from ICU patients, 70 because they were editorials, case reports, and experts’ opinions, 68 because they were reviews, 37 because they were studies carried out with children, and four because they were included in more than one database. Therefore, 13 studies were selected for analysis.
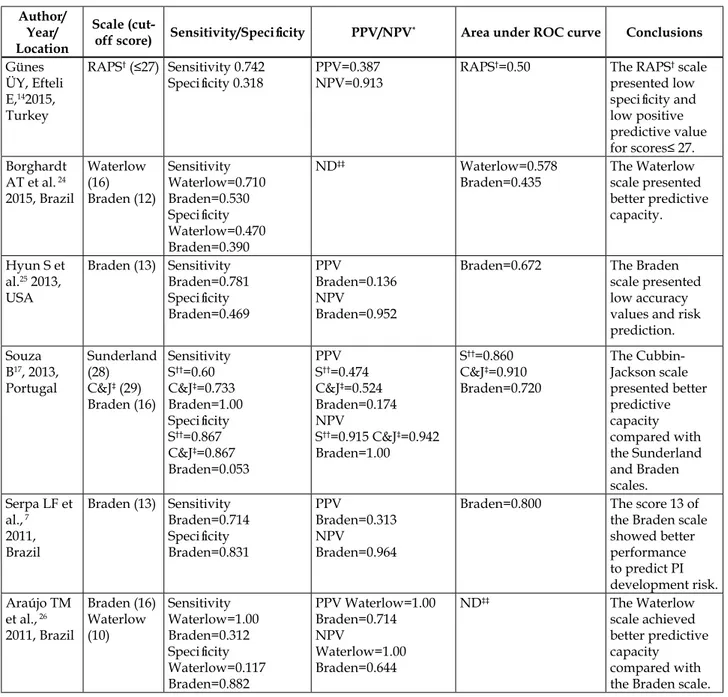
Of the 13 studies selected, four were carried out in Brazil, two in South Korea, one in Portugal, one in the United States, one in Spain, one in In-donesia, one in Germany, one in Japan, and one in Turkey. Among these studies, seven were published in Brazilian journals. Table 1 presents the studies and variables considered in the present review.
Table 1 – Results from the studies selected. São Paulo, São Paulo, Brazil, 2017
Author/ Year/ Location
Scale
(cut-off score) Sensitivity/Specificity PPV/NPV* Area under ROC curve Conclusions
Günes ÜY, Efteli E,142015, Turkey
RAPS† (≤27) Sensitivity 0.742
Specificity 0.318 PPV=0.387NPV=0.913
RAPS†=0.50 The RAPS† scale presented low
specificity and
low positive predictive value
for scores≤ 27.
Borghardt AT et al. 24 2015, Brazil
Waterlow (16) Braden (12)
Sensitivity Waterlow=0.710 Braden=0.530
Specificity
Waterlow=0.470 Braden=0.390
ND‡‡ Waterlow=0.578
Braden=0.435
The Waterlow scale presented better predictive capacity.
Hyun S et
al.25 2013, USA
Braden (13) Sensitivity Braden=0.781
Specificity
Braden=0.469
PPV
Braden=0.136 NPV
Braden=0.952
Braden=0.672 The Braden
scale presented low accuracy values and risk prediction.
Souza B17, 2013, Portugal
Sunderland (28)
C&J‡ (29) Braden (16)
Sensitivity S††=0.60 C&J‡=0.733 Braden=1.00
Specificity
S††=0.867 C&J‡=0.867 Braden=0.053
PPV S††=0.474 C&J‡=0.524 Braden=0.174 NPV
S††=0.915 C&J‡=0.942 Braden=1.00
S††=0.860 C&J‡=0.910 Braden=0.720
The Cubbin-Jackson scale presented better predictive capacity compared with the Sunderland and Braden scales.
Serpa LF et
al., 7 2011, Brazil
Braden (13) Sensitivity Braden=0.714
Specificity
Braden=0.831
PPV
Braden=0.313 NPV
Braden=0.964
Braden=0.800 The score 13 of the Braden scale showed better performance to predict PI development risk.
Araújo TM
et al., 26 2011, Brazil
Braden (16) Waterlow (10)
Sensitivity Waterlow=1.00 Braden=0.312
Specificity
Waterlow=0.117 Braden=0.882
PPV Waterlow=1.00 Braden=0.714 NPV
Waterlow=1.00 Braden=0.644
ND‡‡ The Waterlow
Author/ Year/ Location
Scale
(cut-off score) Sensitivity/Specificity PPV/NPV* Area under ROC curve Conclusions
Costa IG et al.,22 2011, Brazil
Braden (14) Sensitivity Braden=0.950 Specificity Braden=0.450 PPV Braden=0.520 NPV Braden=0.940
ND‡‡ The Braden scale
is an effective instrument to early identify PI risk.
Kim E et al.,18 2009, South Korea
Braden (14) C&J‡ (28) Sond & Choi (21)
Sensitivity Braden=0.925 S&C**=0.950 C&J‡=0.950
Specificity
Braden=0.698 S&C**=0.692 C&J‡=0.815
PPV
Braden=0.406 S&C**=0.408 C&J‡=0.535 NPV
Braden=0.967 S&C**=0.984 C&J‡=0.986
Braden=0.881
S&C**=0.890 C&J‡=0.902
The results showed better predictive capacity of the C&J‡ scale.
González-Ruiz JM et al.,27 2008, Spain EVARUCI (10) Sensitivity EVARUCI=1.00 Specificity EVARUCI=0.686 PPV EVARUCI=0.407 NPV EVARUCI=1.00
EVARUCI=0.938 The EVARUCI
scale proved to be a valid scale for PI risk prediction.
Suriadi et al.,28 2008, Indonesia
Suriadi & Sanada (4)
Sensitivity SS¶=0.810
Specificity
SS¶=0.830
PPV SS¶=0.650 NPV SS¶=0.910
SS¶=0.888 The Suriadi & Sanada scale presented good predictive capacity for PI risk assessment. Feuchtinger
J et al.,29 2007, Germany Norton (25) Braden (20) 4-factor model (2) Sensitivity Braden=0.970 Norton=0.580 4F||=0.850
Specificity
Braden=0.050 Norton=0.470 4F||=0.310
PPV
Braden=0.690 Norton=0.700 4F||=0.700 NPV
Braden=0.500 Norton=0.350 4F||=0.380
ND‡‡ The scales
showed a good predictive value; however, adjustment of the cut-off point according to characteristics of
a specific group
of patients is
required.
Suriadi et al.,30 2006, Japan Braden(12) Multi-pad pressure evaluator (35) Braden + Multi-pad pressure evaluator (13) Sensitivity Braden=0.800 MPPE§=0.710 Braden+MPPE§=0.740
Specificity
Braden=0.540 MPPE§=0.740
Braden+MPPE§=0.730 PPV
Braden=0.470 MPPE§=0.470 Braden+MPPE§=0.580 NPV
Braden=0.840 MPPE§=0.840 Braden+MPPE§=0.850
Braden=0.790 MPPE§=0.810 Braden+MPPE§=0.810
The use of the Multi-pad pressure evaluator scale is suggested for better PI risk assessment samples in ICUs.
Seongsook J et al.,31 2004, South Korea
C&J‡ (16) Braden (16) Douglas (18)
Sensitivity C&J‡=0.890 Douglas=1.00 Braden=0.970
Specificity
C&J‡=0.610 Douglas=0.180 Braden=0.260
PPV C&J‡=0.51 Douglas=0.340 Braden=0.370 NPV
C&J‡=0.95 Douglas=1.00 Braden=0.950
C&J‡=0.826 Douglas=0.791 Braden=0.707
The C&J‡ scale presented better predictive values.
Legend: *Positive predictive value/Negative predictive value; †Pressure injury risk assessment; ‡Cubbin-Jackson; §Multi-pad pressure evaluator; ||4-factor mode; ¶Suriadi & Sanada; **Sond & Choi; ††Sunderland; ‡‡Not available.
Data from Table 1 show that PI risk prediction was only measured with generic scales (Braden,
specific scales (Cubbin-Jackson, Sunderland, EVAR -UCI, Sond & Choi, Suriadi & Sanada, and multi-pad pressure evaluator) was observed in two studies. The use of generic scales together with specific scales was observed in four studies, with the purpose of comparing their predictive capacity.
Despite being generic, the Braden scale was the most used among the sample in the intensive care environment, being observed in ten studies. Among specific scales, the C&J scale was the most often used, totaling three articles.
When only the Braden scale was used for risk prediction in ICU patients, the cut-off score was 13 in two studies and 14 in one study. In these scores, sensitivity ranged from 71.4% to 95% and specific -ity from 45% to 83%. The PPV ranged from 13% to 52% and the NPV from 94% to 96.4%. The area of ROC curve was verified in two studies and, in one of them, the value was lower than 0.700.
The validation of specific scales for PI risk as -sessment in ICU patients was presented in two stud-ies. The results from EVARUCI validation showed sensitivity of 100% and specificity of 68%, PPV of 40%, NPV of 100%, and 0.938 of area of ROC curve. The Suriadi & Sanada scale showed the following results: sensitivity of 81%, specificity of 83%, PPV of 65%, and NPV of 91%. The area of ROC curve showed a value of 0.888.
The results from studies that compared the predictive capacity of specific and generic scales pre -sented significant variation. When Sunderland, C&J, and Braden scales were compared, it was found that the sensitivity of the Braden scale was higher (100%), but the specificity of specific scales was higher (86.7%) than that of generic scales (5%). However, the area of ROC curve of the three scales was higher than 0.700. The PPV of the C&J scale was higher (52.4%) and the NPV in the three scales was higher than 90%.
In the comparison of ICU specific scales with generic scales, the C&J scale was used in three of the four studies identified, and the Braden scale was used in all studies. Sensitivity variation of all scales was high, ranging from 60% to 100%. However, in specificity values, the ICU specific scales showed higher variations (from 61% to 86%), when com-pared with generic scales (from 5% to 69%).
Still in the comparative studies of ICU specific and generic scales, the PPV presented similar values in all specific instruments, ranging from 40% to 58%, and from 17% to 40% in generic scales. The NPV was high in all scales, ranging from 84% to 100%, and with an area of ROC curve with values higher than 0.700.
DISCUSSION
The variety of scales found in the present re-view shows how complex PI risk prediction is in the context of ICU critically ill patients. Different stud-ies carried out in several contexts and with diverse care protocols were found, and no pattern regarding scales’ predictive values was observed. Considering this, the difficulty in identifying an ideal instrument stands out, highlighting the multifactorial aspect involved in the development of pressure injuries.
According to the American National Pressure Ulcer Advisory Panel, a good scale is associated with easy use, good predictive values, high sensitivity, and high specificity. One recent systematic review with meta-analysis identified 57 PI risk prediction scales translated and validated into several lan-guages, which evidences the theme’s complexity.16,32 The Braden scale, which is a generic risk prediction instrument, does not consider some clinical condition aspects of critically ill patients. Even so, it is widely propagated and used in criti-cally ill patients. In the present review, ten of the 13 studies analyzed made use of the Braden scale for ICU risk prediction. In one systematic review with meta-analysis that also had as objective to identify PI risk prediction scales in critically ill patients, the Braden scale also stood out, being used in 46.1% of the studies analyzed.16
Recognizing that the Braden scale presents risk prediction failures, studies tend to compare its use with other scales that include the gaps observed, especially those associated with ICU critically ill patients. In only three of all studies analyzed, the Braden scale was used as the only scale for PI risk prediction analysis. In these studies, only the Braden scale presented high sensitivity (higher than 70%), which means that PI potential risk identification becomes effective in most cases. This finding is important because the Braden scale is the most of-ten used for PI risk prediction in Brazil, a fact that may explain why two of the three studies with its exclusive use was carried out in this country.7,22,25
injuries, that is, once patients are categorized as “without risk”, the possibility of developing PI is significantly low. 7,22,25
Of the studies carried out with ICU specific scales, two were carried out with exclusive use of specific scales (EVARUCI and Suriadi & Sanada). They were validation studies.27-28 In the validation of the EVARUCI scale, its predictive values were high, with an area under the ROC curve of 0.938, which is an excellent value regarding risk prediction in ICUs. Based on these values, the author may conclude that the EVARUCI scale was effective to predict PI risk in ICUs. However, further studies with larger samples and in other intensive care centers must be carried out for this scale’s better consolidation.27
The validation of the Suriadi & Sanada scale carried out in two ICUs in Indonesia showed high sensitivity, specificity, and NPV values, and a good PPV. The area under the ROC curve was 0.888 in a cut-off point of four. Therefore, the author concludes the validation with good values, showing that the Suriadi & Sanada scale is effective for PI risk predic-tion in ICUs. However, the data collecpredic-tion setting may be considered as a study limitation, because the country where the study was carried out presents a singular culture, with patients with different physi-cal characteristics such as weight and height, which may interfere with the results, thus suggesting the use of the scale in others countries.28
The specific scales validated for ICUs pre -sented excellent predictive capacity. However, due to a recent aspect of studies and validation, further studies must be carried out with a larger sample of patients with different clinical conditions, and in different study settings to improve its consolidation and real use as an instrument of choice.
Predictive capacity studies often use a mark-er as “gold standard” for comparative analysis of a test’s effectiveness. In the context of PI risk prediction, the Braden scale is recommended and widely propagated by guidelines, and con-sequently, it is often used as “gold standard” for risk prediction, especially in ICUs. Of the studies with association with more than a scale found in the present review, they all used the Braden scale for their comparison.21
In the comparative studies with generic scales in ICUs, sensitivity values ranged significantly. However, specificity values in the studies showed lower values than those expected. This fact cor-roborates other studies where specificity values of generic scales tend to be lower than those expected. In two systematic reviews, all studies with generic
scales used in ICUs presented low specificity values, ranging from 7% to 60%.16,21 This is justified by the specificity of ICU critically ill patients, who many times do not have their clinical condition considered in some aspects that favor the emergence of pressure injuries, such as alterations in peripheral perfusion, mechanical ventilation, hypotension, vasopressor infusion, hemodynamic instability, immobility, and frequent incontinence.25
Among specific scales, the C&J scale was most often used in ICU patients. This same result was found in one review where 19.2% of the articles used the C&J scale to analyze risk prediction in ICUs. In another systematic review with 72 studies on PI risk prediction in different profiles of pa -tients, the C&J scale was present in approximately 7% of the studies.16
In general, the C&J scale presented good accuracy regarding sensitivity and specificity in ICU critically ill patients. Sensitivity and specific -ity variation found in the present study corrobo-rates data found in one meta-analysis, where the accumulated value of the articles ranged with a sensitivity of 85% and specificity of 73%.16 Another systematic review showed sensitivity variation of the C&J scale, from 83% to 89% and specificity variation from 42% to 61%.33 These data indicate that the C&J scale is an important risk prediction scale, and target of new studies.
Among predictive values of ICU specific scales, when compared with generic scales, they both presented good sensitivity values, that is, all scales have proved effective in the identification of high-risk patients. In addition, they all presented excellent NPV, and their use enabled to correctly predict patients “without risk” who did not develop PIs.17-18,30-31
In contrast, all generic scales presented low sensitivity values when compared with ICU spe-cific scales, as previously mentioned. Therefore, the authors involved in scales’ comparisons and sys-tematic reviews conclude and suggest the use and dissemination of ICU specific scales due to their bet -ter predictive capacity. However, they recognize the need for further studies for their consolidation.30-31
CONCLUSION
The studies selected for the present review show the range of predictive, generic, and specific scales used for PI risk assessment in ICU patients. Among generic scales, the use of the Braden scale stood out. Specific scales identified were the Cubbin-Jackson scale, the Sunderland scale, the EVARUCI scale, the Sond & Choi scale, the Suriadi & Sanada scale, and the Multi-pad pressure evaluator scale. Specific scales for ICU patients presented results that indicate good predictive capacity. However, further studies with large samples of ICU patients must be carried out to analyze risk prediction.
REFERENCES
1. Santos CT, Oliveira MC, Pereira AGS, Suzuki LM,
Lucena AF. Pressure ulcer care quality indicator:
analysis of medical records and incident report. Rev
Gaúcha Enferm [Internet]. 2013 Mar [cited 2016 Nov 09]; 34(1):111-8. Available from: http://www.scielo.
br/pdf/rgenf/v34n1/en_14.pdf
2. Dantas ALM, Ferreira PC, Valença CN, Diniz KD, Nunes JP, Germano RM. Complications of pressure ulcers in severely ill patients: a descriptive-exploratory
study. Online Braz J Nurs [Internet]. 2013 Jun [cited 2016 Nov 09]; 12(2):319-29. Available from: http://
www.objnursing.uff.br/index.php/nursing/article/ view/3794/html
3. Matos LS, Duarte NLV, Minetto RC. Incidência e
prevalência de úlcera por pressão no CTI de um Hospital Público do DF. Rev Eletrônica Enferm
[Internet]. 2010 Dec [cited 2016 Nov 09];
12(4):719-26. Available from: https://www.fen.ufg.br/fen_ revista/v12/n4/v12n4a18.htm
4. Lima ACB, Guerra DM. Evaluation of the cost of treating pressure ulcers in hospitalized patients using industrialized dressings. Ciênc
Saúde Coletiva [Internet]. 2011 Jan [cited 2016 Nov 09]; 16(1):267-77. Available from: http://
w w w . s c i e l o . b r / s c i e l o . p h p ? s c r i p t = s c i _ arttext&pid=S1413-81232011000100029
5. Gomes FSL, Bastos MAR, Matozinhos FP, Temponi
HR, Velásquez-Meléndez G. Factors associated to
pressure ulcers in patients at Adult Intensive Care
Units. Rev Esc Enferm USP [Internet]. 2010 Dec [cited 2016 Nov 09]; 44(4):1070-6. Available from:
http://www.scielo.br/scielo.php?pid=S0080-62342010000400031&script=sci_arttext&tlng=en
6. Cooper KL. Evidence-based prevention of pressure
ulcers in the intensive care unit. Crit Care Nurse
[Internet]. 2013 Dec [cited 2016 Nov 09];
33(6):57-66. Available from: http://ccn.aacnjournals.org/ content/33/6/57.full
7. Serpa LF, Santos VLCG, Campanili TCGF, Queiroz M. Predictive Validity of the Braden Scale for Pressure
Ulcer Risk in Critical Care Patients. Rev Latino-Am Enfermagem [Internet]. 2011 Fev [cited 2016 Nov 09];
19(1):50-7 Available from: http://www.scielo.br/ pdf/rlae/v19n1/pt_08.pdf
8. Gomes FSL, Bastos MAR, Matozinhos FP, Temponi
HR, Velásquez-Meléndez G. Risk assessment for
pressure ulcer in critical patients. Rev Esc Enferm USP
[Internet]. 2011 Apr [cited 2016 Nov 09]; 45(2):313-18
Available from: http://www.scielo.br/pdf/reeusp/ v45n2/v45n2a01.pdf
9. Blanes L, Duarte IS, Calil JA, Ferreira LM.
Avaliação clínica e epidemiológica das úlceras por pressão em pacientes internados no Hospital São Paulo. Rev Assoc Med Bras [Internet]. 2004 Jan [cited 2016 Nov 09]; 50(2):182-7. Available
from: http://www.scielo.br/scielo.php?script=sci_ arttext&pid=S0104-42302004000200036
10. Pender LR, Frazier SK. The relationship between dermal pressure ulcers, oxygenation and perfusion in mechanically ventilated patients. Intensive
Crit Care Nurs [Internet]. 2005 Feb [cited 2016 Nov 09]; 21:29-38. Available from: http://www.
intensivecriticalcarenursing.com/article/S0964-3397(04)00086-2/fulltext
11. Cremasco MF, Wenzel F, Zanei SSV, Whitaker IY. Pressure ulcers in the intensive care unit: the rela-tionship between nursing workload, illness
seve-rity and pressure ulcer risk. J Clin Nurs [Internet]. 2012 Dec [cited 2016 Nov 09]; 22(15-16):2183-91.
Available from: http://onlinelibrary.wiley.com/ doi/10.1111/j.1365-2702.2012.04216.x/abstract;jses-sionid=82857C9E0103A1F96C2D29B7DE3E2805.f04t04
12. Rogenski NMB, Kurcgant P. The incidence of pressure ulcers after the implementation of a prevention
protocol. Rev Latino-Am Enfermagem [Internet]. 2012 Apr [cited 2016 Nov 09]; 20(2):333-9 Available from:
http://www.scielo.br/pdf/rlae/v20n2/16.pdf
13. Araujo TMA, Araujo MFM, Caetano JA. Using the Braden Scale and photographs to assess pressure
ulcer risk. Rev Esc Enferm USP [Internet]. 2012 Aug [cited 2016 Nov 09]; 46(4):858-64. Available
14. Günes ÜY, Efteli E. Predictive Validity and Reliability of the Turkish Version of the Risk Assessment Pressure Sore Scale in Intensive Care Patients: Results
of a Prospective Study. Ostomy Wound Manage [Internet]. 2015 [Cited 2016 Nov 09]; 61(4):58-62.
Available from: https://www.ncbi.nlm.nih.gov/ labs/articles/25853378/
15. Pereira AGS, Santos CT, Menegon DB, Mello BS,
Azambuja F, Lucena AF. Mapping the nursing
care with the NIC for patients in risk for pressure
ulcer. Rev Esc Enferm USP [Internet]. 2014 Jun [cited 2016 Nov 09]; 48(3):454-61. Available from:
http://www.scielo.br/scielo.php?script=sci_ arttext&pid=S0080-62342014000300454
16. García-Fernández FP, Pancorbo-Hidalgo PL, Agreda JJS. Predictive Capacity of Risk Assessment Scales and Clinical Judgment for Pressure Ulcers: a
meta-a-nalysis. J Wound Ostomy Continence Nurs. [Internet] 2014 Feb [Cited 2016 Nov 09]; 41(1):24-34. Available
from: http://journals.lww.com/jwocnonline/pages/ articleviewer.aspx?year=2014&issue=01000&arti-cle=00005&type=abstract
17. Sousa B. Translation, adaptation, and validation of the Sunderland Scale and the Cubbin & Jackson Revised Scale in Portuguese. Rev Bras Ter Intensiva
[Internet]. 2013Jun [Cited 2016 Nov 09]; 25(2):106-14.
Available from: http://www.scielo.br/pdf/rbti/ v25n2/v25n2a08.pdf
18. Kim E, Lee S, Lee E, Eom M. Comparison of the predictive validity among pressure ulcer risk assessment scales for surgical ICU patients. Aust J Adv
Nurs [Internet]. 2009 [cited 2016 Oct 17]; 26(4):87-94.
Available from: http://www.ajan.com.au/Vol26/26-4_Eom.pdf
19. Ganong L. Integrative review of nursing research.
Res Nurs Health [Internet]. 1987[cited 2016 Oct 17];
10(1):1-11. Available from: http://onlinelibrary. wiley.com/doi/10.1002/nur.4770100103/epdf?r3_ referer=wol&tracking_action=preview_click&show_ checkout=1&purchase_referrer=onlinelibrary.
wiley.com&purchase_site_license=PUBLICATION_ OUTSIDE_OF_LICENSE_PERIOD
20. Mendes KDS, Silveira RCCP, Galvão CM. Integrative literature review: a research method to incorporate evidence in health care and nursing. Texto
Contexto Enferm [Internet]. 2008 [cited 2016 Jul 20]; 17(4):758-64. Available from: http://www.
scielo.br/scielo.php?script=sci_arttext&pid=S0104-07072008000400018&lng=pt&nrm=iso&tlng=pt
21. Cox J. Predictive power of the braden scale for pressure sore risk in adult critical care patients: a
comprehensive review. J Wound Ostomy Continence Nurs [Internet]. 2012 [cited 2016 Oct 17]; 39(6):613-21.
Available from: http://www.nursingcenter.com/ cearticle?an=00152192-201211000-00006&Journal_ ID=448075&Issue_ID=1461592
22. Costa IG, Caliri MHL. Predictive validity of the Braden Scale for patients in intensive care. Acta
Paul Enferm [Internet]. 2011[cited 2016 Oct 17];
24(6):772-7. Available from: http://www.scielo. br/scielo.php?script=sci_arttext&pid=S0103-21002011000600007&lng=pt&nrm=iso&tlng=en#nt01
23. Fletcher RH. Epidemiologia clínica: elementos essenciais. 5ª ed. Porto Alegre (RS): Artmed; 2014.
24. Borghardt AT, Prado TN, Araújo TM, Rogenski NMB,
Bringuente MEO. Evaluation of the pressure ulcers
risk scales with critically ill patients: a prospective
cohort study. Rev Latino-Am Enfermagem [Internet]. 2015 Jan/Fev [cited 2016 Oct 17]; 23(1):28-35 Available
from: http://www.scielo.br/pdf/rlae/v23n1/0104-1169-rlae-23-01-00028.pdf
25. Hyun S, Vermillion B, Newton C, Fall M, Li X, Kaewprag P, et al. Predictive Validity of the Braden Scale for Patients in Intensive Care Units. Am J Crit
Care [Internet]. 2013 Nov [cited 2016 Oct 17];
22(6):514-20. Available from: http://ajcc.aacnjournals.org/ content/22/6/514.full.pdf+html
26. Araújo TM, Araújo MFM, Cavalcante CS, Barbosa Junior GM, Caetano JÁ. Acurácia de duas escalas de
avaliação de risco para úlcera por pressão em pacientes críticos. Rev Enferm UERJ [Internet]. 2011 Jul/Set [cited 2016 Out 17]; 19(3):381-5. Available from: http://www.
facenf.uerj.br/v19n3/v19n3a07.pdf
27. González-Ruiz JM, Núñez-Méndez P,
Balugo-Huertasb S, Navarro-de la Peñab L, García-Martína
MR. Validity study of the current risk assessment scale for pressure ulcers in intensive care (EVARUCI).
Enferm Intensiva [Internet]. 2008 Jul [cited 2016 Oct 17]; 19(3):123-31. Available from: http://
www.elsevier.es/en-revista-enfermeria-intensiva- 142-articulo-estudio-validez-escala-valoracion-actual-S1130239908727548
28. Suriadi HS, Sugama J, Thigpen B, Subuh M. Development of a new risk assessment scale for predicting pressure ulcers in an intensive care unit.
Nurs Critical Care [Internet]. 2008, 13(1):34-43.
29. Feuchtinger J, Halfens R, Dassen T. Pressure ulcer risk assessment immediately after cardiac surgery – does it make a difference? A comparison of three pressure ulcer risk assessment instruments within a cardiac
surgery population. Nurs Critical Care [Internet]. 2007;
12(1):42-9. Available from: http://onlinelibrary.wiley. com/doi/10.1111/j.1478-5153.2006.00198.x/epdf
30. Sanada SH, Sugama J, Thigpen B, Kitagawa A, Kinosita S, Murayana S. A new instrument for predicting pressure ulcer risk in an intensive care unit. J Tissue
Viability [Internet]. 2006 [cited 2016 Oct 17];
16(3):21-6. Available from: http://www.sciencedirect.com/
science/article/pii/S0965206X06630064?via%3Dihub
31. Seongsook J, Ihnsook J, Younghee L. Validity of pressure ulcer risk assessment scales;Cubbin and
Jackson, Braden, and Douglas scale. International J
Nurs Studies 2009 [cited 2016 Oct 17]; 41(1):199-204.
Available from: http://www.sciencedirect.com/ science/article/pii/S0020748903001354
32. Defloor T, Grypdonck MFH. Pressure ulcers: validation of two risk assessment scales. J Clinical
Nurs [Internet]. 2005 [cited 2016 Oct 17]; 14:373-82.
Available from: http://onlinelibrary.wiley.com/ doi/10.1111/j.1365-2702.2004.01058.x/epdf
33. Pancorbo-Hidalgo PL, Garcia-Fernandez FP, Lopez-Medina IM, Alvarez-Nieto C. Risk assessment scales for pressure ulcer prevention: a systematic review. J
Advanced Nurs [Internet]. 2006 [cited 2016 Oct 17];
54(1):94-110. Available from: http://onlinelibrary. wiley.com/doi/10.1111/j.1365-2648.2006.03794.x/epdf
Correspondence: Iveth Yamaguchi Whitaker Rua Napoleão de Barros 754
04024-002 - São Paulo, SP, Brasil E-mail: iveth.whitaker@unifesp.br
Recived: May 10, 2017 Approved: December 05, 2017.