Article
, Vol. 29, No. 6, 1291-1303, 2018 Printed in Brazil - ©2018 Sociedade Brasileira de Química*e-mail: gracielaiq@gmail.com
Air Quality Indexes in the City of Rio de Janeiro During the 2016 Olympic and
Paralympic Games
Felipe Tsuruta,a,b Nicole J. de Carvalho,a Cleyton M. da Silvaa,b and Graciela Arbilla*,a
aInstituto de Química, Universidade Federal do Rio de Janeiro, Av. Athos da Silveira Ramos, 149, Bloco A,
Cidade Universitária, Ilha do Fundão, 21949-900 Rio de Janeiro-RJ, Brazil
bUniversidade Veiga de Almeida, Campus de Maracanã, 20271-020 Rio de Janeiro-RJ, Brazil
In this work, the air quality indexes (AQIs) determined in Rio de Janeiro from July to September 2016, before and during the Summer Olympic and Paralympic Games, in the monitoring stations operated by the Municipal Secretariat of the Environment,were compiled and analyzed. Only four automatic monitoring stations determined all the Brazilian criteria pollutants (smog, total particulate matter, PM10 (particulate matter < 10 mm), NO2, ozone and SO2). NO2 and PM10
levels were generally lower during the Olympic period because of restrictions on vehicular flux. However, ozone concentrations remained high, due to unfavorable meteorological conditions. The worst conditions were observed in Bangu and Irajá Districts, where ozone concentrations frequently exceeded 160 mg m-3. According to the World Health Organization (WHO), as ozone
concentrations increase above this value, health effects became increasingly numerous and more severe. Brazilian air quality allowable standards are clearly higher than WHO guidelines, which, in addition to the combined results of the adopted air quality indexes and the use of a restricted number of criteria pollutants to report the air quality, led to AQIs in the intervals good and moderate, despite concentrations frequently being high in terms of WHO guidelines.
Keywords: air quality index, Olympic Games, Rio 2016, ozone, PM10
Introduction
A major consideration in bidding to host a major multi-sport event, such as the Olympic Games, is the potential for the event to generate a wide range of benefits for the population of the host city. Such purported benefits, collectively termed as “Olympic legacy”, include improvements in the economy, infrastructure, environment, sports provision and a perspective of sustainable development and investments in transport and public health.1
When Rio de Janeiro, endorsed by the Brazilian Olympic Committee (COB), submitted its application to host the Games of the XXXI Olympiad to be held in 2016, the citizens had the hope that the event could lead to positive changes and legacies in the social, economic and environmental spheres.1
On October 2, 2009, Rio de Janeiro was announced as the host city of the 2016 Summer Olympic Games, commonly known as Rio 2016. It was the first time that a South American and Portuguese-speaking city hosted the
Summer Olympics and the third time that the Olympics were held in a Southern Hemisphere city. The Olympic Games were held from 5 to 21 August and the Paralympic Games from 7 to 18 September 2016.
During Rio 2016, the city hosted 1.17 million tourists (35% from other countries). The Brazilian Ministry of Tourism reported that the Olympic Games helped the country to achieve record tourism figures in 2016. Over the twelve months of 2016, Brazil welcomed 6.6 million foreign tourists, which represented a 4.8% increase over the previous year and generated a revenue increase of 6.2%.2
Rio de Janeiro invested in several infrastructure projects to improve its transport and port region.3 The competition
venues were clustered in four zones: Barra da Tijuca, Copacabana, Deodoro and Maracanã.4
Department of the Environment (SMAC),6 have shown
that in the city of Rio de Janeiro, NO2, particulate
matter < 10 mm (PM10) and ozone are of major concern;
however, in the eleven new stations that were installed in the proximity of the Olympic arenas, only the meteorological parameters, PM10 and ozone concentrations were
determined.7
Recently, Ventura et al.7 reported that the PM
10 levels
(24 h mean) in Copacabana, Maracanã and Deodoro in 2013-2015 were in the range of 6-96 mg m-3. These
values are below the Brazilian and the United States Environmental Protection Agency (US EPA) standards (150 mg m-3) but above the European Union (EU) and
World Health Organization (WHO) standards (24 h mean, 50 mg m-3).8-13 In Maracanã, the automatic monitoring
station annual means in 2014 and 2015 were 58 and 61 mg m-3, respectively, which is higher than the annual
national standard (50 mg m-3).8 Ozone concentrations from
2013-2015 were also higher in Deodoro, Maracanã and Copacabana, where the national standard (160 mg m-3,
mean for 1 h) was exceeded, mainly in the spring and summer, when values as high as 200 mg m-3 were
obtained.7 It is worth noting that the national standard
is higher than the values recommended by the EU and the WHO (78.5 and 98 mg m-3, respectively).9,11,12 The
2013-2015 data suggested that the Deodoro and Maracanã zones were the most important with respect to PM10 and
ozone concentrations. In the same period, Barra da Tijuca pollutant concentrations were below the national standards.7
During the event and in the days before and after the Olympic Games, the government also adopted some policies to reduce vehicular emissions, such as restricting access to all venues exclusively to public transport, restricting driving for vehicles in certain areas and on main avenues, restricting freight deliveries in terms of time and area, and setting holidays in schools and universities. The most severe restrictions were applied in August, during the Olympic Games (5 to 21 August) and the weeks before and after the Games.
During the Games, the air quality was monitored through the automatic monitoring stations of the State5 and
Municipal Government,6 and the results were reported to
the population in the form of air quality indexes (AQIs). The Brazilian criteria pollutants are smoke, particulate matter, PM10, SO2, CO, ozone and NO2.8 To comparatively assess
the degree of air pollution, the AQI system was proposed by the São Paulo State Environmental Agency (CETESB)14 and
is calculated using the combined concentrations of PM10,
SO2, CO, ozone and NO2.The index has a five-step scale,
from good air quality (0-50) to extremely high pollution (> 300). Between 51 and 100, the air quality is considered
moderate, a level where the population would be considered to not be affected, except for a reduced number of people. For an AQI in the interval of 101-200, the air quality is considered unhealthy, and at least one of the national standards for criteria pollutants had been exceeded. The other steps, 201-300 and > 300, represent a severe risk to public health.
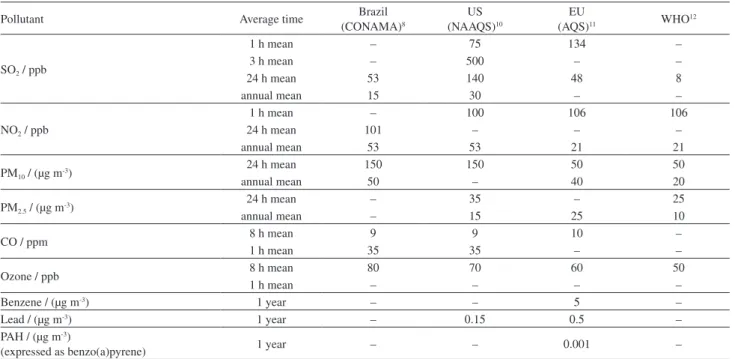
The Brazilian air quality standards (AQS) are shown in Table 1. For comparison, the current air quality limits of the United States, European Union and World Health Organization Air Quality Guidelines (WHO AQG) are also shown.
Table 1 shows that the air quality standards in the EU are somewhat more restrictive than in Brazil and the US. The WHO established guidelines for SO2, NO2, PM10, particulate
matter < 2.5 mm (PM2.5) and O3.12 All these pollutants are
monitored in the US and the EU. In Brazil, PM2.5 is not a
criteria pollutant. Following the recommendations of the WHO, some monitoring stations have been provided with PM2.5 samplers, but the levels are not reported or considered
for the calculations of the AQI. In addition, the EU monitors a larger number of compounds that are set out in the WHO recommendations (CO, benzene, lead and benzo(a)pyrene). The US also monitors CO and lead.
In the US, the Clean Air Act (NAAQS),10 and in Brazil,
the CONAMA Resolution,8 established two types of
national air quality standards. Primary standards set limits to protect public health, including the health of “sensitive” populations (e.g., children, asthmatics), while secondary standards set limits to protect the public welfare (e.g., damage to animals, plants and buildings). These standards are focused primarily on assessing the level of pollution that would be an acceptable level of risk to public health. The European Union, on the other hand, has established air quality limits at levels at which the probability of the impact of pollution on human health is minimal or none. In addition, the EU, in the process of setting air quality limits, was guided by the WHO guidelines.
In this work, the AQIs determined in Rio de Janeiro from July to September 2016 in the monitoring stations operated by the SMAC are compiled. The concentrations of the main criteria pollutants are discussed in terms of the Brazilian, US, EU and WHO guidelines.
Experimental
Monitoring sites
rainforest area, forms a natural barrier to air circulation and divides the city into northern and southern sections. Some of the more upscale neighborhoods and many of the major tourist sites, such as the Rodrigo de Freitas Lagoon and Sugar Loaf and Corcovado Mountains, as well as the famous beaches of Copacabana, Leblon and Ipanema, are located in the South Zone. The Maracanã Stadium and Quinta da Boa Vista Park are located in the North Zone. The West Zone is a rapidly growing suburban area including the districts of Barra da Tijuca and Deodoro, where most of the Olympic arenas were constructed.
According to the Köppen climate classification scheme,15 the climatic condition of Rio de Janeiro is
Group A (Tropical megathermal) Atlantic tropical (Aw). The average annual temperature varies between 23 and 24 °C, where the highest monthly average occurs during the summer in February (28.7 °C) and the lowest monthly average occurs during the winter in July (21.3 °C). The annual relative humidity average varies between 70 and 80%, with no significant variation during the year. The total accumulated annual rainfall is approximately 1,200 mm, generally representing a rainy season (from October to March) and a dry season (from April to September). Air circulation in the metropolitan area is significantly affected by topographical conditions.15
The automatic monitoring stations installed and operated by the State Agency, INEA, were located in the four Olympic zones: Recreio and Jacarepaguá (Barra);
Gericinó and Campo dos Afonsos (Deodoro); Lagoa, Leblon and Urca (Copacabana); and Maracanã, Engenho de Dentro and Centro (Maracanã). They determined the daily concentrations of PM10 and PM2.5 and the
hourly concentrations of ozone.7 The obtained data were
collated as the calculated AQI, and only the pollutant that represented the worst conditions was reported.5
The Municipal Agency, SMAC, operated eight fixed stations: Copacabana, Tijuca (approximately 2 km from Maracanã Stadium), Centro, São Cristóvão, Pedra de Guaratiba, Irajá, Bangu and Campo Grande.6 Data were
reported to the population as a daily bulletin with the AQI and the maximum concentration of each determined pollutant. However, only four stations (Tijuca, Bangu, Irajá and Campo Grande) determined all the criteria pollutants during the Olympic and Paralympic Games. CO, SO2, O3 and NO2 concentrations were obtained
at intervals of 10 min and PM10 in 1 h intervals.16 The
locations of the monitoring stations are shown in the Supplementary Information section, Figure S1, as well as the Olympic zones in Maracanã, Barra, Copacabana and Deodoro. The data obtained in these monitoring stations are discussed in this work. Wind roses calculated for the period July-September 2016, with data provided by the the four monitoring stations are presented in the Supplementary Information section (Figure S2), with locations, as well as the temperature and solar radiation profiles (Figures S3 and S4).
Table 1. Comparison of current air quality limits in the Brazilian, EU, US and WHO guidelines
Pollutant Average time Brazil
(CONAMA)8
US (NAAQS)10
EU
(AQS)11 WHO
12
SO2 / ppb
1 h mean – 75 134 –
3 h mean – 500 – –
24 h mean 53 140 48 8
annual mean 15 30 – –
NO2 / ppb
1 h mean – 100 106 106
24 h mean 101 – – –
annual mean 53 53 21 21
PM10 / (µg m-3)
24 h mean 150 150 50 50
annual mean 50 – 40 20
PM2.5 / (µg m
-3) 24 h mean – 35 – 25
annual mean – 15 25 10
CO / ppm 8 h mean 9 9 10 –
1 h mean 35 35 – –
Ozone / ppb 8 h mean 80 70 60 50
1 h mean – – – –
Benzene / (µg m-3) 1 year – – 5 –
Lead / (µg m-3) 1 year – 0.15 0.5 –
PAH / (µg m-3)
(expressed as benzo(a)pyrene) 1 year – – 0.001 –
Bangu
Bangu District is situated in the geographic center of the city. It is approximately 20 km away from the Atlantic coast and is surrounded by Gericino (970 m) and Pedra Branca (1,020 m) mountains, which are natural barriers for the circulation of air. The district has an area of 45.07 km2
and a population of 243,000 inhabitants.17 Considering the
area in the proximity of the monitoring stations (a radius of 2 km), the population is approximately 413,000. The air quality monitoring station is installed in the central area of the district (22°53’16.53’’S and 43°28’15.91’’W). The predominant winds are from the west and west-southwest.6
The mean temperatures in July, August and September, for the period 1961-1990, were 20.5, 21.8 and 22.5 °C, respectively.18 The district is considered to be the Rio
de Janeiro area with the highest temperatures, and it is characterized by frequent ozone episodes. In the July 2014-July 2016 period, the national air quality standard was exceeded 185 times, considering the ozone hourly measurements.19
Campo Grande
The monitoring station is located (22°53’10.25’’S and 43°33’24.12’’W) in Maina Square, an urban area in the proximity of Paciência (altitude 202 m) and Inhoaíba (altitude 245 m) hills. Campo Grande has an area of 120 km2
and a population of approximately 358,000 with important industrial (plastic, metallurgical, food, pharmaceutical, chemical products), commercial and rural activity.6 The
predominant winds are from the northeast and southeast due to the influence of the marine breeze.
Irajá
The station is located in Nossa Senhora da Apresentação Square (22°49’53.71’’S and 43°19’36.71’’W), a commercial area near the Irajá Cemetery. The square contains leisure and open walking areas and hosts cultural events. Considering the area in the proximity of the monitoring station (a radius of 2 km), the population is approximately 461,000.6 Weak maritime breezes from the east-southeast
are predominant, with a contribution from mountain breezes from the southwest.6
Tijuca
The station is located at Saens Peña Square (22°55’30.07”S and 43°13’57.33”W), a central area in the Tijuca District in the northern part of the city of Rio
de Janeiro, approximately 10 km from the entrance of Tijuca National Park and approximately 1 km from the mountainous rainforest area. The district has an area of 1,006.56 km2 and a population of 165,000 inhabitants.17,20
Considering the area in the proximity of the monitoring station (a radius of 2 km), the population is approximately 461,000 and comprises the Districts of Tijuca, Maracanã, Rio Comprido, São Cristóvão, Vila Isabel, Andaraí and Alto da Boa Vista. The Maracanã Stadium is approximately 2 km from the square and can be accessed by subway, buses and car. Approximately 60% of its area is urbanized, and 30% is covered by Mata Atlântica (tropical rainforest) species. The studied area is characterized by commercial activities and a high flux of vehicles and people because of a terminal subway station as well as many restaurants, bars and leisure activities. Due to the proximity of the Tijuca Forest mountains, maritime breezes do not reach this area. Weak mountain breezes from the south and southwest are the most frequent, and the region is poorly ventilated.6
Data processing
Daily AQI reports were compiled and analyzed to determine the pollutants of major concern. Then, the concentrations (10 min mean) were displayed in the form of box-plot diagrams using code in the R language (version 3.3.1)21 to compare the four sampling locations and
the three-month period. Box-plots diagrams characterize the samples using the 25th, 50th and 75th percentiles, also known
as the lower quartile (Q1), median (Q2) and upper quartile (Q3). In this study, the box length is the interquartile range (IQR = Q3 – Q1) and the median value is indicated as a black line inside the box. Whiskers are extended to the most extreme data point that is no more than 1.5 × IQR from the edge of the box and outliers are indicated as circles.
Results and Discussion
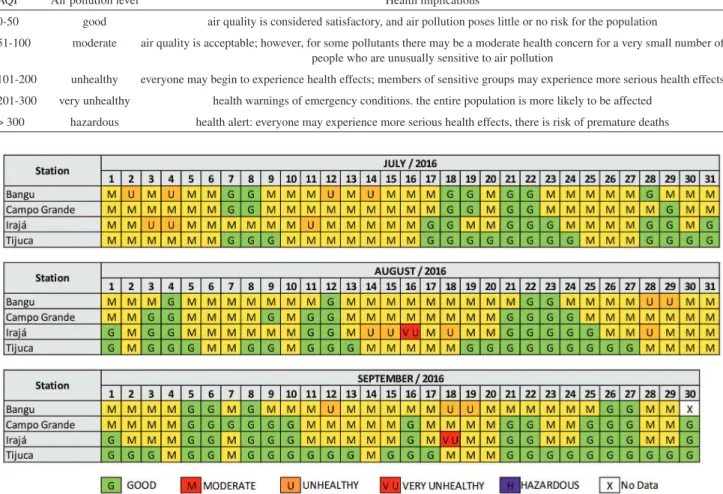
Daily AQIs were determined in July-September 2016 in the automatic stations, Tijuca (Saens Peña), Bangu, Campo Grande and Irajá. AQIs were calculated at 3:00 PM for the previous 24 h.16 The AQIs were calculated
using the Brazilian 5-level classification: good (< 50), moderate (51-100), unhealthy (101-200), very unhealthy (201-300) and hazardous (> 300), as shown in Table 2.14
The detailed calculation of the AQI is detailed by SMAC and also presented in Supplementary Information section (Table S1 and equation S1).22 These AQIs are similar
The calculated values are shown in Figure 1. The worst air quality conditions were observed in Bangu and Irajá. In Irajá, the ozone concentration value of 201 mg m-3 was
exceeded on two days (August 16 and September 18), leading to an AQI > 200. In Bangu, the ozone air quality standard (160 mg m-3) was exceeded on 4, 2 and 3 days
in July, August and September, respectively, leading to an AQI > 100. In Irajá, the AQI was > 100, due to ozone concentrations, on 3 and 4 days in July and August, respectively. For the studied period, on 15.0, 31.5, 33.7 and 61.9% of the days at the four stations, the AQI was < 50 (good air quality).
Moreover, despite the governmental policies to reduce pollutant emissions during the Olympic and Paralympic Games, the concentrations of ozone, nitrogen oxides and PM10 were near or above the levels of concern. In view of
these AQI values, a detailed analysis of concentration data was performed.
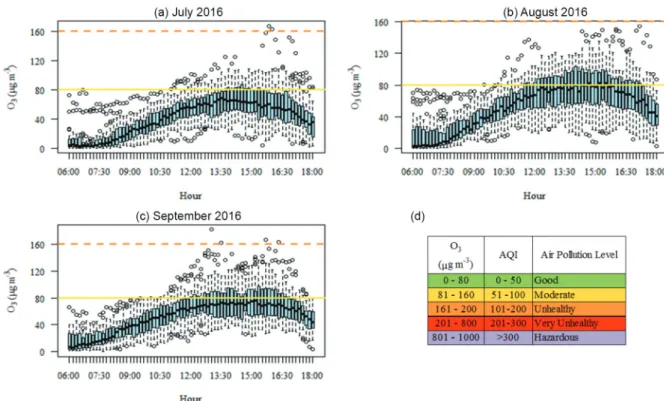
Ozone concentration profiles as a function of the hour of the day are shown in Figures 2-5. The values of 80, 160 and 200 mg m-3 are also shown. As previously
mentioned, 1 h mean values of 81-161 mg m-3 leads to a
moderate AQI (51-100), 1 h mean values of 161-200 mg m-3
leads to an unhealthy AQI (101-200), 1 h mean values of 201-800 mg m-3 leads to a very unhealthy AQI (201-300).
An inspection of Figure 2 shows that the value of 200 mg m-3 was exceeded in July and September, but since
the period was < 60 min, the classification of the AQI was moderate. However, in these conditions, the most sensitive individuals and the athletes might experience serious health effects. The WHO AQG12 for ozone was reduced in 2005
to 100 mg m-3 (daily maximum 8 h mean). According
to the WHO,12 as ozone concentrations increase above
this value, health effects became increasingly numerous and more severe. At 160 mg m-3 (daily maximum 8 h
mean), there is evidence of changes in lung function and lung inflammation in healthy young adults undertaking intermittent exercise.12 Values determined in Bangu were
below the WHO AQG in the studied period, but considering that July-August correspond to the winter season in the Southern Hemisphere and the flux of people and vehicles was lower due to the Olympic Games, higher concentrations
Table 2. Air quality indexes (AQIs) adopted in Brazil and their health implications14
AQI Air pollution level Health implications
0-50 good air quality is considered satisfactory, and air pollution poses little or no risk for the population
51-100 moderate air quality is acceptable; however, for some pollutants there may be a moderate health concern for a very small number of people who are unusually sensitive to air pollution
101-200 unhealthy everyone may begin to experience health effects; members of sensitive groups may experience more serious health effects
201-300 very unhealthy health warnings of emergency conditions. the entire population is more likely to be affected
> 300 hazardous health alert: everyone may experience more serious health effects, there is risk of premature deaths
would be expected in current summer days, increasing the population exposure.
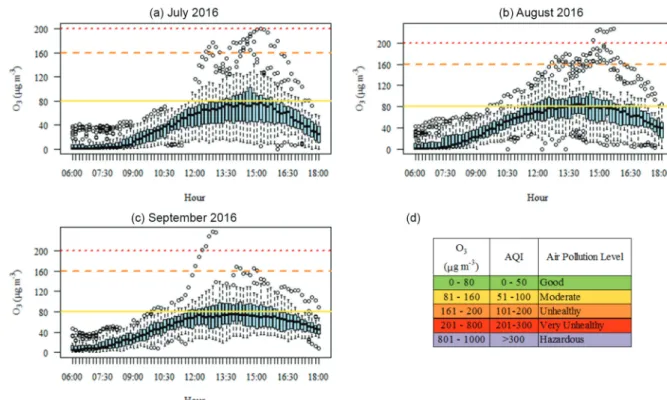
Similar results were obtained for Irajá (Figure 4). In August and September, 200 mg m-3 was exceeded for a period
> 60 min, leading to an unhealthy AQI classification, as
previously shown in Figure 1. For Campo Grande and Tijuca, values were in general below 160 mg m-3 (1 h mean). Values
in August and September were higher than those obtained in July, due to the temperature and solar radiation being generally approximately 10-15% lower in July, as determined
Figure 2. Ozone concentration profiles as a function of the hour of the day for Bangu. (a) July 2016; (b) August 2016; (c) September 2016; (d) AQIs.
in the monitoring stations. Temperature and solar radiation data obtained in Irajá and Bangu, respectively, are shown in the Supplementary Information section (Figures S3 and S4).
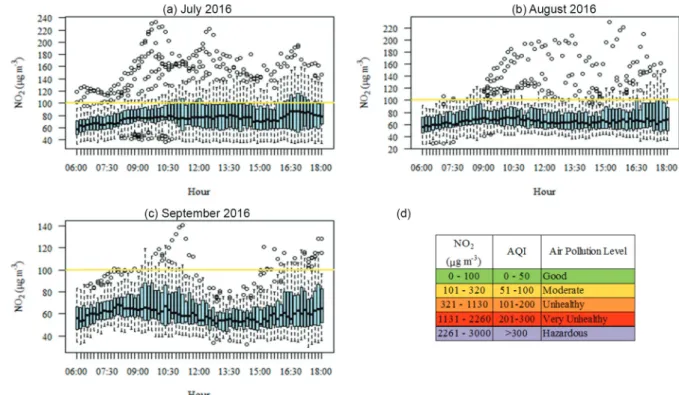
NO2 1 h means were, in general, lower than 100 mg m-3
in Bangu, Campo Grande and Irajá. The NO2 concentration
profiles as a function of the hour of the day are shown in the Supplementary Information section (Figures S5-S7). The values determined in Tijuca are presented in Figure 6. The box-plots show that approximately 75% of the data points are lower than 100 mg m-3. However, values > 100 mg m-3
Figure 4. Ozone concentration profiles as a function of the hour of the day for Irajá. (a) July 2016; (b) August 2016; (c) September 2016; (d) AQIs.
are frequently observed. During the Olympic Games (August 5-21), this value was exceeded on 8 days (47% of the days), with a maximum value of 209 mg m-3 on August 16.
Historical data for Tijuca show that NO2 concentrations in
the interval of 100-320 mg m-3 are frequent, due to the high
vehicular flux, mainly of diesel-fueled buses.
It is worth noting the inverse correlation between NOx (where NOx = NO + NO2) and O3 in Rio de Janeiro
urban area.19,24 The reaction of O(3P) with O
2 is the only
known anthropogenic source of tropospheric ozone.25 O 3
is formed through a complex chemical process involving volatile organic compounds (VOCs) and NOx.26 In this
process, the hydroxyl radical (•OH) is the key reactive
species which reacts with anthropogenic and biogenic VOCs, forming of intermediate •RO2 and •HO2 radicals.
These radicals react with NO and convert it to NO2,
which subsequently decomposes and photochemically forms O(3P) + NO. Ozone may also react with VOCs,
forming intermediate radicals, and NO, forming NO2 + O2.
Therefore, the net photochemical formation of O3versus
net photochemical loss of O3 in the troposphere depends on
the NO concentration and reactivity of the VOC mixture.25
Simulated and experimental results show that in Rio de Janeiro urban area VOCs/NOx ratios are, in general < 8.
In this conditions the kinetic process is VOCs-limited and an increase in NO concentrations results in lower O3
concentrations. This seemingly contradictory behavior is due to the O3 + NO reaction and also to the scavenging of
the radicals which propagate the VOCs oxidations and the NO-to-NO2 conversion. The NO2 competes with VOCs
for the hydroxyl radicals slowing intermediate •RO2 and •HO2 radicals production.26 This inverse correlation was
observed in the monitoring stations. For example, in Tijuca, the higher NO2 (Figure 6) and lower O3 concentrations
(Figure 5) were observed in July.
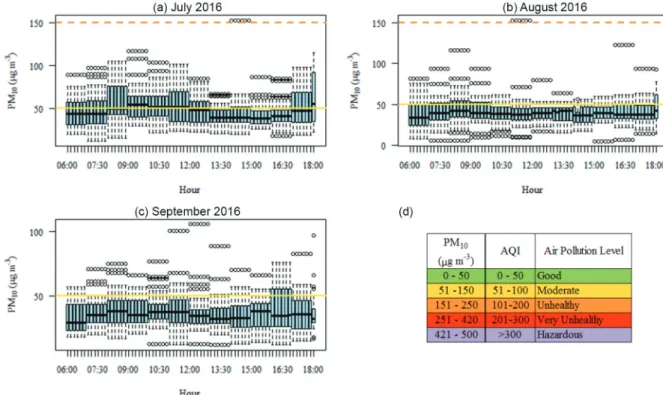
For PM10, the 24 h national standard is 150 mg m-3
in Brazil8 and US10 and 50 mg m-3 in the EU.11 The
WHO AQG is also 50 mg m-3.12 The annual means are 50
and 20 mg m-3 for Brazil and WHO, respectively. Values
determined in the period July-September 2016 in Bangu, Campo Grande, Irajá and Tijuca are shown in Figures 7-10. Values are reported by SMAC as 1 h means.
In July 2016, 1 h medians were in general higher than 50 mg m-3 in Bangu and Irajá. Additionally, more than 50%
of the individual values for the four locations were higher than 20 mg m-3, the WHO AQG for the annual average
concentration. This value was established considering the lower end of the range over which significant effects on survival were observed in the American Cancer Society’s study27 and a PM
2.5/PM10 average ratio of 0.5.12 Higher
primary pollutant concentrations in Irajá and Bangu can also be explained considering the wind roses for the studied period (Supplementary Information section, Figure S2) and the location of the monitoring stations. During that period, the districts received air masses from the east, impacted by the industrial area of Duque de Caxias, and the west,
impacted by the industrial area of Santa Cruz.
Annual PM10 concentration mean values were reported
by SMAC6 for 2011 and 2012 in the four locations. Hourly
annual means were between 25 and 50 mg m-3, with lower
values at night. Daily values were higher in winter due to
lower rainfall during July and August, with an accumulated rainfall < 100 mm.6 In the period 2013-2015, annual means
at the Olympic stations located in Deodoro, Maracanã and Leblon were in the interval 21-61 mg m-3, with the higher
values in the Maracanã Stadium area.7
Figure 7. PM10 concentration profiles as a function of the hour of the day for Bangu (a) July 2016; (b) August 2016; (c) September 2016; (d) AQIs.
Clearly, 24 h values were lower than the Brazilian national standard (150 mg m-3) in the pre-Olympic period
(2013-2015) and during the Olympic Games, and the annual means are lower than the standard (50 mg m-3) in most of
the stations. A similar result was obtained for ozone, since
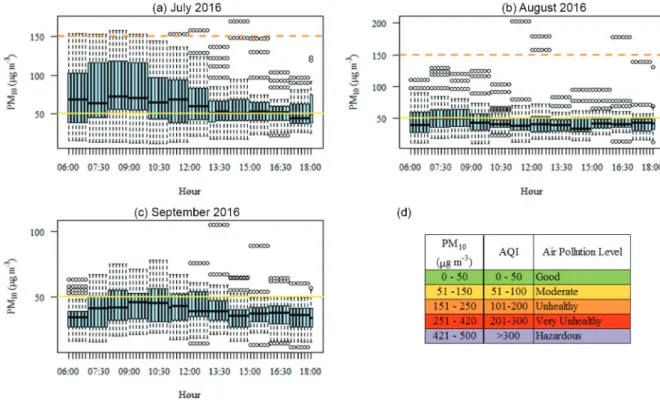
Figure 9. PM10 concentration profiles as a function of the hour of the day for Irajá (a) July 2016; (b) August 2016; (c) September 2016; (d) AQIs.
Figure 10. PM10 concentration profiles as a function of the hour of the day for Tijuca (a) July 2016; (b) August 2016; (c) September 2016; (d) AQIs.
the national standard (160 mg m-3) was not exceeded on
Data reported by INEA for 2013-2015 showed that Deodoro and Maracanã were the Olympic areas of major concern in relation to air quality.5 For example, in August
2015, the AQIs, calculated using ozone concentrations, in Campo dos Afonsos (Deodoro) and Maracanã were moderate on 63 and 32% of the reported days, respectively, indicating that ozone concentrations were in the interval 81-160 mg m-3, and on one day (August 31), the national
air quality standard (160 mg m-3) was exceeded. The high
ozone concentrations in Campo dos Afonsos were related to the proximity of Brazil Avenue, which is considered the main source of vehicular pollutants in Rio de Janeiro.7 In
August 2016, INEA reported that in Campo dos Afonsos and Maracanã stations, there were only one and two days, respectively, when the value of 80 mg m-3 was exceeded.5
The lower ozone levels could be attributed to the traffic restrictions in Brazil Avenue and other important circulation routes in the west and north area of the city and in the proximity of Maracanã Stadium.
The primary pollutants NOx and PM10 were, in
general, lower during the Olympic and Paralympic Games, mainly during the morning, probably due to the restrictions in vehicular flux and the holiday period in schools and universities. However, no reduction in ozone levels was observed. Previous results obtained in Bangu19 in July 2016 showed that ozone levels depend
dramatically upon solar radiation and temperature, which were higher in August and September than in July 2016.6 A close analysis of Figures 2-5 shows that on
several days, ozone concentrations in the early morning were relatively high (> 40 mg m-3), clearly showing the
transport of aged masses of air or the poor dilution of air masses during night. During Rio 2016, the highest ozone concentrations were reported in Bangu and Irajá. These regions are characterized by higher temperatures and poor air circulation in comparison to the southern and western regions of the city and receive emissions from the industrial areas of Duque de Caxias (east), and Campo Grande and Santa Cruz (west). The combined result of restrictions to the circulation of vehicles, high values for national air quality standards28 and the use of a limited
number of compounds for the calculation resulted in AQIs that, in general, were in the interval 0-50 (good). However, ozone and PM10 concentrations were frequently high in
comparison to the WHO guidelines, representing a risk to the health of the population and the athletes.
The results obtained in Rio de Janeiro may be compared to those determined in other Olympic cities, especially Beijing, where many studies were published before and after the Olympic Games.29-39 Several studies
have been published on the results of surface and satellite
measurements during the Beijing Olympics (2008), indicating sharp decreases in the concentration of primary measured pollutants during the Olympic Games.36,39 During
the 2008 Olympic Games, the mean PM10 concentration was
82.4 mg m-3 at Peking University (PKU) in northwestern
Beijing. The mean value reported by the Beijing Environmental Protection Bureau (EPB) was 53.7 mg m-3.32
Daily concentrations reported by Wang et al.32 showed that
12% of days exceeded the 24 h period and China’s Ambient Air Quality Standard (CAAQS, grade II 150 µg m-3) and that
81% of days exceeded the WHO 24 h PM10 QG (50 µg m-3)
and CAAQS Grade I (50 µg m-3). However, considering the
Beijing average, according to EPB, the CAAQS Grade II was not exceeded, and 44% of days exceeded the WHO AQG and CAAQS Grade I. When comparing these data with those obtained in Rio de Janeiro, it may be noted that while the decrease in PM10 concentrations was moderate
(< 15%) in Rio de Janeiro and restricted to the proximity of Olympic arenas, in Beijing, the mean PM10 concentrations
were reduced by 35% during the Olympic period compared to the non-Olympic period.32
However, as reported by Wang et al.,34 levels of ozone,
sulfate and nitrate in PM2.5 increased during the Beijing
Olympic Games by 16, 64 and 37%, respectively, compared to the period prior to the full emission control. The authors reported hourly ozone values up to 370 mg m-3 and
attributed the ozone episodes to the transport of chemically processed air masses from the North China Plain.
Air quality during the Olympic Games and other multi-sports events has been the subject of discussions at both scientific and governmental levels. Hosting the Olympic Games offers many benefits and opportunities to the candidate city. Many years of planning and investments are required to host a successful Olympic Games and to ensure that the Games leave a positive, long-term and sustainable legacy. This legacy includes an improvement in air quality and public health, not only during the Games, but also after the event. It also includes informing the public about the risk of air pollution, monitoring all the criteria pollutants and adopting long-term strategies to ensure a positive impact after the Games.
Recently, Chen et al.40 analyzed the officially reported
air pollution indexes in Beijing from 2000 to 2009 and showed that the adopted measures to improve the air quality during the Olympic Games improved the indexes during and briefly after the Games, but a significant proportion of the effect had faded by October 2009.
The subject has also been discussed before and after the London Olympic Games41-43 and the Rio de Janeiro
Olympic Games.44
using all the criteria pollutants when calculating the AQIs, since the use of a restricted number of compounds may lead to artificially low index values.
Conclusions
Reported data showed that NO2 and PM10 concentrations
were in general lower than 100 and 50 mg m-3 (corresponding
to a good AIQ), during the Olympic period because of the restrictions in vehicular flux. However, ozone concentrations remained high, exceeding the value 160 mg m-3 (1 h mean),
mainly in Bangu and Irajá, probably due to unfavorable meteorological conditions (relatively high temperatures and solar radiation and low wind speed) as well as high NOx/VOCs ratios.
Brazilian air quality allowable standards are clearly high in comparison to WHO guidelines, and the combined results of adopted air quality indexes and the use of a restricted number of criteria pollutants to report the air quality lead to AQIs in the intervals 0-50 (good) and 50-100 (moderate) despite concentrations being frequently high in terms of WHO guidelines.
The adoption of WHO AQG by the IOC during the Olympic candidature process and the election of the host city and the calculation of AQIs using all the criteria pollutants should be recommended.
Supplementary Information
Supplementary data (map of the city, wind roses for the period July-August 2016, temperature values determined in Irajá, solar radiation values determined in Bangu, NO2
concentration profiles as a function of the hour of the day for Bangu, Campo Grande and Irajá, concentrations intervals for the calculation of the air quality indexes) are available free of charge at http://jbcs.sbq.org.br as PDF file.
Acknowledgments
The authors acknowledge data provided by the Municipal Department of the Environment (SMAC) and financial support from the Fundação de Amparo à Pesquisa do Rio de Janeiro (FAPERJ), the Coordenação de Aperfeiçoamento de Pessoal de Nível Superior (CAPES) and the National Counsel of Technological and Scientific Development (CNPq).
References
1. https://www.olympic.org/2016-host-city-election, accessed in November 2017.
2. https://www.olympic.org/news/rio-unveils-wall-of-champions-as-brazil-reveals-record-tourist-boost-from-2016-games, accessed in November 2017.
3. http://www.brasil2016.gov.br/en/legacy/infraestrutura, accessed in November 2017.
4. https://www.olympic.org/rio-2016, accessed in November 2017. 5. h t t p : / / 2 0 0 . 2 0 . 5 3 . 3 : 8 0 8 1 / P o r t a l / M e g a D r o p D o w n / Monitoramento/Monitoramentodoar-EmiQualidade/index. htm&lang=, accessed in November 2017.
6. http://www.rio.rj.gov.br/web/smac/monitorar-rio1, accessed in November 2017.
7. Ventura, L. M. B.; Ramos, M. B.; Fernandes, L. C.; Soares, C. M.; Santos, J. O.; Ineana2017, 4, 6. http://200.20.53.3:8081/cs/ groups/public/@inter_vpres_geiat/documents/document/zwew/ mtmz/~edisp/inea0133565.pdf, accessed in November 2017. 8. Resolução CONAMA No. 003/1990, Dispõe sobre Padrões
de Qualidade do Ar, Previstos no PRONAR, 28/06/1990; Publicação Diário Oficial da União (DOU) de 22/08/1990, p. 15937. Available at http://www.mma.gov.br/port/conama/ legiabre.cfm?codlegi=100, accessed in November 2017. 9. Kuklinska, K.; Wolska, L.; Namiensnik, J.; Atmos. Pollut. Res.
2015, 6,129.
10. https://www.epa.gov/criteria-air-pollutants/naaqs-table, accessed in November 2017.
11. http://ec.europa.eu/environment/air/quality/standards.htm, accessed in November 2017.
12. http://apps.who.int/iris/bitstream/10665/69477/1/WHO_SDE_ PHE_OEH_06.02_eng.pdf, accessed in November 2017. 13. Krzyzanowski, M.; Cohen, A.; Air Qual., Atmos. Health2008,
1, 7.
14. http://ar.cetesb.sp.gov.br/padroes-de-qualidade-do-ar/, accessed in November 2017.
15. http://inside.fei.org/system/files/RIO%20Weather%20 forecast_0.pdf, accessed in November 2017.
16. http://jeap.rio.rj.gov.br/je-metinfosmac/boletim, accessed in November 2017.
17. https://cidades.ibge.gov.br/brasil/rj/rio-de-janeiro/panorama, accessed in November 2017.
18. http://www.inmet.gov.br/portal/index.php?r=clima/ normaisClimatologicas, accessed in November 2017. 19. Geraldino, C. P.; Martins, E. M.; Silva, C. M.; Arbilla, G.; Bull.
Environ. Contam. Toxicol. 2017,98,632.
20. http://portalgeo.rio.rj.gov.br/bdario, accessed in November 2017.
21. https://www.R-project.org/, accessed in November 2017. 22. http://jeap.rio.rj.gov.br/je-metinfosmac/institucional/docs/
entenda_iqa.pdf, accessed in November 2017. 23. http://aqicn.org/map/usa/, accessed in January 2017.
24. Silva, C. M.; da Silva, L. L.; Corrêa, S. M.; Arbilla, G.; Bull. Environ. Contam. Toxicol. 2017, 97, 781.
26. Finlayson-Pitts, B. J.; Pitts Jr., J. N.; Chemistry of the Upper and Lower Atmosphere,Theory, Experiments and Applications; Elsevier Inc.: San Diego, 2000.
27. Pope, C. A.; Burnett, R. T.; Thun, M. J.; Calle, E. E.; Krewski, D.; Ito, K.; Thurston, G. D.; JAMA, J. Am. Med. Assoc. 2002, 287, 1132.
28. Martins, E. M.; Meireles, A. R.; Magalhaes, F. R.; Carvalho, J. B. B.; Ribeiro, M. M.; Rev. Int. Ciênc.2017, 7, 32.
29. Streets, D. G.; Fu, J. S.; Jang, C. J.; Hao, J.; He, K.; Tang, X.; Zhang, Y.; Wang, Z.; Li, Z.; Zhang, Q.; Wang, L.; Wang, B.; Yu, C.; Atmos. Environ. 2007, 41, 480.
30. Wang, T.; Xie, S.; Atmos. Environ. 2009, 43, 5682.
31. Wang, M.; Zhu, T.; Zheng, J.; Zhang, R. Y.; Zhang, S. Q.; Xie, X. X.; Han, Y. Q.; Li, Y.; Atmos. Chem. Phys.2009, 9, 8247. 32. Wang, W. T.; Primbs, T.; Tao, S.; Simonich, S. L. M.; Environ.
Sci. Technol.2009, 43, 5314.
33. Wang, X.; Westerdahl, D.; Chen, L. C.; Wu, Y.; Hao, J. M.; Pan, X. C.; Guo, X. B.; Zhang, K. M.; Atmos. Environ. 2009, 43, 4535.
34. Wang, T.; Nie, W.; Gao, J.; Xue, L. K.; Gao, X. M.; Wang, X. F.; Qiu, J.; Poon, C. N.; Meinardi, S.; Blake, D.; Wang, S. L.; Ding, A. J.; Chai, F. H.; Zhang, Q. Z.; Wang, W. X.; Atmos. Chem. Phys.2010, 10, 7603.
35. Liu, J. F.; Mu, Y. J.; Zhang, Y. J.; Zhang, Z. M.; Wang, X. K.; Liu, Y. J.; Sun, Z. Q.; Sci. Total Environ. 2009, 408, 109. 36. Witte, J. C.; Schoeberl, M. R.; Douglass, A. R.; Gleason, J.
F.; Krotkov, N. A.; Gille, J. C.; Pickering, K. E.; Livesey, N.; Geophys. Res. Lett. 2009, 36, L17803.
37. Okuda, T.; Matsuura, S.; Yamaguchi, D.; Umemura, T.; Hanada, E.; Orihara, H.; Tanaka, S.; He, K.; Ma, Y.; Heng, Y.; Liang, L.; Atmos. Environ.2011, 45, 2789.
38. Schleicher, N.; Norra, S.; Chen, Y.; Chai, F.; Wang, S.; Sci. Total Environ. 2012, 427-428, 146.
39. Mijling, B.; van der A, R. J.; Boersma, K. F.; Van Roozendael, M.; de Smedt, I.; Kelder, H. M.; Geophys. Res. Lett.2009, 36, L13801.
40. Chen, Y.; Jin, G. Z.; Kumar, N.; Shi, G.; J. Environ. Econ. Manag.2013, 66, 424.
41. McCarthy, M.; Ravelli, R. J.; Sinclair-Williams, M.; Cent.Eur. J. Public Health2010, 20, 619.
42. McCartney, G.; Thomas, S.; Thomson, H.; Scott, J.; Hamilton, V.; Hanlon, P.; Morrison, D. S.; Bond, L.; BMJ2010, 340, C2369.
43. http://cleanair.london/olympics/government-is-systematically-hiding-smog-episodes-60-years-after-the-great-smog/, accessed in November 2017.
44. Vilani, R. M.; Machado, C. J. S.; Cad. Saúde Pública 2015, 3, S1.
Submitted: September 14, 2017
Published online: December 11, 2017