Universidade do Minho
Escola de Economia e Gestão
João Bento Ramos Castanho
The importance of Cash Holdings for
Acquiring companies in Mergers and
Acquisitions.
Abril de 2017 The im p or tanc e o f Ca sh Hol d in gs fo r A cq u ir in g compani e s in M e rg e rs an d A cq u is it ion s. Jo ão B en to Ramos C ast an h o U Mi n h o | 2 01 6Universidade do Minho
Escola de Economia e Gestão
João Bento Ramos Castanho
The importance of Cash Holdings for
Acquiring companies in Mergers and
Acquisitions.
Tese de Mestrado em Finanças
Trabalho efectuado sob a orientação do
Professor Doutor Gilberto Ramos Loureiro
ii
The Importance of Cash Holdings for Acquiring Companies in Mergers and Acquisitions.
Acknowledgments
I would like to thank my dissertation supervisor, Professor Gilberto Loureiro, for all the helpfulness and constructive inputs. Additionally, a grateful note to my family and close friends, for the huge support, care and patience.
iii
iv
The Importance of Cash Holdings for Acquiring Companies in Mergers and Acquisitions.
The Importance of Cash Holdings for Acquiring Companies in Mergers and Acquisitions
ABSTRACT
Cash holdings can be an important vehicle for firms to undertake value increasing investment opportunities, but also a source of agency costs. Using a sample of Mergers and Acquisitions of bidders from several countries: Germany, France, UK and US, between 1990 and 2015, I find a positive relation between excess cash and M&A activity. The results also suggest that smaller firms, with higher investment opportunities and riskier cash-flows tend to hold more cash. Additionally, I do not find any short-term significant stock market reaction to cash-rich bidder acquisitions, despite abnormal declines in post-merger operating performance. Finally, cash-rich firms use their cash rather than stock to finance these investment decisions.
Keywords: Cash Holdings, M&As, payment method, announcement returns, operating performance, agency costs.
v
vi
The Importance of Cash Holdings for Acquiring Companies in Mergers and Acquisitions.
A importância do nível de caixa para firmas adquirentes em Fusões e Aquisições.
RESUMO
O nível de caixa de uma empresa pode ser um veículo importante para conseguir financiar oportunidades de investimento de valor acrescentado, mas também pode representar uma fonte de custos de agência. Utilizando uma amostra de Fusões e Aquisições em vários países: Alemanha, França, Reino Unido e EUA, entre 1990 e 2015, encontro uma relação positiva entre o excesso de caixa e a atividade de investimento. Os resultados também sugerem que as empresas de menor dimensão, com maiores oportunidades de investimento e fluxos de caixa com maior nível de risco, tendem a reter mais dinheiro. Além disso, não encontro qualquer reação do mercado de ações, a curto prazo, a aquisições de licitantes ricos em caixa, apesar de encontrar posteriores declínios no desempenho operacional do adquirente. Finalmente, as empresas ricas em dinheiro utilizam o mesmo em vez de ações para financiar essas decisões de investimento.
Palavras-chave: Participações em dinheiro, Fusões e Aquisições, método de pagamento, retorno de anúncios, desempenho operacional, custos de agência.
vii
viii
The Importance of Cash Holdings for Acquiring Companies in Mergers and Acquisitions.
Table of Contents Acknowledgments ... ii ABSTRACT ...iv RESUMO ...vi List of Tables ... x 1. Introduction... 1
2. Literature review and Hypotheses formulation ... 3
3. Methodology ... 8
3.1 Measuring excess cash holdings ... 8
3.2 Probit Model for predicting bidders... 9
3.3 Announcement Returns for Bidders ... 10
3.4 Operating Performance before and after the merger ... 12
3.5 Probit model for Payment Method ... 13
4. Data Selection and Descriptive Statistics ... 14
5. Empirical results ... 20
5.1 Does excess cash predict future acquisitions? ... 20
5.2 Performance evaluation ... 24
5.2.1 Cumulative abnormal returns and Operating Performance ... 24
5.2.2 Operating Performance ... 27
5.3 Payment Method decision ... 28
6. Conclusions and final remarks ... 31
References ... 33
ix
x
The Importance of Cash Holdings for Acquiring Companies in Mergers and Acquisitions.
List of Tables
Table 1 - Description of the Mergers and Acquisitions Sample……….15
Table 2 – Summary Statistics: Acquirer’s accounting and financial data………..…….18
Table 3: Summary Statistics of the sample of Bids……….19
Table 4: Measure of Cash holdings………...21
Table 5 – Summary Statistics for cash-rich Firms……….…..…22
Table 6 – Probit model for predicting Bidders………..…24
Table 7 – Market Reaction to Cash Stockpiling……….26
Table 8 – Operating performance………..28
xi
1
1. Introduction
Conservative financial policies are often criticized as serving the interests of managers rather than the interests of stockholders. The reasons for firms to hold excess cash trigger both academics and practitioners interest, as it is documented that it can influence the market value of the firm’s equity around corporate events. Bates, Kahle and Sultz (2009) acknowledge that cash-to-assets ratios doubled from 1980 to 2006. In the post-crisis period, firms are being encouraged to use their cash stockpiles to stimulate the economy1. Mergers and Acquisitions (M&As)2 constitute a useful setting
to assess some financial consequences of excess cash holdings, providing large observable outcomes of the investment decision process.
Modigliani and Miller (1958) argue that in a frictionless environment, firms are able to fund all value-increasing investment opportunities, and do not depend on the availability of internal capital. However, once capital market imperfections are introduced, cash holdings can be valuable for firms when other sources of funds are insufficient to satisfy the demand for capital. In other words, external financial constraints can be a determining factor for firms to use available cash holdings to fund necessary expenditures and possible investment opportunities.
Holmstrom and Tirole (1998) argue that in a framework of good investment opportunities, agency problems are less relevant compared to the benefits of incremental cash flows from positive NPV projects, and thus leading to the conclusion that firms should hold cash for precautionary reasons, despite the negative effects caused by possible agency problems. Thus, cash reserves can provide benefits to equity holders, by reducing the underinvestment problem. Managers wishing to avoid the costs associated with external financing in an imperfect information environment find it optimal to maintain sufficient internal capital to allow them to reduce the underinvestment problem.
1 “So, if I've got one message, my message is now is the time to invest in America… Today, American companies have nearly $2 trillion sitting on their balance sheets… so I just want to encourage you to get in the game.” (President Obama, Feb. 7, 2011, Chamber of Commerce in Washington, D.C.)
The Importance of Cash Holdings for Acquiring Companies in Mergers and Acquisitions.
2
Jensen (1986) notes that cash-rich companies face serious agency costs as managers tend to make bad acquisitions (negative NPV projects) instead of paying out dividends to the shareholders. This problem is more severe in the presence of large free cash flows that are in excess to meet payments to stakeholders and fund positive NPV projects. Consequently, encouraging firms to use their cash stockpiles to create the illusion of growth may lead to wealth destruction through poor investments in acquisitions, as documented by Moeller, Schlingemann and Stulz (2005).
The purpose of this dissertation is to investigate whether excess cash holdings are related with M&A activity and value-increasing investment decisions in particular. In terms of performance evaluation, I analyse the stock market short-term reaction and operating performance for bidders following successful bids. Finally, I examine whether firms with large cash stockpiles are more likely to use their cash rather than stock to pay for acquisitions.
The first challenge in this matter is to define excess cash, which first requires predicting what the normal level of cash should be for each company. To do so, I use a sample of acquiring firms and apply the Harford (1999) standard empirical model that uses determinants of cash holdings to predict the normal level of cash holdings at the firm level. Excess cash holdings are therefore determined by the difference between the actual and normal level of cash holdings. This model is widely accepted by related literature as a robust methodology of predicting excess cash.
To implement this analysis, I use a sample of M&As where the bidders are from the following countries: United States, United Kingdom, Germany and France, for the time period between 1990 and 2015. A distinctive feature of this research is that it uses a sample from a variety of countries with different characteristics in terms of legal environment, shareholder protection, and development of the financial markets, whereas the bulk of the literature focus essentially on the US market.
Overall, my results provide evidence consistent with the agency cost theory of Jensen (1986), although I do not find a conclusive relation between excess cash and value-decreasing investment decisions.
3
I find evidence that excess cash3 is positively correlated with M&A activity,
controlling for several firm characteristics, including leverage, market-to-book ratio, size, operating cash flow level and sales growth, similarly as it was found by Harford (1999).
Furthermore, operating performance in successful cash-rich bids declines significantly for the subsequent periods following the bid4. This conclusion is also
consistent with the agency cost theory, since operating performance represents an important indicator of the corporate benefit of the acquisition.
However, I do not find statistically significant results for the relation between the stock price reaction at the M&A announcement and cash stockpiling. This result contrasts with that of Harford (1999), who finds significant negative announcement abnormal returns and also evidence of market anticipation for acquisitions made by cash-rich firms. Despite this conclusion, the univariate tests of differences in means and medians indicate that the cumulative abnormal returns (CARs) for cash-rich firms are lower comparing with other firms.
Finally, nevertheless important, I show that cash stockpiles fuel cash acquisitions, as excess cash is positively correlated with cash bids rather than stock bids.
The remainder for this investigation is organized as follows: in section 2, I review the relevant literature related to the topic of the dissertation and formulate the hypotheses. Section 3 describes the empirical methodology. Section 4 explains the sample selection and reports descriptive statistics. Empirical results are discussed in section 5. Finally, section 6 provides conclusions and final remarks of this study.
2. Literature review and Hypotheses formulation
The use of excess cash holdings on M&As may occur in an unfavourable context for shareholders. Denis, Denis and Sarin (1997), Dlugosz, Fahlenbrach, Gompers and Metrick (2004), Palia (2001), Smith (1996) and Wahal (1996) show that large shareholders have enough capital at stake to have an incentive to monitor and influence management’s actions. Managers’ desires of reducing their personal undiversified risk
3 Calculated for the year preceding the acquisition. 4 The period considered following the bid is four years.
The Importance of Cash Holdings for Acquiring Companies in Mergers and Acquisitions.
4
or increase their scope of influence through corporate diversification may lead to poor investment decisions. On the other hand, costs related with external financing and capital market imperfections can trigger an underinvestment problem that might support the need for firms to hold cash for precautionary reasons. Financial literature on this subject is very diverse in the sense that different hypotheses and periods lead to different conclusions.
Harford (1999) finds that there are reasons for shareholders to be concerned about managers’ access to large pools of internal funds. In this study, the results suggest that cash-rich firms are more likely to make acquisitions, and these are acquisitions that are referred as “value-decreasing”, and their targets are less likely to attract other bidders.
“The results on acquisitions have implications for boards of directors and investors in evaluating payout policy and cash reserves. Large cash balances remove an important monitoring component from the investment process, often resulting in the destruction of shareholder value” (Harford, 1999, p. 1996).
Similarly, Décamps, Mariotti and Rochet (2011) establish a model that predicts that the marginal value of cash varies negatively with the stock price, and positively with the volatility of the stock price.
Along with Harford (1999), Pinkowitz, Stulz and Williamson (2006), Harford, Mansi and Maxwell (2008) and Kalcheva and Lins (2007)6 find evidence consistent with
the agency cost argument. These studies point out corporate governance and investor protection as important drivers for cash holdings and firm value relation.
Harford et al. (2008) show that poorly governed firms tend to dissipate their cash reserves more quickly than firms with stronger governance, and spend the cash primarily on acquisitions. These investments of cash by weakly governed managers reduce future profitability, an effect that is incorporated in firm stock prices. This implicates that better-governed firms are able to use both cash and stock in acquisitions.
6 These authors find that when external country-level shareholder protection is weak, firm values are lower when controlling managers hold more cash. This insight is not directly associated with the purposes of this dissertation, but gives an important notion of the determinants of cash holdings and firm value.
5
Likewise, Dittmar and Mahrt-Smith (2007) find that effective corporate governance increases with the value that investors attach to a firm's level of cash holdings7.
In relevant literature, there are also several findings that support cash as an important vehicle for firms undertake good investment opportunities through M&As, especially for financially constrained firms.
Pinkowitz et al. (2006) find that small firms, firms with strong growth opportunities, more investment in R&D, and riskier cash flows hold larger amounts of cash. Pinkowitz and Williamson (2001) find similar results for firms in the US, Japan, and Germany, and find that the investment opportunity set, rather than the financing opportunity set of the firm affects the value that shareholders place on a firm's cash holdings. Ozkhan and Ozkhan (2004) find that firms with higher market-to-book ratios have higher levels of cash8.
Previous evidence can be related with the industry of the firm, periods of financial crisis or corporate governance. In a context of more efficient markets, firms should be always able to raise funds to invest.
Campello, Lin, Ma and Zou (2011)9 find that for the period of the financial crisis
of 2008/2009 the option to access liquidity through credit lines becomes less valuable when internal liquidity is abundant10. Looking at real-side decisions of US firms for this
period, cash savings were the primary method of investing in presence of unavailability to access credit lines.
Bates et al. (2009) find that the significant increase of firm’s cash ratios since the 1980s is related to the increasing risk of firm’s cash flows and the fact that firms hold fewer inventories and receivables and are increasingly R&D intensive. In this investigation, precautionary reasons to hold cash have significant explanatory power for this increase. Kim, Mauer and Sherman (1998) and Harford (1999) also report that cash holdings are positively correlated with industry cash flow volatility, in the sense that
7 In this study, good governance approximately doubles the value of cash relatively to poor governed firms.
8 This investigation also reveals that firm’s growth opportunities, cash flows, liquid assets, leverage and bank debt are important in determining cash holdings.
9 These authors conducted three surveys in 2009 and 2010, each containing approximately four hundred private and public firms in the United States. These surveys contain information about firms' spending plans (investment, technology, and employment), difficulty in accessing or renewing credit lines, the pricing of lines, covenant violations, line renegotiations, and drawdown activity. 10 Even considering the fact that more profitable, liquid firms should find it easier to establish credit lines.
The Importance of Cash Holdings for Acquiring Companies in Mergers and Acquisitions.
6
firms with lower or no bond ratings or that operate in high cash flow volatility industries face higher costs of external finance, supporting the theory that constrained firms hold more cash than unconstrained firms.
Alongside with these results, studies from Faulkender and Wang (2006), Pinkowitz et al. (2006) and Denis and Sibilkov (2010) support that the value of cash is greaterfor constrained than for unconstrained firms. These results imply that higher cash holdings allow constrained firms to undertake value-increasing projects that might otherwise be bypassed. Almeida, Campello and Weisbach (2004) find that cash flow sensitivity of cash is positive for financially constrained firms, but statistically insignificant for unconstrained firms. Denis and Sibilkov (2010) also find that financially constrained firms exhibit low cash holdings because of persistently low cash flows. All these findings are strong indicators that firms hold cash for precautionary reasons.
Mikkelson and Partch (2003) find that persistent extreme cash holdings do not lead to poor performance and do not represent conflicts of interests between managers and shareholders, evidence consistent with cash reserves enhancing value, for both financially constrained and unconstrained firms. By examining operating performance and other characteristics of firms that for a five-year period held more than one-fourth of their assets in cash and cash equivalents, the results suggest that high cash holdings are accompanied by greater investment levels, particularly R&D expenditures, and by greater growth in assets. For firms that persistently hold large cash reserves, these authors conclude that such policies support investment without hindering corporate performance. Oppositely, Harford (1999) also examines operating performance of cash-rich bidder M&As, and shows that mergers with cash-cash-rich bidders are followed by abnormal declines in operating performance.
In sum, financial literature refers several factors that influence firm’s level of cash: time period, corporate, industry or market level conditions. After acknowledging all these possible explanations and determinants to justify firm’s excess cash holdings and respective consequences, my dissertation focuses exclusively on M&A analysis from the bidder’s perspective to find the financial consequences for bidders of holding excess cash prior to bid announcements. Relevant literature with this type of investigation is quite limited especially for recent years, as previous results are not transparent for more recent data, which lead me to the formulation of the following hypotheses:
7
• H1: Cash-rich firms are more likely to engage in M&A activities;
• H2: Cash-rich bidders observe lower abnormal returns around the announcement of successful M&As;
Proponents of this show that there should be a positive relation between excess cash and investment decisions, and a respective negative relation with stock market returns due to the negative reaction of the stock markets consistent with the agency cost theory11. Although relevant literature on the topic seem to account similar results,
these results are consistent for samples containing attempted acquisitions and successful acquisitions. Luo (2005) finds that the market reaction to a merger and acquisition announcement influence whether the deal is consummated or not, as merging companies take into account information from the market reaction in closing the deal. Consequently, my dissertation focuses on successful deals, differing from what conventional literature consider.
The evidence on M&A post-operating performance is mixed: there is no consensus on whether cash-rich bidder firms have significant lower post-operating performance. However, several studies show that bids with lower announcement returns are typically followed by poor post-merger operating performance. Healy, Palepu and Ruback (1992) conduct a test of the post-merger performance and find a direct relationship between stock market reaction and post-merger performance, indicating that the market anticipated performance improvements to the initial acquisition announcement, which on average was positive in their sample. On the opposite, Harford (1999) with a similar approach find that the market recognizes that cash-rich bidders make poor acquisitions and these expectations are manifested at the announcement of the bid and realized by the operating performance of the merged firm over the post-acquisition period. Thus, in addition to this analysis regarding M&A activity, I also examine the post-merger operating performance of cash-rich bidders, similarly to Harford (1999):
The Importance of Cash Holdings for Acquiring Companies in Mergers and Acquisitions.
8
• H3: Cash-rich bidders tend to exhibit lower operating performance following successful M&As;
Associated to the M&A process, previous research examining the role of the method of payment in explaining announcement returns to bidding firms in acquisitions find significant differences between cash and stock transactions. Wansley, Lane, and Yang (1983), Asquith, Bruner and Mullins (1983), Travlos (1987) and Brown and Ryngaert (1991) report that returns to bidders tend to be negative and significant in stock acquisitions and slightly positive though not significant in cash acquisitions.
Pinkowitz, Sturgess and Williamson(2013) add to literature the analysis regarding the payment method that cash-rich firms use in M&As, and find that U.S. cash-rich firms are less likely to use cash to finance acquisitions than similar non cash-rich firms, using alternative measures of excess cash. Consequently, between 1984 and 2006, cash-rich bidders are 23% less likely to make cash payment in acquisitions relative to other bidders. Additionally, cash-rich firms also include lower proportion of cash in mixed bids whencomparing with other firms. The authors find that although cash holdings have influence in terms of acquisition decision, there is no clear explanation of why managers of cash-rich firms prefer to use stock in acquisitions. The results are robust for explanations related to agency, financial constraints, tax-related explanations, equity overvaluation, and capital structure. Consequently, the results in this paper mitigate the concern that cash stockpiles will lead to overinvestment in acquisitions.
Given these recent surprising findings and complementing the previous hypotheses, my dissertation also explores a possible link between excess cash and payment method decision. Therefore, I formulate the following hypothesis:
• H4: Cash Stockpiles lead to cash-paid acquisitions;
3. Methodology
9
There are various ways to test the financial effects of cash holdings on corporate performance and investment activity. The first step to conduct this kind of research and test my hypotheses is to establish a model of baseline cash holdings. This model is essential to all of the formulated hypotheses, since it will determine for every firm-year the normal level of cash and draw the line between normal/excess cash.
The main estimation cash models used in literature are documented by Opler, Pinkowitz, Stulz and Williamson (1999) and Harford (1999). These two models are very similar, as they use several determinants of cash holdings to predict the normal level of cash holdings for each firm. Excess cash holdings are determined by the difference between the actual and normal level of cash holdings predicted by the model, in which firms are classified as cash-rich based on the distribution of excess cash. These models are the main standard empirical models that have been used to study both the determinants and implications of cash holdings. Pinkowitz et al. (2013) perform robustness checks on several alternative methodologies to measure excess cash (as in Opler et al. (1999), Harford (1999) and Deangelo, Deangelo and Stulz (2010)), and find robust results using Harford’s (1999) methodology. Thus, my model is based on Harford (1999) and is represented as follows:
𝐶𝑎𝑠ℎ/𝑆𝑎𝑙𝑒𝑠𝑖,𝑡= 𝑎𝑖 + 𝛽1𝑁𝑒𝑡𝐶𝐹𝑂/𝑆𝑎𝑙𝑒𝑠𝑖,𝑡+ 𝛽2∆ 𝑁𝑒𝑡𝐶𝐹𝑂/𝑆𝑎𝑙𝑒𝑠𝑖,𝑡+1
+ 𝛽3∆𝑁𝑒𝑡𝐶𝐹𝑂/𝑆𝑎𝑙𝑒𝑠𝑖,𝑡+2+ 𝛽4𝑀/𝐵𝑖,𝑡−1+ 𝛽5𝐶𝐹𝑂𝑉𝑎𝑟𝑖+ 𝛽6𝑆𝑖𝑧𝑒𝑖,𝑡+1+∈𝑖,𝑡 (1)
Where NetCFO is operating cash flow net of investments; M/B is the firm’s Market-to-book assets ratio; CFOVar is the coefficient of variation for the firm’s Cash flows, and Size is log of the Market Value of Equity13. Further, I include industry, country
and year fixed-effects.
3.2 Probit Model: excess cash and the likelihood of a bid
13 The original model from Harford (1999) included also recession dummies and risk premium, which in the model used are substituted by the fixed effects.
The Importance of Cash Holdings for Acquiring Companies in Mergers and Acquisitions.
10
After calculating the cash measure mentioned in the previous segment, in order to study my first hypotheses, I developed a probit model to find the relationship between excess cash and M&A activity. Within the sample of M&A acquirer’s, with the probit model I am able to find if firms with higher levels of cash are more likely to engage in M&As in the following period.
Harford (1999) established a relation between excess cash and acquisition behavior by using a probit equation to predict which firms will attempt an acquisition. The regression I used for this purpose is based on this model, and states as follows:
𝐴𝑐𝑞𝑢𝑖𝑠𝑖𝑡𝑖𝑜𝑛𝑖,𝑡= 𝛼0+ 𝛽1𝐶𝑎𝑠ℎ𝑑𝑒𝑣.𝑖,𝑡−1+ 𝛽2𝑆𝑎𝑙𝑒𝑠𝐺𝑟𝑜𝑤𝑡ℎ𝑖,𝑡−1+ 𝛽3𝑁𝑜𝑛𝐶𝑎𝑠ℎ𝑊𝐶𝑖,𝑡−1 + 𝛽4𝑀/𝐵𝑖,𝑡−1+ 𝛽5𝑃𝐸𝑅𝑖,𝑡−1+ 𝛽6𝐿𝑒𝑣𝑒𝑟𝑎𝑔𝑒𝑖,𝑡−1+ 𝛽7𝑆𝑖𝑧𝑒𝑖,𝑡−1+∈𝑖,𝑡
(2) The dependent variable in the probit is equal to one if the firm announces a bid in year t and zero otherwise. The remaining variables are: cash deviation, which is the cash deviation of the firm’s cash to sales level from the average value predicted given by the methodology previously referred; Several other firm characteristics are included for control: Annual sales growth, noncash working capital normalized by total assets, the ratio of the market value to the book value of equity, stock price at the end of the year divided by earnings per share for that year, leverage ratio and the natural logarithm of the market value of equity. For all these variables, the model uses the values of the year prior to the acquisition announcement, t-1, and t is the prediction year. In order to reduce possible yearly noise and represent a real scenario of the firm’s characteristics I also included in this regression industry, country and year fixed-effects.
3.3 Announcement Returns for Bidders
In order to obtain an estimation of the valuation impact of successful M&As made by cash-rich acquirers, I test the stock price reaction to the M&A announcements. To examine the market’s assessment of the M&As I compute the cumulative abnormal returns (CARs) around the deal announcements. Initially, I estimate the expected return surrounding the announcement period using the market model, as described by
11
Mackinlay (1997), which assumes a linear relation between the return of a market index and the security return. The market model removes the portion of the security return that is related to the variation in the market return, increasing the ability to detect the event effects (Mackinlay, 1997). After estimating what the normal stock return would be around the event, as if the event had not taken place, I compare it with the actual stock return. The estimation window is 231 days (-250 to -20) for different event windows, which go up to 21 days surrounding the event (10;10), 5;5), 2;2) and (-1;1)), being 0 the day of the acquisition announcement date. The abnormal return is then calculated by the difference of actual minus expected return for each day of the event window; then, for each acquirer, I compute cumulative abnormal return (CAR), i.e., the sum of the abnormal returns of each day of the event window.
As the literature suggests, there are two categories of factors that can explain acquirers’ announcement returns: bidder characteristics and deal characteristics. The bidder characteristics that I use as controls are firm size, leverage and Market-to-Book value, which are measured at the end of the year prior to the acquisition announcement. Moeller et al. (2005) find robust evidence that bidder size is negatively correlated with the acquirer's announcement-period returns, leading to the expectation that managers of larger firms are more entrenched and more likely to make value-reducing acquisitions. Leverage is also an important control variable, since higher debt levels may help reduce future free cash flows and limit managerial discretion (Masulis, Wang and Xie,2007). Asquith et al. (1983) and Moeller et al. (2005) find that bidder announcement returns increase in relative deal size. Thus, in terms of deal characteristics that influence bidder announcement returns, I use controls for all-cash paid acquisitions, cross-border and relative deal size.
Consequently, I estimate the following regression to test whether the patterns of cumulative abnormal returns are different for bidders with higher levels of cash, using the measure of excess cash holdings explained in section 4.1., with the following specification:
The Importance of Cash Holdings for Acquiring Companies in Mergers and Acquisitions.
12 𝐴𝑣𝑔. 𝐶𝐴𝑅𝑖,𝑡= 𝛼0+ 𝛽1𝐶𝑎𝑠ℎ𝑑𝑒𝑣.𝑖,𝑡−1+ 𝛽2𝐿𝑒𝑣𝑒𝑟𝑎𝑔𝑒𝑖,𝑡−1+ 𝛽3𝑀/𝐵𝑖,𝑡−1+ 𝛽4𝑆𝑖𝑧𝑒𝑖,𝑡−1
+ 𝛽5𝑃𝑎𝑖𝑑𝑖𝑛𝐶𝑎𝑠ℎ𝑖,𝑡+ 𝛽6𝐶𝑟𝑜𝑠𝑠𝑏𝑜𝑟𝑑𝑒𝑟𝑖,𝑡+ 𝛽7𝑅𝑒𝑙𝑎𝑡𝑖𝑣𝑒𝑆𝑖𝑧𝑒𝑖,𝑡 ∈𝑖,𝑡
(3)
Where 𝐴𝑣𝑔. 𝐶𝐴𝑅 is the average CAR value by firm-year, 𝑃𝑎𝑖𝑑𝑖𝑛𝐶𝑎𝑠ℎ is a dummy variable equal to one for deals paid in 100% cash, 𝐶𝑟𝑜𝑠𝑠𝑏𝑜𝑟𝑑𝑒𝑟 is a dummy variable equal to one for deals with bidder and target from different countries, and 𝑅𝑒𝑙𝑎𝑡𝑖𝑣𝑒𝑆𝑖𝑧𝑒 is the deal value deflated by Total assets of the year prior to the announcement15.
3.4 Operating Performance before and after the acquisition
Operating performance subsequent to successful M&As is also an interesting indicator for evaluating the outcome of investment decisions. Since previous literature finds unclear results for this indicator, I decided to include this analysis from the bidder’s perspective, as to investigate a possible relation between cash stockpiling and operating performance.
The measure of operating performance used in these tests is cash flow return-on-assets. Cash flow here is defined as operating cash flow to exclude income from short-term investments. The market value of total assets is used in the denominator. Barber and Lyon (1996) show that when studying operating performance, it is important to control for abnormal firm characteristics prior to the event. To mitigate this type of issue, the model I use contains a control variable for the mean cash flow return-on-assets from four years prior to the event16. Consequently, the following regression is
estimated: 𝑃𝑜𝑠𝑡𝑚𝑒𝑟𝑔𝑒𝑟 𝐶𝐹 𝑇𝐴𝑖 = 𝛼0+ 𝛽1𝐶𝑎𝑠ℎ𝑑𝑒𝑣.𝑖,𝑡−1+ 𝛽2𝑃𝑟𝑒𝑚𝑒𝑟𝑔𝑒𝑟 𝐶𝐹 𝑇𝐴𝑖 + ∈𝑖,𝑡 (4)
Average cash flow return-on-assets is calculated for the bidder over the premerger period, considered as years -4 to -1 and also for the post-merger period,
15 𝐶𝑎𝑠ℎ𝑑𝑒𝑣, 𝐿𝑒𝑣𝑒𝑟𝑎𝑔𝑒 and 𝑀/𝐵 are the same variables as in equation (2).
16In order to further mitigate this issue, Barber and Lyon (1986) and Harford (1999) use a control sample of firms experiencing normal performance.
13
which is the period between the years +1 to +4. Cash deviation is the deviation of the firm’s observed cash ratio from the average value predicted given by the equation (1). The coefficient 𝛽1 captures the relation between excess cash and post-merger
operating performance. The 𝛽2 coefficient captures the continuation of premerger
performance. The 𝛼0 coefficient captures any abnormal performance improvements
between the premerger and postmerger periods. In the Healy et al. (1992) study, this coefficient is significantly positive, consistent with the average positive bidder abnormal returns for merger announcements in their sample. In contrast, Harford (1999) finds a negative and significant coefficient, which is also consistent with the average negative bidder abnormal returns found in his study.
3.5 Probit model for Method of Payment
Finally, to test my last hypothesis, I will measure payment methods within my sample and the probability of cash-rich bidders paying their acquisitions using more cash rather than stock. This section positions the main determinants of payment methods and focuses on the role of cash holdings on the method of payment decision and directly controls for deal and firm characteristics.
Pinkowitz et al. (2013) perform various multinomial logistic regressions and test multiple firm- and deal-level variables. Based on these models, I estimate the following probit regression:
𝛶𝑖,𝑡 = 𝛼0+ 𝛽1𝐶𝑎𝑠ℎ𝑑𝑒𝑣.𝑖,𝑡−1+ 𝛽2𝐿𝑒𝑣𝑒𝑟𝑎𝑔𝑒𝑖,𝑡−1+ 𝛽3𝑀/𝐵𝑖,𝑡−1+ 𝛽4𝑆𝑖𝑧𝑒𝑖,𝑡−1
+ 𝛽5𝑆𝑎𝑙𝑒𝑠𝐺𝑟𝑜𝑤𝑡ℎ𝑖,𝑡−1+ 𝛽6𝐶𝑟𝑜𝑠𝑠𝑏𝑜𝑟𝑑𝑒𝑟𝑖,𝑡+ 𝛽7𝐷𝑒𝑎𝑙𝑉𝑎𝑙𝑢𝑒𝑖,𝑡 ∈𝑖,𝑡 (5)
𝛶 , the dependent variable, is the method of payment for firm i in year t, and assumes the value one if the payment method is composed by at least 90% cash and zero otherwise; 𝐶𝑎𝑠ℎ𝑑𝑒𝑣. is the cash deviation of the firm’s cash ratio from the average value estimated using equation (1); The remaining firm and deal-level control variables include: Sales growth, Market-to-Book ratio, Leverage, the value of the deal and a dummy variable equal to one for deals with bidder and target from different countries.
The Importance of Cash Holdings for Acquiring Companies in Mergers and Acquisitions.
14
4. Data Selection and Descriptive Statistics
My initial events sample contains 7,664 Mergers and Acquisitions announced between January 1990 and December 2015, and it was obtained from Securities Data Company (SDC) Platinum database. The sample of bids was subject to the following criteria: (1) The bidder owns less than 50% of the target prior to the bid and acquires at least 50% of shares; (2) Both bidder and target are classified by SDC as public corporations; (3) Utility and financial sectors, firms whose Standard Industry Classification (SIC) codes are between 4900-4949 and 6000-6999 were excluded; (4) Bidders are from the following countries: U.S., U.K., France and Germany; (5) Bidders with Market Value inferior to 10 Million Dollars were excluded17; (6) Both Bidder and
Target are listed as Public firms; (7) Deals inferior to 1 Million Dollars were excluded; (8) The deal type is classified as a disclosed value merger, an LBO, or a tender offer; (9) The form of the deal is listed by SDC as a merger or acquisition of assets; (10) All repurchases, equity carve outs, and limited partnerships are excluded. Additionally, deal values were restricted to values superior to 1 Million Dollars. The filters used are based on related literature (as in Pinkowitz et al. (2013)). As a result, from these specifications I obtain 3,515 M&As from 2,240 different companies.
The accounting and financial data are obtained from Thomson’s DataStream and WorldScope databases. All the date frequencies used are yearly except stock and market returns, which are daily. To measure the quality of the corporate governance at the country level, I use data from the World Bank database, and it corresponds to the same period and frequency of the accounting and financial data. The variables measured in prices are adjusted for inflation, using the consumer price index (2015=100) obtained from the World Bank database, an adjustment that enables to uncover real growth or decline, if any. In order to avoid estimation biases created by potential outliers, I winsorize all of the firm-level variables at 1% of its distribution.
Further, since some firms have missing values for some variables, there are variations in the actual sample size depending on the model being used.
Panel A of Table 1 shows how Mergers and Acquisitions are distributed by Acquirer’s country. Clearly, the amount of M&As is much more frequent in the U.S.
15
(81.5%) than in the other countries. Germany is the least representative country, since it only embodies 129 observations, half of the United Kingdom (258 observations), which comes second in the list. Panel B shows the same distribution, but by Target’s country. We can conclude that the vast majority of the Targets are also from the U.S. (70.75%), followed by U.K., Canada, France and Germany as main Target countries of the sample18.
In fact, only 23.76% of the observations are Cross-border Mergers and Acquisitions, explaining this relation between panel A and B. From Panel C, we can see that the sample contains many types of businesses, but the ones that are truly significant are the manufacturing and services industries, that together account over 84% of the sample. Finally, Panel D reveals the distribution of M&As over the years. It can be seen that the number of observations increases across the 1990’s. The most active period of the sample is between 1997-2000, representing approximately 30% of the M&As. It’s also remarkable that the low level of observations of the early 1990’s is consistent with the documented merger drought, that followed the merger wave of the 1980’s. Also, we can see a continuous decline from 2007 to 2013, which might be related to the crisis of 2007 and some post-crisis uncertainty environment.
Table 1 - Description of the Mergers and Acquisitions Sample
The sample includes Mergers and Acquisitions made by acquirers from four different countries between 1990 and 2015. I exclude utilities and financial firms (SIC codes between 4900 and 4949 and between 6000 and 6999) Data are obtained from Securities Data Company (SDC) Platinum database. Panel A presents the number of the M&As by acquirer’s country. In Panel B, M&As are shown by the major Target’s countries. In panel C, according to the two-digit SIC code, and Panel D shows the M&As’ distribution by year.
Panel A: Distribution of the Mergers and Acquisitions by Bidder’s Country
Country #M&As %M&As
United States 2863 81.5 France 265 7.54 United Kingdom 258 7.34 Germany 129 3.67 Total 3,515 100
The Importance of Cash Holdings for Acquiring Companies in Mergers and Acquisitions.
16
Panel B: Distribution of the Mergers and Acquisitions by Target’s Country
Country #M&As %M&As
United States 2487 70.75 United Kingdom 250 7.11 Canada 216 6.14 France 170 4.84 Germany 65 1.85 Other Countries 327 9.30 Total 3,515 100
Panel C: Distribution of the Mergers and Acquisitions by Acquirer’s Industry
Industry SIC code #M&As %M&As
Mining 10-14 149 4.24
Construction 15-17 53 1.51
Manufacturing 20-39 1,837 52.26
Transportation & Public Utilities 40-49 28 0.80
Wholesale Trade 50-51 105 2.99
Retail Trade 52-59 210 5.97
Services 70-89 1,133 32.23
Total 3,515 100
Panel D: Distribution of the Mergers and Acquisitions by Year
Year #M&As %M&As
1990 11 0.31 1991 66 1.88 1992 50 1.42 1993 62 1.76 1994 126 3.58 1995 156 4.44 1996 166 4.72 1997 222 6.32 1998 265 7.54 1999 271 7.71 2000 273 7.77 2001 203 5.78 2002 149 4.24 2003 137 3.90 2004 140 3.98 2005 150 4.27 2006 154 4.38 2007 157 4.47 2008 114 3.24 2009 106 3.02 2010 111 3.16 2011 79 2.25 2012 90 2.56 2013 72 2.05 2014 85 2.42 2015 100 2.84 Total 3,515 100
17
In panel A of Table 2 it is possible to analyse the main accounting and financial variables considered in the determination of cash rich firms and the determinants of predicting bidders for the whole sample. The variables suggested in the acquisitions literature include sales growth, non-cash net working capital, market-to-book ratio, leverage, and firm size (see Ambrose and Megginson (1992), Comment and Schwert (1996), and Harford (1999), among others). The sample regarding this data is in firm-years, and contains 51,870 observations for periods between 1980-201519. The results
show that the average cash/sales ratio is about 30%, but the median is only 7%, which indicates some dispersion on this variable, which has a relatively high standard deviation. This ratio is crucial throughout this dissertation, since it will be used to determine excess cash holdings. The Cash/Total Assets ratio also undertakes a similar result. Another interesting figure in this panel is the positive level of sales growth (approximately 7%), which indicates that in my sample period the average evolution of sales level is increasing.
In panel B the main drivers of cash-richness are sorted by major industry groupings. The most frequent Industries in my sample are manufacturing (20-39 SIC range) and services (70-89 SIC range), which have the highest median values for the main determinants of Cash richness on this dissertation20, especially for the Market-to-Book
ratio and Operational Cash flow variation. Firms in an industry with a high average market-to-book ratio tend to derive most of their value from growth opportunities and intangibles, such as human capital and R&D. As previously referred, Cash Flow volatility and growth opportunities are documented by several authors as variables highly linked to cash stockpiling. By analysing panel B, we can see that the most frequent Industries in the sample contain strong levels of these variables when compared to the other industries.
19 The decade of 1980’s was included as so to obtain historical data previous to the first M&A observations. 20 Although the Mining Industry has the second highest level of Cash/Sales, next to Services.
The Importance of Cash Holdings for Acquiring Companies in Mergers and Acquisitions.
18
Table 2 – Summary Statistics: Acquirer’s accounting and financial data
The accounting and financial data are obtained from Thomson’s DataStream and WorldScope database. Each observation corresponds to a firm-year, from 1980 to 2015. I exclude utilities and financial firms (SIC codes between 4900 and 4949 and between 6000 and 6999).Variables are winsorized at 1% of the distribution. Panel A shows summary statistics regarding the main determinants of cash-richness for the total sample. Panel B shows the median values, by major industry groups, of the variables in panel A. All variables are defined in Appendix A.
Panel A: Summary Statistics of Cash Holdings
# obs. Mean Median Std. Dev.
Cash/Sales 22,048 0.3020 0.0778 0.9916 Cash/Total Assets 22,258 0.1151 0.0683 0.1372 CFO/Sales 31,842 -0.0149 0.0847 0.7046 M/B 39,783 2.8006 2.0100 4.0859 CFO Var./Sales 28,640 0.0302 0.0359 1.8956 Leverage ratio 33,256 0.7017 0.4072 1.8183 Sales Growth 31,419 0.0710 0.0772 0.0312 Size 40,838 6.3388 6.6273 2.566
Panel B: Summary Statistics of Cash Holdings by Acquirer’s Industry
Industry SIC code Cash/Sales M/B CFO/Sales CFO
Var./Sales
Mining 10-14 0.098 1.595 0.240 0.087
Construction 15-17 0.051 1.340 0.200 0.021
Manufacturing 20-39 0.086 2.260 0.097 0.031
Transportation & Public Utilities 40-49 0.015 2.055 0.154 0.019
Wholesale Trade 50-51 0.009 1.850 0.018 0.011
Retail Trade 52-59 0.027 2.110 0.052 0.016
19
Table 3 shows the distribution of the sample over time and the method of payment, by differentiating the structure of the bids. This table is included in order to see the evolution within the sample of the weight of cash bids throughout time. The percentage of cash bids ranges from a low of 18% in 1992 to a high of 61% in 2012. It’s possible to perceive that all cash payment method has increased significantly across time and the high peaks correspond to a post-crisis period (2010-2012).
Table 3: Summary Statistics of the sample of Bids
The table presents summary statistics for the sample of bids. The classification Cash Bid takes the value one if the acquisition is paid 100%, and 0 otherwise. Similarly, Stock bids take the value one if the acquisition is paid 100% by equity components and zero otherwise. B Mixed bids assume the value one if both equity and cash are used. Information about the components of the bid (Cash and Stock) are obtained from Securities Data Company (SDC) Platinum database.
Year Cash Bids Stock Bids Mixed Bids Total Bids % Cash
1990 3 2 6 11 27.27 1991 13 26 27 66 19.70 1992 9 20 21 50 18.00 1993 17 22 23 62 27.42 1994 36 48 42 126 28.57 1995 49 65 42 156 31.41 1996 40 57 69 166 24.10 1997 61 85 76 222 27.48 1998 68 103 94 265 25.66 1999 88 103 80 271 32.47 2000 84 112 77 273 30.77 2001 61 73 69 203 30.05 2002 68 35 46 149 45.64 2003 44 42 51 137 32.12 2004 64 29 47 140 45.71 2005 67 25 58 150 44.67 2006 87 25 42 154 56.49 2007 82 17 58 157 52.23 2008 60 19 35 114 52.63 2009 42 26 38 106 39.62 2010 66 24 21 111 59.46 2011 41 12 26 79 51.90 2012 55 12 23 90 61.11 2013 39 11 22 72 54.17 2014 41 20 24 85 48.24 2015 44 17 39 100 44.00 Total 1,329 1,030 1,156 3,515 37.81
The Importance of Cash Holdings for Acquiring Companies in Mergers and Acquisitions.
20
5. Empirical results
5.1 . Does Excess cash predict future acquisitions?
The first stage of statistical analysis involves estimating the model to detect presence of excess cash, by establishing normal firm-year cash holdings. The standard empirical models of cash holdings (Harford (1999), Opler et al. (1999) and Deangelo et al. (2010)) identify main common determinants of cash holdings prediction. In turn, excess cash holdings are determined by the difference between the actual and normal levels of cash21.
Table 4 presents the results of the model used for estimating cash holdings. Among the variables affecting cash holdings that are mentioned in literature, I find Market-to-Book ratio, firm’s operational cash flow volatility, and Size to be statistically significant.
The results are consistent with Opler et al. (1999), Harford (1999) and Pinkowitz et al. (2013): these authors also find a positive and statistically significant effect of market-to-book and volatility of cash flows22 on cash holdings, even after controlling for
the level of operating cash flows. Additionally, Size has a negative significant coefficient, meaning that this variable is negatively related with cash reserves, which is also documented in previous studies regarding cash holdings.
The model used allows for active cash management on the part of the firm, through the inclusion of operating cash flow lead variables. For example, if the firm anticipates that cash flow in year t+2 will fall short of that required for planned investment, cash reserves will likely increase over years’ t and t+1. Accordingly, in recession periods, firms are likely to decrease their cash reserves to substitute for lower cash flows. In presented results, the coefficient for these lead variables aren’t significant, which leads to the conclusion that cash management doesn’t affect the normal levels of cash.
21As explained previously in section section 3.1.
21
Overall, the results remain similar to the main literature, suggesting that small firms, firms with higher levels of market-to-book and riskier cash flows hold larger amounts of cash(consistent with Harford (1999), Opler et al. (1999), Ozkhan and Ozkhan (2004), Deangelo et al. (2010) and Pinkowitz et al. (2013)). This means that the model does a reasonably good job for controlling these documented firm empirical relations that influence normal cash reserves.
Table 4: Measure of Cash holdings
The table presents the results from the estimation of the cash model presented in equation (1). The dependent variable is the firm-year Cash to Sales ratio. To control for Country and industry-related time-invariant characteristics, the model contains industry, country and year dummy variables. Presented in parentheses are heteroskedasticity robust t-statistics with standard errors clustered by year and country level. All variables are defined in Appendix A. ***Significant at the 1% level, **Significant at the 5% level, *Significant at the 10% level.
VARIABLES Cash/Sales 𝑁𝑒𝑡𝐶𝐹𝑂/𝑆𝑎𝑙𝑒𝑠 𝑁𝑒𝑡𝐶𝐹𝑂/𝑆𝑎𝑙𝑒𝑠𝑡+1 𝑁𝑒𝑡𝐶𝐹𝑂/𝑆𝑎𝑙𝑒𝑠𝑡+2 𝑀/𝐵𝑡−1 𝐶𝐹𝑂𝑉𝑎𝑟 𝑆𝑖𝑧𝑒𝑡+1 Constant -0.0015 (-0.94) -0.0015 (-1.43) -0.0016 (-1.49) 0.0009*** (2.69) 0.0001*** (5.44) -0.0650*** (-14.04) 0.4799*** (6.96) Observations 15,094 R-squared 0.148
In table 5, I divided my sample into two different groups (rich and non cash-rich) of firms, according to the definition presented by Harford (1999): firm’s with actual cash holdings deviating more than 1.5 standard deviations above the value predicted by the previous model, measured in t-1. The standard deviation used is the time series standard deviation of the firm’s cash holdings. This definition is considered, even by the
The Importance of Cash Holdings for Acquiring Companies in Mergers and Acquisitions.
22
author, rather “extreme”, in the sense that it requires a large deviation from the predicted level of cash to classify a firm as cash-rich. Consequently, this definition produces a smaller number of cash-rich observations and makes it difficult for a given firm to continue to meet this definition. Hence, I apply this measure for robustness purposes throughout the several tests of the formulated hypotheses, as so to investigate if the tests performed are also robust for extreme cash-holders.
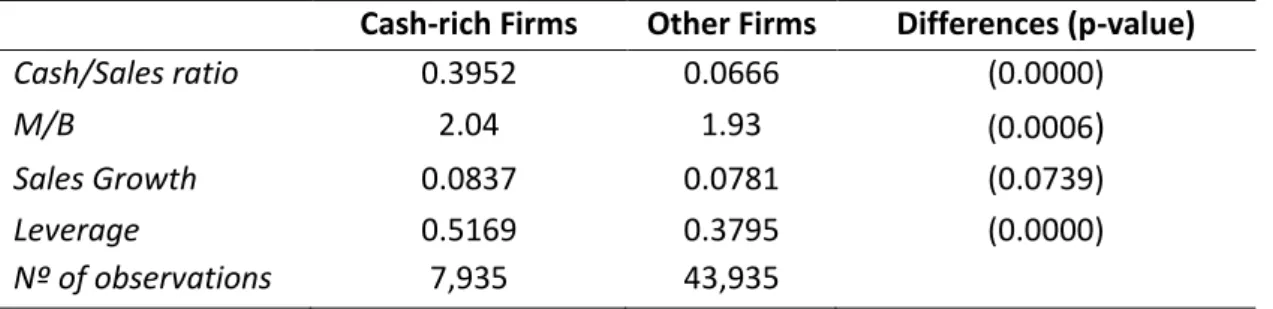
The table presents summary statistics for firms identified as cash-rich (7,935 firm years) and compares them to the rest of the sample (43,975 firm years). The results show that, by this definition, cash-rich firms have statistically significant different values from the rest of the population regarding not only cash to sales ratio but also market-to-book, sales growth and leverage. Cash to Sales ratio is about five times greater for cash-rich firms compared to the rest of the sample24. Market-to-book and sales growth
are economically similar, but nonetheless statistically different and greater for cash-rich firms. As for leverage ratio, there is a substantial difference between the two populations of about 13% (51.69% to 37.95%). This result is opposite to Harford (1999) and consistent with Pinkowitz et al.(2013), and might be explained by the argument that cash-rich firms have more leverage so that when their cash position is considered net-of-debt, they are actually similar to other firms.
Table 5 – Summary Statistics for cash-rich Firms
The table presents the median cash to sales ratio, Market-to-Book, sales growth and leverage ratio of cash-rich firm-years and all other firm-firm-years between 1980 to 2015. Firms are here considered as cash-rich firms if their cash reserves deviate by more than 1.5 standard deviations from the cash reserves predicted by the cash management model from equation (1), (Harford,1999). I present the p-values for the tests of medians (Wilcoxon rank-sum test). All variables are defined in Appendix A.
Cash-rich Firms Other Firms Differences (p-value)
Cash/Sales ratio 0.3952 0.0666 (0.0000) M/B 2.04 1.93 (0.0006) Sales Growth 0.0837 0.0781 (0.0739) Leverage 0.5169 0.3795 (0.0000) Nº of observations 7,935 43,935
23
To analyze whether firms with excess cash are more likely to make an acquisition in the next period, I estimate the probit model presented in section 3.2, equation (2). The dependent variable is the dummy Bidder that assumes the value one when the firm announces an acquisition and zero otherwise. The model uses as excess cash measure the actual deviation of cash to sales ratio from the predicted in the normal cash model. The period of consideration is t-1, which is the period prior to the acquisition announcement.
Consistent with the first hypothesis, the results of the model reveal that there is a significant positive relation between higher level of cash holdings and the probability of becoming a bidder. The marginal effect associated to CashDev., implies that, on average, when the amount of cash deviation goes up by one unit it causes an increase in the probability of attempting an acquisition of, approximately, 2.84 percentage points, ceteris paribus. This finding is consistent with the free cash flow hypotheses, as documented by Opler et al. (1999) and Harford (1999), that stated that cash reserves and subsequent acquisition spending are positively correlated.
Oppositely, when analyzing the same model using Harford (1999) definition of rich firm-year, the results do not illustrate any significant relation between cash-rich firm-years and the likelihood of becoming a bidder in the following period. As referred previously, the explanation to this loss of significance might be related to the highly-restricted definition of cash-rich firms. Another interesting conclusion is that for both specifications larger firms and with higher sales growth are more likely to become bidders, at 5% significance level.
Overall, the results provided indicate that the likelihood of making an acquisition in the next period is increasing with cash-richness, despite lack of evidence for extreme cash-holders. These results don’t illustrate, however, if excess cash is related to investment decisions that benefit or harm shareholder’s wealth. Consequently, whether these bids are value increasing or decreasing cannot be determined without tests that measure the valuation consequences of the bidding decision. For these purposes, the next section examines the market reaction to the bids to evaluate these acquisition decisions, and the post-merger operating performance.
The Importance of Cash Holdings for Acquiring Companies in Mergers and Acquisitions.
24
Table 6 – Probit model for predicting Bidders
This table presents the results of a probit model (correspondent to equation (2)) of the M&A decision in a given year. The result of two probits are presented here. The dependent variable is the dummy Bidder that assumes the value one when the firm announces an acquisition and zero otherwise. The measure of excess cash used is represented by the variable Cashdev, as identified in equation (2); The model incorporates year, country and industry dummy variables. Presented in parentheses are heteroskedasticity robust z-statistics with standard errors clustered by year and country level. All variables are defined in Appendix A. ***Significant at the 1% level, **Significant at the 5% level, *Significant at the 10% level.
VARIABLES Bidder=1 𝐶𝑎𝑠ℎ𝑑𝑒𝑣.𝑡−1 0.0284*** (3.82) 𝑁𝑜𝑛𝐶𝑎𝑠ℎ𝑊𝐶𝑡−1 -0.0027 (-0.14) 𝑆𝑎𝑙𝑒𝑠𝐺𝑟𝑜𝑤𝑡ℎ𝑡−1 0.0353** (2.34) 𝑀/𝐵𝑡−1 -0.0004 (-0.45) 𝑃𝐸𝑅𝑡−1 0.0015 (0.42) 𝐿𝑒𝑣𝑒𝑟𝑎𝑔𝑒𝑡−1 -0.0002 (-0.15) 𝑆𝑖𝑧𝑒𝑡−1 0.0198*** (11.05) Observations R-squared 11,129 0.0649
5.2 Bidder’s announcement returns and post-operating performance 5.2.1 Cumulative abnormal announcement returns
After finding the relation between cash stockpiling and acquisition behavior, the subsequent hypotheses analyze the valuation impact and the post-operating performance of the acquisitions.
Cumulative Abnormal Returns (CARs) are commonly used as a measure of the market’s assessment of M&A deals, as they represent the investors’ reaction to the deal announcement. Although the market assessment is relative, rather than absolute, one
25
should find a positive/ negative reaction to announcements of value-increasing/decreasing acquisitions, especially in deals that are less anticipated.
Table 7 reports the Cumulative Abnormal Return analysis results. Panel A presents the mean CARs surrounding the announcement day. The immediate announcement effect of M&As is negative and statistically different from zero, for all estimation windows. These statistically significant and abnormally negative market reactions reveal that investors view these corporate events as value destroying from the perspective of the bidders’ shareholders25. The mean CAR for a 3-day event window is
of -0.77%, for a 7-day26 event window is -0.82%, for a 11-day event window is -1.05%
and – 1.77% for a 21-day event window.
This short-term market reaction to acquisitions leave little room for divergence. However, it is also clear that this negative market reaction is undifferentiated between cash-rich bidders and the rest of the firms. Through the univariate tests of differences in means and medians , the results don’t illustrate any association between excess cash and stock market reaction to the investment announcement. Panel B presents a multivariate analysis, being the dependent variable the mean bidder’s CARs for the various event windows up to 21 days surrounding the event. The results show that even controlling for several firm and deal-level characteristics, there seems to be no robust relation between increasing excess cash and bidder short-term stock market returns. However, for a 10-day event window (model (3)) there is a negative coefficient for Cash deviation, significant at a 10% level, indicating that there is evidence that implies that when the deviation from the normal level of cash deviates by one unit, Cumulative Abnormal Returns decrease, on average, 1.59%, ceteris paribus. Despite this conclusion, I cannot infer about the actual link between stock markets reaction and cash-rich successful M&As, thus the second hypothesis is rejected.
25The effect for the bidders’ shareholders is the subject of interest in this dissertation, although the combined effect might be positive.
26 From 5 days prior to the announcement day to 1 day succeeding the event. The inclusion of this event-window is based on Harford (1999).
The Importance of Cash Holdings for Acquiring Companies in Mergers and Acquisitions.
26
Table 7 – Market Reaction to Cash Stockpiling
The Table presents, in panel A, mean cumulative abnormal returns around the event date for the full sample and subsamples, considering four event windows. Firms are here considered as cash-rich firms if their cash reserves deviate by more than 1.5 standard deviations from the cash reserves predicted by the cash management model from equation (1), (Harford,1999). The estimation window is of 231 days (-250 to -20). To test if the mean CARs are statistically different between the two groups of firms I perform a t-test, for which I present the differences obtained, in absolute terms and the p-values. Panel B shows the result of the estimation of equation (3), where the dependent variables match the average bidders’ Cumulative Abnormal Returns for four different event-windows. All regressions incorporate year, country and industry dummy variables. All variables are defined in Appendix A. ***Significant at the 1% level, **Significant at the 5% level, *Significant at the 10% level.
Panel A: Cumulative Abnormal Returns - univariate analysis
Event-window Total Sample Differences in means
|𝐜𝐚𝐬𝐡𝐫𝐢𝐜𝐡 𝐅𝐢𝐫𝐦𝐬 − 𝐎𝐭𝐡𝐞𝐫 𝐅𝐢𝐫𝐦𝐬| Differences in means (p-value) [-1;1] -0.0077*** 0.0030 0.0200 -0.0106 -0.0264* (0.3211) [-5;1] -0.0082* (0.1004) [-5;5] -0.0105* (0.1946) [-10;10] -0.0177* (0.0088)
Panel B: Cumulative Abnormal Returns regression
VARIABLES (1) CAR [-1;1] (2) CAR [-5;1] (3) CAR [-5;5] (4) CAR [-10;10] 𝐶𝑎𝑠ℎ𝑑𝑒𝑣.𝑡−1 -0.0018 (-0.33) -0.0022 (-0.22) -0.0159* (-1.73) -0.0098 (-0.71) 𝐿𝑒𝑣𝑒𝑟𝑎𝑔𝑒𝑡−1 0.0002 (0.07) 0.0005 (0.07) -0.0000 (-1.13) -0.0001 (0.93) 𝑀/𝐵𝑡−1 0.0027* (1.78) 0.0024 (1.45) 0.0003 (0.19) 0.0004 (0.22) 𝑃𝑎𝑖𝑑 𝑖𝑛𝐶𝑎𝑠ℎ -0.0487* (-1.88) 0.0155** (2.55) 0.0143** (2.14) 0.0185** (2.17) 𝐶𝑟𝑜𝑠𝑠𝑏𝑜𝑟𝑑𝑒𝑟 -0.0021 (-0.46) 0.0005 (0.07) 0.0041 (0.44) 0.0173* (1.65) 𝑆𝑖𝑧𝑒𝑡−1 -0.0026 (-1.25) -0.0053** (-2.41) -0.0024 (-1.06) -0.0049* (-1.93) 𝑅𝑒𝑙𝑎𝑡𝑖𝑣𝑒𝑆𝑖𝑧𝑒 -10.0487* (-1.88) -9.7847* (-1.82) -7.5086 (-1.33) -2.8129 (-0.41) Constant 0.0169 (0.61) 0.0431 (1.23) 0.0522 (1.26) 0.0556 (1.14) Observations 1,016 1,016 1,017 1,017 R-squared 0.120 0.081 0.068 0.061
27
The lack of results in this section is not particularly surprising, given the complexity of the unknowns underlying investor’s perception and the fact that I am only considering successful events, which means that the successful cash-rich bidder M&As do not observe the same negative market reaction reported by previous literature. Other explanations for this might be related to the fact that studies such as Opler et al. (1999), Harford (1999) and Décamps et al. (2011), that find significant negative relationship, are conducted for US bidders only, and don’t consider a long-time period as the one used in this dissertation. Despite the control variables used for time, country and industry of acquirer’s, this sample differentiation from previous studies might explain part of the lack of results.
5.2.2 Post-M&A Operating Performance
Additional to the announcement returns evaluation, I also perform an operating performance analysis, including periods of pre and post successful acquisitions.
By applying a similar method, I use as measure of operating performance the cash-flow return-on-assets. Barber and Lyon (1996) show that when studying operating performance, it is important in designing tests to control for abnormal firm characteristics prior to the event. They demonstrate that tests can lead to incorrect inferences if the sample of firms being studied had abnormal operating performance prior to the event. In order to capture this effect, the regressions contain pre-acquisition operating performance calculated for periods t-4 to t-1.
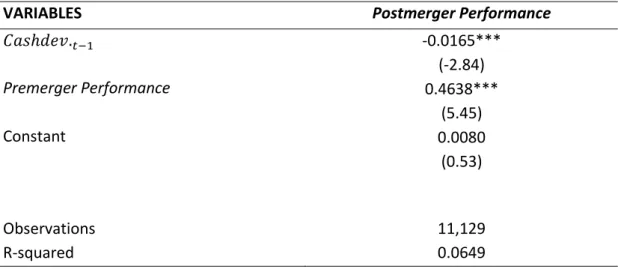
Table 8 presents the results of the regression for the bidders’ operating performance following successful Mergers and Acquisitions. The results show that increasing excess cash is negatively related to the abnormal operating performance following the event (at the 1% level). The marginal effect associated to CashDev., implies that, on average, when the amount of cash deviation goes up by one unit it causes a decrease of the post-merger operating performance by, approximately, 1.65 percentage points, ceteris paribus. Once again, I do not observe significant results using the extreme cash-rich firm-year definition suggested by Harford (1999).
The Importance of Cash Holdings for Acquiring Companies in Mergers and Acquisitions.
28 These results suggest that from an operating performance point of view, cash-rich bidders tend to undertake poor investment decisions, although the same inference is not found in extreme cash-holders. Relating these results with the ones found in announcement returns, investor’s do not incorporate this expectation in firms’ stock prices, as the announcement returns are followed by unknowns. From this perspective, investors aren’t able to recognize future operating declines for cash-rich bidder acquisitions.
Table 8 – Operating performance
This table shows the results of a regression test of the effects of a merger on operating performance for bidders. Premerger performance is the firm’s cash flow return-on-assets, averaged from the year t-4 to t-1. The dependent variable is Postmerger performance, calculated also as the bidders’ cash flow return-on-assets, averaged from t+1 to
t+4. Both models incorporate year, country and industry dummy variables. Presented in parentheses are
heteroskedasticity robust t-statistics with standard errors clustered by year and country level. All variables are defined in Appendix A. ***Significant at the 1% level, **Significant at the 5% level, *Significant at the 10% level.
VARIABLES Postmerger Performance
𝐶𝑎𝑠ℎ𝑑𝑒𝑣.𝑡−1 Premerger Performance Constant -0.0165*** (-2.84) 0.4638*** (5.45) 0.0080 (0.53) Observations R-squared 11,129 0.0649
5.3 Payment Method decision
In order to further investigate the importance of cash holdings prior to M&A announcements, it is also interesting to investigate whether this excess cash is used as payment method for these investments. As seen in previous results, excess cash is strongly related to subsequent investing. Consequently, one should find reasonable to speculate that this excess cash is used for financing these investment decisions.