Lund Institute of Technology
Department of Pure and Applied Biochemistry
Universidade da Beira Interior
Chemistry Department
NANOPARTICLES AS A TOOL
IN
CAPILLARY ELECTROCHROMATOGRAPHY
Susana Ribeiro, 820516‐P001/M1232
Covilhã, 2009Supervised by:
The thesis under the title:
NANOPARTICLES AS A TOOL IN CAPILLARY ELECTROPHORESIS Was elaborated by:
Susana Ribeiro M1232
Master student of Biochemistry in Universidade da Beira Interior.
With basis on the work developed within the period 2008/09-2009/07 at Lund University, Lund Institute of Technology, Department of Pure and Applied Biochemistry, where temporarily got the identification number 820516-P001.
Under the supervising of:
Prof. Staffan Nilsson, professor at Lund University, Lund Institute of Technology, Department of Pure and Applied Biochemistry;
Prof. Cândida Tomaz, professor at Universidade da Beira Interior, Health Sciences Research Center.
Presented at the Department of Health Sciences, Universidade da Beira Interior, at 16h30min on the 7th of September, 2009, with the purpose of reaching the master diploma degree.
Acknowledgements
First I would like to express my gratitude to my supervisor in Lund, Professor Staffan Nilsson, for all the support and scientific guidance during my project and for the possibility of meeting strong names in the scientific community.
I would also like to thank to my supervisor in Portugal, Professor Cândida Tomaz for the support and advices.
Moreover I would like to thank everybody from Pure and Applied Biochemistry Department, in particular:
To my group, Sandra, Yu Yang, Magnus, Arthur, Loy, Cedric and Christian I would like to thank the friendship and the support and all the good moments at lunch time.
To Christian Nilsson, my good friend and CE colleague, my sincere gratitude. It was a pleasure to work next to a person with enormous knowledge and heart.
Keiichi Yoshimatsu and Martin Berg for the MIP nanoparticles and for the nice discussions about molecular imprinting.
Thanks to Helge from BMC for the silanized gadolinium oxide nanoparticles and for the coffees and good conversation.
I’m very grateful to all my fiends outside department in particular:
My flat mates, Dagmar, Konni, David, Sandra, Jorge, Steffano, Clemence, Hero, Mariano,
My special thanks to my parents for the love and support.
Universidade da Beira Inteiror, Lund University, Agência Nacional para a Gestäo do Programa de Aprendizagem ao Longo da Vida and the European commission are gratefully acknoledged for enabling this project.
Abstract
Two different types of molecularly imprinted nanoparticles against (R)-propranolol were used to separate the enantiomers of propranolol in capillary electrochromatography mode, methacrylic acid based nanoparticles and core-shell molecularly imprinted polymer nanoparticles. Partial filling technique was used to avoid interference of molecularly imprinted polymer nanoparticles in UV detection.
With methacrylic acid based nanoparticles it was not possible to obtain enantiomer separation. Strong unspecific interactions between the molecular imprinted polymer nanoparticles and propranolol disturbed enantiomer separation. Since large content of acetonitrile had to be used in order to obtain stable suspensions of molecularly imprinted polymer nanoparticles, the electrostatic interactions were favored which contributed to the unspecific interactions occurring.
Core-shell molecularly imprinted polymer nanoparticles present suspension stability at low content of acetonitrile due to the poly(acrylamide) shell that makes them more hydrophilic. Enantiomer separation of propranolol was achieved with 40% of acetonitrile. Reproducibility was problematic due to the unspecific interactions occurring. With time several factors can occur contributing to the decreased reproducibility of results such as, interactions between the molecularly imprinted polymer nanoparticles and the capillary wall or evaporation of the organic solvent due to the design of vials used in capillary electrochromatography system.
The core-shell molecularly imprinted polymer nanoparticles are more suitable for propranolol enantiomer separation in comparison to methacrylic acid based nanoparticles. More stable suspensions give a greater range of conditions that can be tested.
Silanized gadolinium oxide nanoparticles were tested as pseudostationary phase in capillary electrochromatography for protein separation. The lack of interference with UV detection and the large surface area of these nanoparticles make them a promising tool in capillary electrochromatography for protein separation. These nanoparticles interact with the proteins that are analyzed. Increased injection times of the nanoparticles give retained
peaks of human growth hormone showing that strong interactions between the protein and nanoparticles are occurring.
Lysozyme that was not recovered using conventional capillary electrophoresis could be detected when nanoparticles were used as pseudostationary phase. The nanoparticles can act as a coating in the capillary wall or due to their large surface area they can prevent adsorption of the lysozyme to the capillary.
Resumo
Dois tipos diferentes de nanopartículas impressas molecularmente, selectivas de (R) – propranolol, foram utilizadas para a separação dos enantiomeros de propranolol em electrocromatografia capilar ( nanopartículas à base de ácido metacrílico e nanopartículas revestidas com poliacrilamida). Para evitar interferência das nanopartículas com a detecção UV a técnica de preenchimento parcial foi utilizada.
Com as nanopartículas à base de ácido metacrílico a separação dos enantiomeros de propranolol não foi alcançada. Interacções fortes inespecíficas entre as nanopartículas e o propronolol impossibilitaram a separação. Para obter suspensões estáveis de nanopartículas à base de ácido metacrílico elevadas quantidades de acetonitrilo foram utilizadas, favorecendo interacções eletrostáticas que contribuiram para o aumento das interacções inespecíficas.
As nanopartículas revestidas com poliacrilamida apresentam suspensões estáveis com baixas quantidades de acetonitrilo, devido as propriedades hidrofílicas da poliacrilamida. A separação dos enantiomeros de propranolol foi alcançada com 40% de acetonitrilo. As interacções inespecíficas foram um factor dominante na irreproducibilidade dos resultados. Com o tempo vários factores contribuem para a diminuição da reproducibilidade dos resultados como por exemplo: interacções entre as nanopartículas e a parede do capilar e a evaporação do solvente orgânico devido ao design dos tubos de ensaio utilizados na electrocromatografia capilar.
As nanopartículas revestidas com poliacrilamida säo mais adequadas para a separação dos enantiomeros de propranolol devido á elevada estabilidade de suspensöes apresentada em diferentes condições.
Nanopartículas de gadolínio silanizadas foram testadas como fase pseudoestacionária em electrocromatografia capilar. Características como a não detecção em UV e a grande área de superfície tornam estas nanopartículas de grande interesse para a separação de proteínas. A hormona de crescimento e a lisozima foram as proteínas analisadas.
A hormona de crescimento apresenta picos mais retidos quando se aumenta os tempos de injecção das nanopartículas, mostrando que interacções entre a proteína e as nanopartículas ocorrem.
A utilização destas nanopartículas como fase pseudoestacionária permitiu a detecção da lisozima que não é visível utilizando electroforese capilar convencional. A adsorção da lisozima à parede do capilar é evitada devido ao uso destas nanopartículas.
Abbreviations
AIBN Azobisisobutyronitrile ACN Acetonitrile
CE Capillary Electrophoresis
CEC Capillary Electrochromatography CGE Capillary Gel Electrophoresis CIEF Capillary Isoelectric Focusing CZE Capillary Zone Electrophoresis EOF Electroosmotic Flow
hGH Human Growth Hormone MAA Methacrylic acid
MBA N,N’-methylene-bis-acrylamide MES 2-(N-morpholino)ethanesulfonic acid MIP Molecularly Imprinted Polymer PSP Pseudostationary phase
PSP-CEC Pseudostationary phase capillary electrochromatography TRIM Trimethylolpropane trimethacrylate
Keywords
Nanoparticles Miniaturization Capillary Electrophoresis Capillary Electrochromatography Pseudostationary phaseContents
I Acknowledgements……… i II Abstract………. iii III Resumo……… v IV Abbreviations……….. vii V Keywords………. viii VI Contents……….. ix Introduction 1. Capillary Electrophoresis………. 11.1 Principles of Capillary Electrophoresis………... 1
1.1.1 Electrophoretic Mobility……….. 1
1.1.2 Electroosmotic Flow……… 2
1.1.3 Resolution……… 5
1.1.4 Dispersion……… 5
1.2 Instrumental aspects of Capillary Electrophoresis……….. 6
1.2.1 Capillary……….. 7 1.2.2 Sample injection……….. 7 1.2.2.1 Hydrodynamic injection……….. 8 1.2.2.2 Electrokinetic injection………... 10 1.2.3 Detectors………. 11 1.2.3.1 UV-Visible absorption……… 12 1.2.3.2 Fluorescence………... 13 1.2.3.3 Indirect detection……… 13 1.2.3.4 Electrochemical……….. 14 1.2.3.5 Mass Spectrometry………. 14 1.3 Modes of operation………. 15
1.3.1 Capillary zone electrophoresis……… 15
1.3.3 Capillary isotachophoresis……… 16
1.3.4 Capillary gel electrophoresis……….... 17
1.3.5 Micellar electrokinetic chromatography………... 18
1.3.6 Capillary electrochromatography……….. 19
1.3.6.1 Packed capillaries……… 20
1.3.6.2 Monolith capillaries………. 20
1.3.6.3 Open tubular capillaries………... 21
1.3.6.4 Particles as pseudostationary phase………. 21
1.3.6.4.1 Partial filling technique……….. 24
1.3.6.4.2 Continuous filling technique …………. 25
1.4 Molecular Imprinting………. 26
1.5 Molecular Imprinting formats for capillary electrochromatography…………. 28
1.5.1 MIPs for open tubular CEC………... 28
1.5.2 MIP packed capillaries……….. 29
1.5.3 Monolith MIPs in CEC………. 29
1.5.4 MIP nanoparticles………. 30
2. Material and Methods……… 31
2.1 Chemicals……….. 31
2.2 Preparation of nanoparticles……….. 32
2.2.1 MIP nanoparticles……….. 32
2.2.1.1 Methacrylic acid based nanoparticles……….. 32
2.2.1.2 Core-shell MIP nanoparticles……….. 32
2.2.2 Silanized gadolinium oxide nanoparticles………. 33
3. Results and Discussion………. 35 3.1 MIP based CEC enantiomer separation……… 35
3.1.1 Methacrylic acid based nanoparticles………... 36 3.1.1.1 Suspension stability in different electrolytes compositions 3.1.1.2 CEC enantiomer separation of rac-propranolol
3.1.2 Core shell MIP nanoparticles……… 41 3.1.2.1 Suspension stability in different electrolytes compositions 3.1.2.2 CEC enantiomer separation of rac-propranolol
3.1.2.2.1 Electrolyte composed of MES buffer pH 6,5 3.1.2.2.2 Electrolyte composed of MES buffer pH 7 3.2 Silica-coated gadolinium nanoparticles for protein separation... 57 4. Conclusions and future outlook……… 65 5. References………. 66
Introduction
1. Capillary Electrophoresis
Capillary electrophoresis (CE) is a separation technique that combines the principles of electromigration mechanisms with the instrumentation and automation concepts of chromatography.1 One of the greatest advantages is its diverse application range. CE is an attractive separation method because of its low sample and electrolyte consumption, short analysis time, high efficiency, ease of operation and automation compared with classical gel electrophoresis.2
1.1 Principles of Capillary Electrophoresis
1.1.1 Electrophoretic Mobility
Separation by electrophoresis is based on differences in solute velocity in an electric field.1 The migration velocity v of an ion (Equation 1) is equal to the product of the field strength E (Vcm-1) and the electrophoretic mobility µe (cm2V-1s-1).
v=µe E (Equation 1)
The electric field strength is a function of the applied voltage divided by the total capillary length. Ions can be separated when their charge-to-size rate (q/rs) corresponds to
different electrophoretic mobility values.
The electrophoretic mobility depends on the temperature and on the composition of the electrolyte solution.3
1.1.2 Electroosmotic Flow
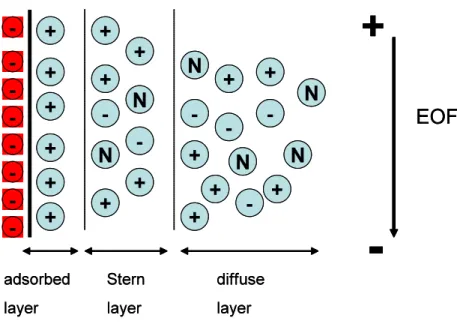
A fundamental component of CE operation is the EOF. This phenomenon is a consequence of the motion of an electrolyte solution under the influence of an electric field that results from the charge imbalance at a solid-liquid interface (Figure 1). Typically used for separations in CE a fused-silica capillary column is negatively charged in contact with an electrolyte solution with a pH>2-3, due to the ionization of the surface silanol groups (Si-OH).4
Buffer cations build up near the surface to maintain charge balance, form the double-layer and create a potential difference next to the wall. This is known as the zeta potential. Some of these cations are firmly held to the region of the double-layer next to the capillary wall (the compact or Stern layer). The thickness of the electrical double-layer is small, typically 10nm.1, 5
Figure 1-Representation of the double layer at the surface of the inner wall of fused-silica capillary column.
When an electric field is applied across the capillary the cations in the diffuse outer layer of the double-layer will be attracted toward the cathode and drag the bulk solvent along with them. Even though analytes migrate according to their charges within the capillary, the EOF is sufficient to sweep all positive, neutral and even negative species toward the same end of the capillary.3
A unique feature of EOF in the capillary is the flat profile of the flow (Figure 2). Since the driving force of the flow is uniformly distributed along the capillary there is no pressure drop within the capillary, and the flow is nearly uniform throughout.1
Figure 2- Flow profile.
The electroosmotic flow can be expressed in terms of velocity or mobility by the equations (2) and (3): (Equation 2) (Equation 3) Where velocity EOF mobility zeta potencial dielectric constant
The EOF often needs to be controlled and altered. There are several methods to accomplish this, as detailed in Table 1.1
Table 1-Methods to control electroosmotic flow.
Variable Result Advantages/Disavantages
Electric field Changes rate of EOF When lowered, efficiency and resolution may decrease Joule heating may result when increased
Buffer pH EOF increase at high pH EOF decrease at low pH
Can effect the solute charge and mobility
Ionic strength High ionic strength decreases EOF
Low ionic strength increases EOF
High ionic strength generates high current an possible Joule heating
Low ionic strength problematic for sample adsorption
Temperature Changes viscosity Useful since temperature is controlled instrumentally Organic
Modifier
Changes zeta potential and viscosity
Usually decreases EOF May alter selectivity Surfactant Adsorbs to capillary wall via
hydrophobic and/or ionic interactions
Anionic surfactants can increase EOF
Cationic surfactant can decrease EOF
Neutral hydrophilic
polymer
Adsorbs to capillary wall via hydrophobic interactions
Decreases EOF by shielding surface charge and increasing viscosity
Covalent coating
Chemical bonding to capillary wall Many modifications possible (hydrophilicity or charge) Stability often problematic
1.1.3 Resolution
Resolution in CE is the same as that for chromatography and is simply defined as:
(Equation 4)
Where t = migration time
w = baseline peak width (in time) σ = peak standard deviation 1 and 2 refer to the two solutes
The equation 4 describes the separation in terms of differential migration and the dispersive processes acting against it.1, 3
1.1.4 Dispersion
The uniformity of the flow profile (Figure 2) is of great importance in capillary electrophoresis to obtained high separations efficiencies. It is important to control dispersion because it can increase zone length and the mobility difference necessary to achieve separation. Dispersion effects due to flow non-uniformity are absent in capillary electrophoresis, so the separation efficiency is determinate only by longitudinal diffusion and can be expressed by the following equation1, 3:
(Equation 5) Where N=theoretical plates
The equation 5 shows that it is preferable to apply high fields because the solute will spend less time in the capillary and has less time to diffuse.
From an electropherogram it is possible to determinate directly the theoretical plate number using (Equation 6) 1, 3:
(Equation 6) Where t=migration time of the analyte
w1/2= temporal peak width at half height
1.2 Instrumental aspects
One key feature of CE is the overall simplicity of the instrumentation (Figure 3). The ends of the capillary are placed in separated reservoirs, each containing an electrode used to make electrical contact between the high voltage power supply and capillary. The sample is injected onto the capillary by replacing one of the buffer reservoirs (normally at the anode) with a sample reservoir and applying either an electric potential or external pressure for a few seconds.4
The separation is performed when an electric potential is applied across the capillary. Optical detection of the separated analytes can be achieved directly through the capillary wall near the opposite end (normally near the cathode).1
1.2.1 Capillary
The capillary material should ideally fulfill requirements like being chemical and electrical inert, UV-visible transparent, flexible, robust and inexpensive. For this reason fused silica material is the most employed in capillary electrophoresis. A detector window is prepared easily by removing the polyimide coating to leave a transparent section of about 1-2 mm long at a fixed distance from the column outlet. The capillary ends should be cut square and free of debris since misshapen capillaries ends can result in distorted peak shapes and poor quantitative precision.3
Fused silica-capillaries with internal diameters ranging from 25-75 µm with a range of outer diameters between 350-400 µm are usually used in CE. From an analysis time perspective, capillaries as short as possible should be used. Most commonly effective lengths between 50-75 cm are employed.4
1.2.2 Sample injection
The total capillary volume is in the microliter range, as a result of the small dimensions of the capillary. Adhering to the chromatography rule of thumb, the sample plug length should be less than 1 to 2% of the total length of the capillary.1
Quantitative sample injection can be accomplished by a number of methods. The two most common are hydrodynamic and electrokinetic. In either case, the sample volume loaded is generally not a known quantity, although it can be calculated. Instead of volume, the quantifiable parameters are pressure/time for hydrodynamic injection, or voltage/time for electrokinetic injection.3
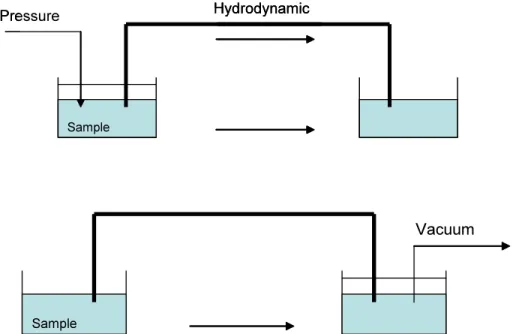
1.2.2.1 Hydrodynamic injection
Hydrodynamic injection can be accomplished by application of pressure at the injection end of the capillary, vacuum at the exit end of the capillary (Figure 4), or by siphoning action obtained by elevating the injection reservoir relative to the exit reservoir (Figure 5).3
The volume injected, V, can be calculated using the Hagen-Poiseuille equation (7):
(Equation 7)
Where pressure difference across the capillary capillary inside diameter
time
buffer viscosity total capillary length
For siphoning injection, the pressure differential for use in last equation is given by equation 8:
(Equation 8) Where buffer viscosity
gravitational constant
height differential of the reservoirs
A typical siphoning injection is obtained by raising the sample reservoir 5 to 10 cm relative to the exit reservoir for 10 a 30 seconds, depending on the conditions. Siphoning is used in systems without pressure injection capabilities.1
Figure 4-Hydrodynamic injection.
1.2.2.2 Electrokinetic injection
Electrokinetic injection is performed by replacing the injection-end with the sample vial and applying the voltage (Figure 6). Sample enters the column by the combined effect of electroosmosis and electrophoresis. The quantity loaded is dependent on the electrophoretic mobility of the solutes and this result in discrimination with the more mobile sample components injected in greater quantities than the less mobile species.3 The quantity injected is dependent on the EOF, sample concentration, and sample mobility as described by the equation below:
(Equation 9)
Where electrophoretic mobility of the analyte EOF mobility
voltage
capillary radius analyte concentration time
capillary total length
Electrokinetic injection is normally employed for capillary electrochromatography (CEC) and capillary gel electrophoresis (CGE) and when hydrodynamic injection is ineffective.1
1.2.3 Detectors
Detection in CE is a challenge as a result of the small capillary dimensions and their associated constrained injection volumes. Almost all capillary electrophoresis instruments are fitted with a UV-visible absorption detector as standard due to its universal detection nature.4 Other detection modes (Table 2) are available with fluorescence and conductivity detectors and interfaces to mass spectrometry as possible options.3
Table 2-Methods of detection.
Detection Mode Mass detection limit
(moles) Concentration detection limit (molar) UV-visible 10-13-10-15 10-5-10-8 Fluorescence 10-15-10-11 10-7-10-9 Laser-induced fluorescence 10-18-10-20 10-14-10-16 Indirect 10-15-10-17 10-5-10-7 Amperometry 10-18-10-19 10-10-10-11 Conductivity 10-15-10-16 10-7-10-8 Potenciometry --- 10-7-10-8 Mass Spectrometry 10-16-10-17 10-8-10-9
1.2.3.1 UV-Visible detection
UV-visible absorption is the most used detection method as mentioned before. The high efficiency in CE is in part due to on-column detection. In this case a small section of the polyimide coating is removed from the exterior of the capillary by burning, dissolution or scraping. This section of the capillary serves as an optical window, which avoids zone broadening because of dead-volume or component mixing.3In fact separation is still occurring while in the detection window.
For adsorptive detectors the absorbance of a solute is dependent on the path length, concentration and molar absorptivity as defined in Beer´s law (Equation 10):
A=bCε (Equation 10)
So the sensitivity of the on-column detector is critical due to the short effective path length, which restricts detection limits in concentration terms resulting in a relatively weak adsorption signal.1
In order to improve the sensitivity of absorbance, several modifications of the detection cell have been suggested for increasing the path length of the measurements such as bubble cell, Z-cell and multireflection cell (Figure 7).4
1.2.3.2 Fluorescence
Fluorescence is the most sensitive detection technique for capillary electrophoresis and especially laser-induced fluorescence (LIF). Lasers have a number of advantages: the collimated beam is easily focused into a small volume; excitation power can be varied over a wide range; and the source is inherently monochromatic. On the other hand lasers are more expensive, have a shorter operating life, and provide only a limited selection of operating wavelengths, particularly in the low UV region. Another concern with fluorescence methods is that sample usually requires labeling.3, 4
1.2.3.3 Indirect Detection
To detect species with low molar absorptivities, indirect detection can be applied Detection is accomplished by placing an ionic chromophore in the electrophoresis buffer. The detector then receives a constant signal due to the presence of this substance. The analyte displaces some of these ions so that the detector signal decreases during the passage of the analyte band through the detector. The analyte is then determined from the decrease in absorbance.3, 4
1.2.3.4 Electrochemical
Electrochemical detection based in conductometry, amperometry or potentiometry is used to only a limited extent. Conductivity is a universal method for the detection of ions. Amperometry is a selective method for the detection of electroactive species by oxidation or reduction at an electrode surface. Potenciometry is a near –specific method for characteristic ions. One of the problems in separation is when high voltage is applied because it can lead to serious interference with the electrochemical signal. So isolation of the detector electrodes is required. This can be accomplished by inserting a porous glass or graphite joint between the end of the capillary and a second capillary containing the detector electrodes.3, 4
1.2.3.5 Mass spectrometry
Capillary electrophoresis with mass-spectrometric detection has been used for the determination of large biomolecules, such as proteins, DNA fragments, and peptides. It is a sensitive method that offers structural information. The most common sample introduction/ionization interface used is electrospray. One disadvantage is the complex interface between CE and MS.3, 4
1.3 Modes of operation
1.3.1 Capillary zone electrophoresis
Capillary zone electrophoresis (CZE) is the most used mode due to the diverse application range and its simplicity and versatility of operation.
In CZE the buffer composition is constant throughout the region of the separation.4 Separation occurs because solutes migrate in discrete zones and at different velocities (Figure 8). Due to the EOF it is possible to separate both anionic and cationic solutes in CZE. Neutral solutes do not migrate and all coelute with the EOF. CZE is very useful for the separation of peptides and proteins.1
Figure 8-Separation in CZE.
1.3.2 Capillary isoelectric focusing
Capillary isoelectric focusing (IEF) is used to separate peptides and proteins on the basis of pI (Figure 9). A pH gradient is formed within the capillary using ampholytes. Ampholytes are molecules that contain both an acidic and a basic moiety and can have pI values that span the desired pH range of the IEF experiment.
until they reach a region where they are becoming uncharged (at their pI). This process is known as focusing.4
In order to detect the focused bands it is necessary to mobilize the contents of the capillary so that the bands pass the detector. Mobilization can be accomplished through application of pressure to the capillary or by addition of salt to one of the reservoirs. In this technique the EOF should be reduced or suppressed since the flow could flush the ampholytes from the capillary before focusing is completed. This can be accomplished by the use of dynamic or covalent coatings.3
Figure 9-Separation in IEF.
1.3.3 Capillary Isotachophoresis
In capillary isotachophoresis (ITP) a state is created in which separated zones migrate all at the same velocity due to the combination of two buffer systems (Figure 10). The zones remain sandwiched between so-called leading and terminating electrolytes. The leading one contains ions of a higher mobility than any of the analyte ions and a terminating one with ions of a lower mobility than the sample ions. In any particular application only anions and cations can be separated, but not both at the same time.3
The steady-state velocity in ITP occurs since the electric field varies in each zone. The field is self-adjusting to maintain constant velocity, with the lowest filled across the zone with the highest mobility. The boundary between zones is very sharp because of this phenomenon. If a solute specie starts to diffuse into the next zone, it encounters a lower field, which changes velocity and it immediately returns to its zone.
An interesting feature of ITP is the constant concentration in each zone, determined by the concentration of the leading electrolyte. Zones that are less concentrated than the leading electrolyte are sharpened to adapt to the proper concentration.4
Figure 10- Separation in ITP.
1.3.4 Capillary gel electrophoresis
Capillary gel electrophoresis (CGE) is comparable to traditional slab or tube gel electrophoresis since the mechanisms are identical. This technique is helpful in the separation of macromolecules such as proteins and nucleic acids.
CGE is performed in a porous gel polymer matrix that provides a molecular sieving action that retarded the migration of analytes depending of the pore size of the polymer and the size of the analyte ions (Figure 11). As charged solutes migrate through the polymer the larger solutes will be delayed more than smaller ones.3, 4
1.3.5 Micellar electrokinetic chromatography
Micellar electrokinetic chromatography (MEKC) is an electrophoretic technique that can be used for the separation of neutral solutes as well as charged ones. This technique involved introduction of surfactants in the running buffer at concentration levels above the critical micelle concentration, at which micelles form (Figure 12).1 Micelles are
spherical with the hydrophobic tails of the surfactant orientated to the center and the charged heads oriented toward the buffer.
Surfactants can be anionic, cationic, non-ionic, zwitterionic, or mixtures of each. Depending on the charge of the micelles they migrate either with or against the EOF.4 When the sample is introduced into the system, micelles can interact in a chromatographic way through both hydrophobic and electrostatic interactions (the components distribute between aqueous phase and the hydrocarbon phase in the interior of the micelles). For neutral species, it is only partitioning in and out of the micelle that effects the separation. Longer migration times are expected to the more hydrophobic compounds that interact strongly with the micelle.
The direction of solute and micelle migration varies and depends on the micelle charge and the rate of EOF.3
MEKC is a dynamic mode that can be used in a wide range of substances with hydrophilic and hydrophobic characteristics. Applications include amino acids, nucleotides, vitamins, aromatic hydrocarbons, to name a few.1
1.3.6 Capillary electrochromatography
Electrochromatography was first introduced more than 32 years ago by Pretorius6 who demonstrated the feasibility of performing electrodriven separations by applying an electric field across a glass chromatographic column packed with microparticulate silica. However, due to poor heat dissipation in columns with large internal diameters, only weak electrical fields could be used, resulting in slow EOF and significantly slower analysis. Jorgenson and Lukacs7 demonstrated the concept of electrochromatography
using capillary columns packed with silica-based particles. The revival of capillary electrochromatography (CEC) occurred in the 90s as a result of the need for new miniaturized separation methods with vastly enhanced efficiency and peak capacity.8, 9 In electrochromatography, a mobile phase is transported through a stationary phase by electroosmotic flow pumping rather than mechanical pumping.3 So the stationary phase in CEC plays a dual role because it provides sites for the required interactions with analytes and it also drives EOF.10
In principle, CEC enables the exploitation of a plug-like flow profile to achieve high efficiency, while retaining the variety of retention mechanisms and selectivity afforded by HPLC. Separations of uncharged solutes are affected by differential interactions of the solute between the mobile and the stationary phases. Charged species on the other hand can be influenced by the applied electric field and by interactions with the stationary phase; hence separation of charged species is a combination of both differential interaction with the stationary phase and differential electromigration.11, 12
CEC can be carried out in different modes. Generally CEC is performed using packed7, monolith13, open tubular14 columns. Another approach to performed CEC is the use of particles which are viewed as a pseudostacionary phase (PSP).15
end-1.3.6.1 Packed columns
The use of packed capillaries columns in CEC has already been demonstrated in numerous reports.17 The preparation of a packed capillary involves the selection of packing materials; column packing and the preparation of end-frits. Packing materials for CEC should have both charged groups to provide EOF and groups to provide separation selectivity.16 The preparation of these columns includes two key steps: the packing of
small diameter particles into narrow-bore tubes and the fabrication of retaining frits within the capillary.10 The frits are necessary to prevent packing material from migrating
out of the capillary by electrophoresis, EOF, or pressure. One benefit of having column frits is the elimination of unions and connective tubing between the column and injector, and between the column and detection cell. This results in minimization of column band dispersion and contributes to improved peak efficiency along with the plug-like velocity profile generated by EOF.18 Although packing is currently a well-establish technique for the production of CEC columns, repeatability of this procedure remains problematic.10 Another disadvantage of packed capillaries is the need of the preparation of frits by sintering a zone of the packing material. Such frits contribute to column band spreading, bubble formation, and column fragility.19, 20
1.3.6.2 Monolith columns
Monolith columns are continuous porous rods of stationary phase inside the column. Due to their unique properties, monolithic columns have attracted considerable attention. The most appealing aspect of monoliths is the ease of their in situ preparation that avoids problems related to both frit fabrication and packing.10, 21 In addition, the polymerization mixture used for the preparation of organic polymer monoliths can be prepared from a wide variety of precursors, allowing a nearly unlimited choice of both matrix and surface
chemistries.13 The control that can be exerted over the preparation process facilitates optimization of the porous properties of the monolith, and consequently the chromatographic efficiency of the entire system.10
Despite the success of monolith CEC columns, a more complete understanding of the polymerization mechanism is needed to control morphology of the monoliths since large porosity is necessary to provide convective flow through the stationary phase.22
1.3.6.3 Open-tubular columns
The open tubular CEC format is characterized by the preparation of the stationary phase as a thin layer on the inner wall of the capillary. The first report on using open tubular CEC was by Tsuda et al. in 1982.23 They succeeded in separating aromatic compounds by CEC with acetonitrile and water as a mobile phase. Since then several different methods to prepare open-tubular columns for CEC have been developed.24
It has several advantages compared with the other modes, no bubble formation problems because end-frits are not required, small internal diameter columns are used, and the stationary phase is homogeneous. The column length can also be easily shortened.16 However an important limitation of this approach, is the low sample load capacity due to the low quantity of polymeric material available in the capillary.
1.3.6.4 Particles as a Pseudostationary Phase
Another way to perform CEC is to use a pseudostationary phase (PSP). PSPs are interaction phases that are moving with (or against) the mobile phase. The first PSP that was used in an electrochromatography system was micelles by Terabe et al.25 Micelles
Nanoparticles are defined as monomolecular particles, whose sizes are measured in nanometers and they should fulfill some important characteristic features to be suitable in PSP-CEC27:
• Form homogeneous dispersions in a wide range of electrolytes; • Selectivity in the interaction with the analytes;
• Charged , to prevent coelution with EOF; • Equal mobility to prevent peak broadening; • Small mass transfer resistance;
• Not disturb detection;
• Small to provide high surface area for the analytes and to avoid light scattering.
The introduction and characterization of novel nanoparticles has been motivated by the desire for enhanced separation performance, unique selectivity, improved capability for selected applications, or compatibility with specific detectors. Different nanoparticles can be used as PSP in CEC as described in Table 3.15
Table 3-Applications of different nanoparticles in PSP-CEC.
PSP Analytes
Silica nanoparticles
Surfactant stabilized RP particles (1500 nm) Surfactant stabilized RP particles (500 nm) Chemically modified silica particles (500 nm) Colloidal silica
Organically modified silica
Phenol derivatives28
Polyaromatic hydrocarbons (PAHs)29 PAHs and naphthalene derivatives30
Dialkyl phthalates and steroids31 Aromatic acids32
Gold nanoparticles
Gold nanoparticles modified with poly(ethylene oxide) Gold nanoparticles modified with poly(ethylene oxide)
Long dsDNA33
Long dsDNA34
Polymers nanoparticles
Sulfonated hydrophobic nanoparticles (20 nm) Polymer particles
Sulfonated polystyrene-divinylbenzene particles (225 nm) Nanoparticles formed by precipitation polymerization Polystyrene particles
Catechols26
Derivatized alkyl amines35
Alkali metals and ammonium ions36 Amines37
Propanolol38
Fullerenes PAHs39, 40
Carbon nanotubes
Carboxylic single-walled nanotubes (SWNTs)
Multi-wallled nanotubes
Theobromine Caffeine41
Purine42
The main advantages of this PSP system are one-time use of the stationary phase allowing fast regeneration of column, absence of stationary phase carry-over effects, easily exchanged column and either retaining frits or complicated packed procedure is necessary.15 The main drawback in nanoparticle-based PSP-CEC is the negative effect of nanoparticles on detection.43 A way to solve this problem has been to use partial filling technique44, 45or continuous full filling technique37, 46.
1.3.6.4.1 Partial filling technique
Due to the light scattering properties of the nanoparticles the partial filling47, 48 was
developed to avoid disturbance on UV detection. It was first described by Valtcheva et al.44. Using partial filling a plug of PSP is injected prior to (or subsequent to) the analytes
(Figure 13). This allows the analytes and the PSP to enter the detector at different times which minimizes interference during detection of the analytes.37 Optimization of partial filling technique might be time-consuming due to co-elution of the analytes and PSP.43
1.3.6.4.2 Continuous full filling technique
In the continous full filling technique the nanoparticles are suspended in the entire electrolyte, which then is continuously introduced during the separation (Figure 14).37, 46 The continuous full filling technique requires the possibility to detect analytes in the presence of the PSP, or separation of the PSP and analytes prior to detection.43
1.4 Molecular Imprinting
Molecular imprinting is a technique used for the preparation of polymeric matrices with selective molecular recognition capability towards a predetermined ligand. This method can be performed in two different ways either covalent49 or non covalent50, depending on the nature of adducts between functional monomer and template.
Molecular imprinting processes are composed of the following three steps (Figure 15): • Preparation of covalent conjugate or non-covalent adduct between a functional
monomer and a template molecule;
• Polymerization of this monomer-template conjugate (or adduct);
• Removal of the template from the polymer.51
Figure 15-Schematic of the molecular imprinting process.
In step 1, functional monomer and template are connected by a covalent linkage (covalent imprinting) or they are placed nearby through non-covalent interactions (non-covalent imprinting). In step 2, the structures of these conjugates (or adducts) are frozen in a three-dimensional network of polymers. The functional residues (derived from the functional monomers) are topographically complementary to the template. The choice of the template defined selective affinity of an analyte to the molecularly imprinted polymer. Finally in step 3 the templates molecules are removed from the polymer. Here the space in the polymer originally occupied by the template molecule is left as a cavity. Under appropriate conditions, these cavities satisfactorily remember the size, structure, and other physicochemical properties of the template, and bind this molecule (or its analog) efficiently and selectively.
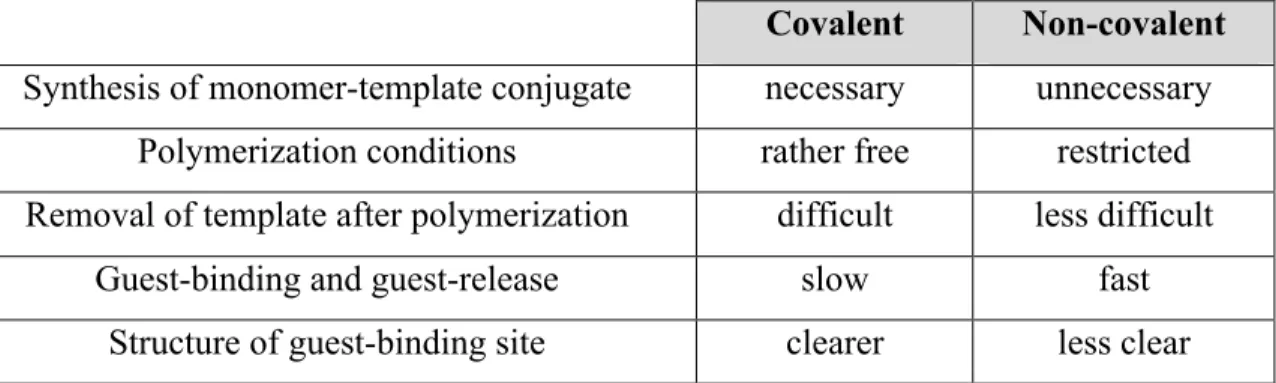
The choice of the best method strongly depends on various factors and both have advantages and disadvantages as described in Table 4.
Table 4- Advantages and disadvantages of covalent and non-covalent imprinting.
Covalent Non-covalent Synthesis of monomer-template conjugate necessary unnecessary
Polymerization conditions rather free restricted Removal of template after polymerization difficult less difficult
Guest-binding and guest-release slow fast
Structure of guest-binding site clearer less clear
Due to their favorable molecular recognition capability and stability, potential applications of molecular imprinting polymers (MIPs) have been investigated in broad areas, such as ligand binding assays, liquid chromatography, solid-phase extraction, sensors, and catalytic chemical reactions.52
Before, MIPs were synthesized in the form of monoliths, which after grinding and sieving, gave irregular particles with different sizes. The grinding and sieving process is time-consuming and yields only moderate amounts of useful imprinted polymers. The irregularity of size and shape of the obtained particles is not ideal for chromatographic purposes. To satisfy different analytical applications MIPs with well controlled physical forms in different size ranges are highly desirable. In addition to improve binding performance of MIPs, new physical formats of MIPs and more efficient synthetic methodologies were proposed. A simple method to prepare MIPs is precipitation polymerization method.45, 53 In this technique, polymeric spherical particles precipitate as
1.5 Molecular Imprinting formats for capillary electrochromatography
The high selectivity and stability of the MIP make it an interesting candidate for application as stationary phase sorbent in chromatography.
The use of CEC was a way to improve the efficiency of the MIP-based separation system. The miniaturized features of the capillary column allows the synthesize of a MIP stationary phase with low amounts of monomers, templates and solvents.22, 55 In this
context miniaturized separation formats are gaining importance.22
MIP formats for CEC can be divided in different categories, the monolith format, the packed format, the open tubular format and the nanoparticle format.
1.5.1 MIPs for open tubular CEC
The preparation of MIP open tubular capillaries offers advantages in that the in situ preparation is simple, and the efficiency in electrochromatographic separations is high.22 In open tubular CEC, thin films of MIPs are bonded to the internal wall of the capillary. Normally the imprint molecule is the more strongly retained and is therefore eluted last.56 However an important limitation of this approach is the low sample load capacity due to the low quantity of polymeric material available in the capillary. The thickness of the molecular imprinted capillary coatings should be large enough in order to accommodate the stereoselective binding sites, but small enough to provide a rapid transfer of solutes from the electrolyte to the imprinted sites.
1.5.2 MIP packed capillaries
The preparation of MIP packed columns consists in the synthesis of the polymer in bulk, followed by grinding and sieving to obtain particles with a diameter of less than 10um.57,
58
The capillary showed enantiomer separation properties, with improved peak shape and resolution in the CEC system when compared with HPLC. The approach is however associated with serious limitations, the most important probably being the need of frits. In particular the use of acrylamide gel for this purpose may result in non-specific interactions with the analytes, leading to peak tailing and efficiency losses. The irregularly shaped particles and their broad size distribution, obtained by the crushing and sieving technique, further limit the efficiency of the system.
An important advance in this regard was the introduction of MIP-silica composites as new stationary phase material for CEC.22
1.5.3 Monolith MIPs in CEC
Monoliths offer important advantages, particularly for MIP-CEC applications, due to the easy in situ preparation and the absence of retaining frits. However, they rely on the presence of large pores to provide convective flow through the stationary phase. In the case of MIPs, these pores must be generated simultaneously with the generation of the molecular scale binding sites, which constitutes the main limitation of this approach.22 The main parameters controlling the pore size distribution are temperature, crosslinking level and the nature and content of porogenic solvent. Thus in thermally initiated polymerizations, large pores are promoted by low polymerizations temperatures, lower crosslinking levels and the use of poor solvents for the growing polymer chains.
1.5.4 MIP nanoparticles
MIP nanoparticles can be added to the background electrolyte which offers many attractive features. It avoids time-consuming capillary packing, frit formation and the method development can be fast, as conditions and type of MIP selector can be quickly changed prior to every run.22, 59
The nanoparticles, with sizes ranging between 100 and 600nm, are too small to be efficiently packed in a capillary column. Using the partial-filling technique the use of this particle-based phase is facilitated.55, 60
Despite the simplicity and attractive features of the set up, the filling techniques also have limitations.22
2. Material and Methods
2.1 Chemicals
Trimethylolpropane trimethacrylate (TRIM, technical grade) was obtained from Aldrich (Dorset, UK) and used as received. Acetonitrile (ACN, 99.7%) and azobisisobutyronitrile (AIBN, 98%) used for nanoparticle synthesis were purchased from Merck (Darmstadt, Germany). AIBN was re-crystallized from methanol before use. Methacrylic acid (MAA, 98.5%) was purchased from ACROS (Geel, Belgium) and used as received. Acrylamide (>99.9 %) was purchased from Bio-Rad (Hercules, CA) and used as received. N,N’-methylene-bis-acrylamide (MBA, ≥ 98.0%) was purchased from Sigma (Gillingham, UK).(R)-propranolol hydrochloride (99%) supplied by Fluka (Dorset, UK) was converted into free base form before use.
Water was purified by a MiliQ purification system (Millipore, Bedford, MA, USA). Tricine, 2-(N-morpholino)ethanesulfonic acid (MES) and formic acid were obtained from Sigma (St. Louis, MO), sodium hydroxide from Eka Nobel (Sweden). Acetic acid, ammonium formate, phosphoric acid (85 %), potassium phosphate, citric acid and ammonium acetate were obtained from Merck (Hohenbrunn, Germany).
2.2 Preparation of nanoparticles 2.2.1 MIP nanoparticles
2.2.1.1 Methacrylic acid based nanoparticles
The template molecule, (R)-propranolol in its free base form (137 mg, 0.53 mmol) was dissolved in 40 ml of acetonitrile in a 150 mm×25 mm borosilicate glass tube equipped with a screw cap. MAA (113 mg, 1.31 mmol), TRIM (684 mg, 2.02 mmol) and AIBN (28 mg, 3 wt% of monomer) were then added. The solution was purged with a gentle flow of argon for 5 min and sealed under argon. Polymerization was carried out by inserting the borosilicate glass tube in a water bath pre-set at 60 ◦C for 24 h. After polymerization, particles were collected by centrifugation at 18,000 rpm (38,000×g) for 20 min. The template was removed by batch-mode solvent extraction with methanol containing 10% acetic acid (v/v), until no template could be detected from the washing solvent by spectrometric measurement (UV 290 nm). Polymer particles were finally washed with acetone and dried in a vacuum chamber. The resulting MIP particles, MIP(R) were imprinted against (R)-propranolol.
2.2.1.2 Core shell MIP nanoparticles
Molecularly imprinted polymer core-shell particles were synthesized by dissolving 65 µl (0.77 mmol) MAA, 378 µl (1.2 mmol) TRIM, 9.3 mg AIBN (2 wt% relative to the monomers) and 81 mg (0.31 mmol) (R)-propranolol in 47 mL acetonitrile in a 50 mL three neck round-bottom flask. A magnetic stir bar was put in the flask. The solution was gently purged with nitrogen for 10 min.
In a dropping funnel with pressure equalizing arm, 59 mg (0.38 mmol) MBA, 175 mg (2.5 mmol) acrylamide and 4.7 mg AIBN was dissolved in 23 ml acetonitrile. The solution was gently purged with nitrogen for 10 min. The funnel was attached to the flask and the flask was mounted to a Dean-Stark receiver. The free opening of the flask was closed with a glass plug. The flask was submerged in an oil-bath and heated to 80°C
during 20 min under stirring. Then the oil-bath was heated to 115°C and the reaction system was kept on reflux for 60 min. The reaction temperature in the round bottom flask was 83.0-84.0°C. Then the acetonitrile was distilled out dropwise and at the same rate solution from the funnel was added. The reaction was stopped when 23 mL of acetonitrile was distilled out from the reaction system and the funnel was completely empty after about 1.5 hours. After the polymerization, the particles were collected by centrifugation. The template (propranolol) was extracted by washing with 30 mL acetic acid:methanol mixture (10:100, v/v) repeatedly, until no template could be detected from washing solvent by UV-visible spectrophotometer. Approximately seven times with over-night washing was needed. Particles were finally washed with acetone and dried in vacuum chamber.
2.2.2 Silanized gadolinium oxide nanoparticles The protocol from these nanoparticles is confidential.
2.3 Capillary Electrophoresis and Capillary Electrochromatography
CE and CEC experiments were performed on a Beckman P/ACE System 5010 (Beckman, Fullerton, CA, US) equipped with a UV detector. Fused-silica capillary (50 µm i.d.; 375 µm o.d.) with 25 cm total length and 18 cm effective length were obtained from Polymicro Technologies (Phoenix, AZ, US).
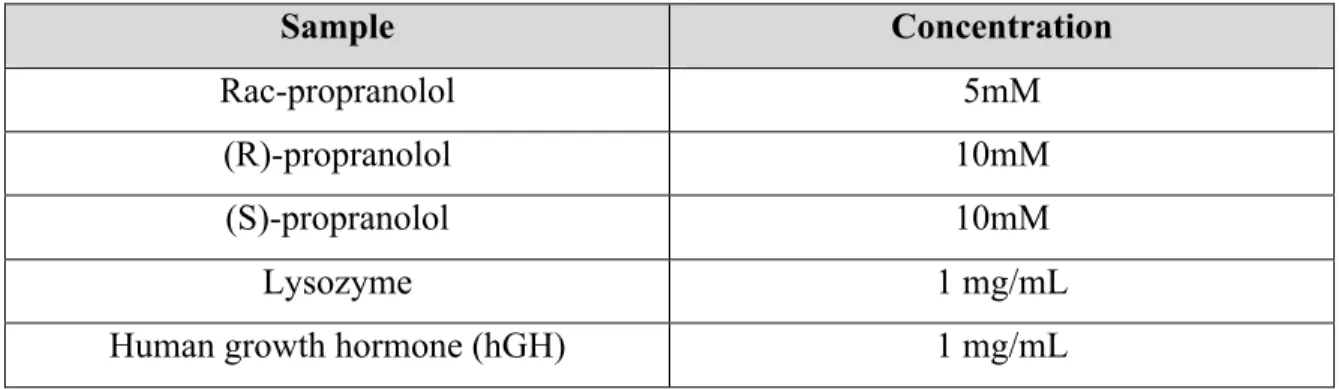
The electrolytes used were either pure aqueous buffers or suspensions of nanoparticles suspended in the electrolyte. Different aqueous buffers in a wide range of concentrations and pH were used to performed experiences. The samples were prepared from stock solutions (Table 5) diluted with electrolyte to the desirable concentration.
Table 5- Sample stock solutions. Sample Concentration Rac-propranolol 5mM (R)-propranolol 10mM (S)-propranolol 10mM Lysozyme 1 mg/mL
Human growth hormone (hGH) 1 mg/mL
The capillary was rinsed with 1M sodium hydroxide (1min), water (1min), and electrolyte (1min) between consecutive runs. Samples were injected electrokinetically while nanoparticles were hydrodynamic injected. Prior to separation, all solutions and nanoparticles suspensions were degassed by sonication.
3. Results and Discussion
3.1 MIP-based CEC enantiomer separation
To avoid absorbance and scattered light from MIP nanoparticles using UV detection, the partial filling technique was used. This technique allows manipulation of the amount of MIP used for a certain separation. A new and fresh amount of MIP nanoparticles are used for each CEC run.
For analytes to reach the detector window prior to the MIP it is important to optimize the CEC system. The migration of the MIP nanoparticle is determinate by EOF of the system and the charge of the MIP. In the present study, migration of MIP nanoparticles was mainly due to the EOF.
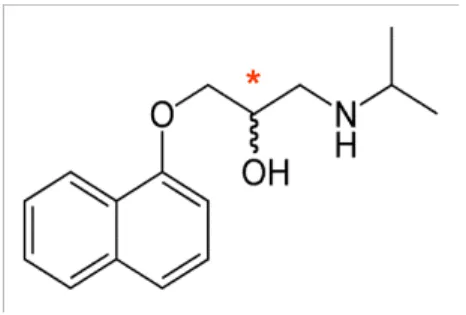
Enantiomer separation of propranolol (Figure 16) in R (+) and S (-) form was attempted with two different types of nanoparticles.
Figure 16-Chemical structure of propranolol. The asterisk indicates the chiral center of propranolol.
Methacrylic acid based nanoparticles and core shell nanoparticles were used as pseudostationary phase which will be described in the following sections.
3.1.1 Methacrylic acid based nanoparticles
MIP nanoparticles composed of a crosslinked MAA imprinted core were synthesized using R-propranolol as a template. Due to the characteristics of the polymers the nanoparticles are hydrophobic (Figure 17).
By dynamic light scattering (DLS) the average diameter of the nanoparticles was measured to 100 nm.
Figure 17-Nanoparticle schematic.
3.1.1.1 Suspension stability of nanoparticles in different electrolyte compositions
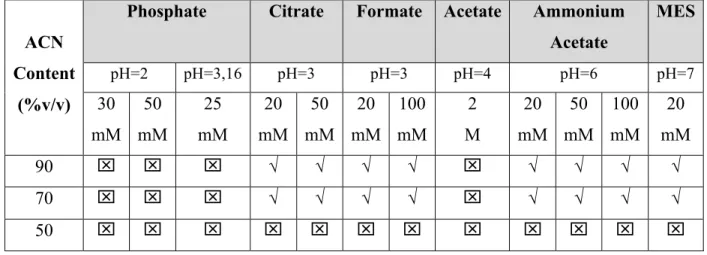
Electrolytes solutions with different buffer types, pH and ionic strength were studied in order to obtain stable suspensions of MIP nanoparticles (Table 6). The MIP nanoparticles were suspended in the electrolyte to a concentration of 5mg mL-1.
Table 6- Composition of electrolyte tested. Nanoparticles sedimentated , stable√.
Phosphate Citrate Formate Acetate Ammonium Acetate MES pH=2 pH=3,16 pH=3 pH=3 pH=4 pH=6 pH=7 ACN Content (%v/v) 30 mM 50 mM 25 mM 20 mM 50 mM 20 mM 100 mM 2 M 20 mM 50 mM 100 mM 20 mM 90 √ √ √ √ √ √ √ √ 70 √ √ √ √ √ √ √ √ 50
Due to the hydrophobic properties of methacrylic acid based nanoparticles, higher contents of organic solvent, ACN were necessary to obtain suspension stability. The pH seems to have lower effect in suspension stability as seen in Table 6. Higher concentrations of buffer give instable suspensions of nanoparticles.
Therefore electrolyte compositions that give suspension stability of MIP nanoparticles were used in the following CEC studies.
3.1.1.2 CEC enantiomer separation of rac-propranolol
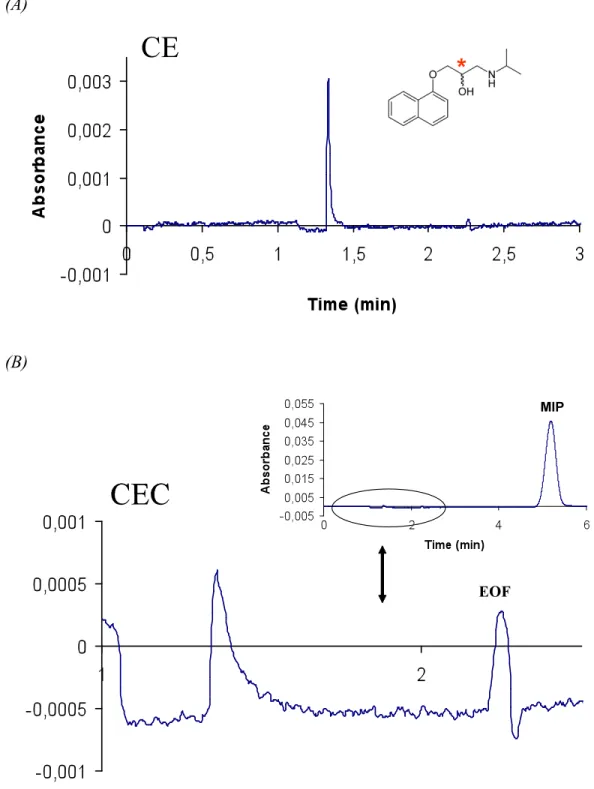
Enantiomer separation of propranolol was not achieved using any of the electrolytes compositions described in Table 6 (Figure 18, 19, 20). Different plugs lengths of the MIP nanoparticles and sample were examined.
Electrostatic interactions have a dominant effect on recognition when high levels of ACN are used. This can lead to unspecific interactions between the sample, propranolol and the MIP nanoparticles. Even though MIP nanoparticles present specific interaction for R-propranolol they are not strong enough to overcome the unspecific interactions in the conditions where MIP nanoparticles formed stable suspensions.
In a more aqueous environment the natural tendency of propranolol and MIP nanoparticles would be to interact with each other by van Der Waals interactions due to their hydrophobic characteristics. A decrease of organic solvent, ACN would improve separation but it was proved before that high levels are necessary for suspension stability of MIP nanoparticles.
The synthesis of MIP nanoparticles with a more hydrophilic characteristic would improve suspension stability and thereby separation.
(A)
(B)
Figure 18- CE/CEC runs of propranolol. (A) Electropherogram of rac-propranolol (50 µM) without MIP nanoparticles. (B) Electrochromatogram of rac-propranolol with MIP nanoparticles. Electrolyte composed of 70% of acetonitrile 50 mM ammonium acetate buffer (pH 6). Injection of the sample was made electrokinetically at 3 kV 2,0 s; MIP nanoparticles injection made hydrodynamically at 0,5 psi 3,0 s. Separation performed at 10 kV, room temperature. UV detection was made at 214 nm.
(A)
(B)
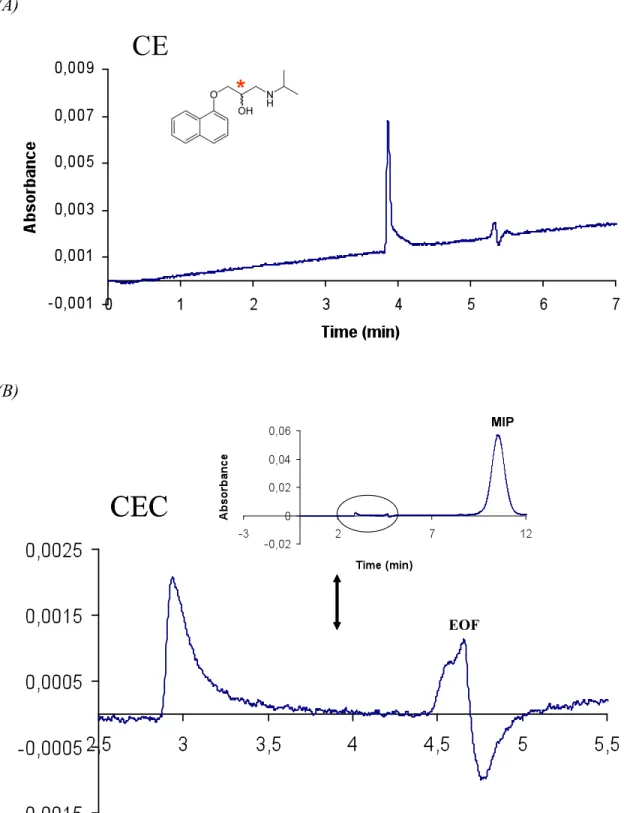
(A)
(B)
Figure 20- CE/CEC runs of propranolol. (A) Electropherogram of rac-propranolol (100 µM) without nanoparticles. (B) Electrochromatogram of rac-propranolol with MIP nanoparticles. Electrolyte composed of 90% of acetonitrile 20 mM MES buffer (pH 7). Injection of the sample made electrokinetically at 3 kV 5,0 s; MIP nanoparticles injection made hydrodynamically at 0,5 psi 2,0 s. Separation performed at 3 kV, room temperature. UV detection was made at 214 nm.
3.1.2 Core shell MIP nanoparticles
Core shell MIP nanoparticles composed of a highly crosslinked MAA imprinted core with a shell of crosslinked poly(acrylamide) were synthesized (Figure 21). This non-imprinted shell makes the MIP nanoparticles more hydrophilic but the imprinting cavity presents hydrophobic characteristics due to the monomers. The nanoparticles were imprinted using R-propranolol as a template.
Average hydrodynamic size was measured by DLS. The MIP core of the nanoparticles has a radius of 82 nm and the MIP shell 130 nm.
3.1.2.1 Suspension stability of nanoparticles in different electrolyte composition
The suspension stability of MIP nanoparticles in the electrolyte is important to achieve good performance in CEC. Different electrolyte conditions were tested in eppendorf tubes changing type of buffer, ionic strength, pH as well as the percentage of acetonitrile used (Table 7). The MIP nanoparticles were suspended in the electrolyte to a concentration of 5mg mL-1.
Table 7- Composition of electrolyte tested. Nanoparticles sedimentated, Stable√.
Citrate MES Phosphate
pH=3,4 pH=5,9 pH=6,5 pH=7,00 ACN Content (%v/v) 20mM 50mM 20mM 50mM 20mM 50mM 20mM 50mM 90 √ √ √ √ √ 70 √ √ 50 √ √ √ √ √ √ √
MIP nanoparticles show suspension stability at lower content of ACN as expected. Stable suspensions of MIP nanoparticles are obtained using MES buffer at low concentration, so further studies were made using this buffer with different ionic strength, pH and different amounts of acetonitrile.
Other electrolyte compositions with different buffers were also tested in CEC studies but did not result in enantiomer separation of propranolol.
3.1.2.2 CEC enantiomer separation of rac-propranolol 3.1.2.2.1 Enantiomer separation with MES buffer pH 6,5
Compositions of electrolytes using MES buffer pH 6,5 with different concentrations and various contents of ACN were tested in CEC (Table 8).
Table 8- Composition of electrolytes used in CEC performance.
Electrolyte solution Acetonitrile Content (%v/v)
10mM MES 40 30 40 50 60 20mM MES 70 30mM MES 50 50mM MES 50
Enantiomer separation of propranolol was achieved using an electrolyte composition of 40% of acetonitrile and 60% 20mM MES buffer pH 6.5 (Figure 22). The MIP electrolyte was introduced hydrodynamically into the capillary during 10,0s at 0,5 psi to partially fill the capillary with MIP nanoparticles. The sample was then injected electrokinetically during 3,0s at 3,0 kV.
Enantiomers were separated in less than 4 min with the expected elution order of R-propranolol being the most retained.
(A)
(B)
Figure 22- CE/CEC runs of propranolol. a) Electropherogram of rac-propranolol (50 µM) without nanoparticles. b) Electrochromatogram of rac-propranolol with MIP nanoparticles. Electrolyte composed of 40% of acetonitrile and 60% 20 mM MES buffer (pH 6,5). Injection of the sample made electrokinetically at 3 kV 5,0 s; MIP nanoparticles injection made hydrodynamically at 0,5 psi 10,0 s. Separation performed at 3 kV,room temperature. UV detection was made at 214 nm.
Propranolol enantiomer separation by MIP nanoparticles results from specific interactions with recognition sites within the MIP nanoparticles but also nonspecific interactions with randomly hydrogen bonds residues can occur. The quantity of these nonspecific interactions can contribute to a higher or lower specificity.
Enantiomer separation of propranolol was possible but with time only one peak could be noticed (Figure 23, 24). The nonspecific interactions appear to have a strong influence on the separation. Tailing of the second peak are shown in figure 22 as a result of these unspecific interactions.
Strong interactions between the MIP nanoparticles and the capillary wall can occur even though flushing with NaOH is performed between each run.
Also evaporation of the organic solvent can become significant with time due to the design of vials used in this CEC instrument.
At higher concentrations, buffer ions can act as competing ligands and influence recognition. In this case, the influence of buffer molecules can be assumed to be negligible since low concentration was used.
Figure 24- Electrochromatogram of rac-propranolol with MIP nanoparticles. Electrolyte composed of 40% of acetonitrile and 60% 20 mM MES buffer (pH 6,5). Injection of the sample made electrokinetically at 3 kV 5,0 s; MIP nanoparticles injection made hydrodynamically at 0,5 psi 10,0 s. Separation performed at 3 kV, room temperature. UV detection was made at 214nm.
The experiments were performed with low levels of ACN to promote imprinting recognition based on hydrophobic effect. Addition of buffer with high pH to the electrolyte decreases the tendency of propranolol (pKa=9,4) to be ionized and increase its hydrophobicity.
To increase the recognition based on hydrophobic interactions and decrease the influence of electrostatic interactions, a higher pH was used in the following studies.
3.2.2.2 Enantiomer separation with MES buffer pH=7
Enantiomer separation was possible at pH 7 with 40% ACN and 60% 20 mM MES as shown in figure 25. MIP nanoparticles were introduced hydrodynamically during 8s at 0,5psi and the sample injected electrokinetically for 5,0 s at 3,0 kV.
(A)
Improvement of baseline separation was achieved in comparison with lower pH. But with time the behavior was the same as for pH 6,5 when only one peak could be seen (Figure 26, 27).
Figure 26- Electrochromatogram of rac-propranolol (100 µM) with MIP nanoparticles. Electrolyte composed of 40% of acetonitrile and 60% 20 mM MES buffer (pH 7). Injection of the sample made electrokinetically at 3 kV 5,0 s; MIP nanoparticles injection made hydrodynamically at 0,5 psi 8,0 s. Separation performed at 3 kV,room temperature. UV detection was made at 214 nm.
Figure 27- Electrochromatogram of rac-propranolol (100 µM) with MIP nanoparticles. Electrolyte composed of 40% of acetonitrile and 60% 20mM MES buffer (pH 7). Injection of the sample made electrokinetically at 3 kV 5,0 s; MIP nanoparticles injection made hydrodynamically at 0,5 psi 8,0 s. Separation performed at 3 kV,room temperature. UV detection was made at 214 nm.
Even though hydrophobic interactions were favored it seems that unspecific interactions are still occurring. As explained before other factors can contribute for lower recognition, interaction between capillary wall and MIP nanoparticles and evaporation of the organic solvent.
To verify how strong the effect of unspecific interactions were, enantiomer separation samples of R (+) and S (-) of propranolol were injected separately.
As seen in figure 28 the R form interacts more strongly than the S form. This shows that the MIP nanoparticles have more specificity for the R form as expected.
Figure 28- Electrochromatogram of (R)-propranolol 100 µM (blue) and (S)-propranolol 100 µM (pink) with MIP nanoparticles. Electrolyte composed of 40% of acetonitrile and 60% 20mM MES buffer (pH 7). Injection of the samples made electrokinetically at 3 kV 5,0 s; MIP nanoparticles injection made hydrodynamically at 0,5 psi 8,0s. Separation performed at 3 kV, room temperature. UV detection was made at 214 nm.
In order to increase the time of interaction between the MIP nanoparticles and the sample Tween 20, a non-ionic surfactant, was used as an electrolyte modifier in order to suppress the EOF. Previous studies show that the use of organic modifiers and/or surfactants can improve the performance of MIP-based CEC systems. In this study improvement was not noticed and enantiomers co-eluted (Figure 29). Also severe tailing of the peak was noticed.
Figure 29- Electrochromatogram of rac-propranolol (100 µM) with MIP nanoparticles. Electrolyte composed of 0,05% Tween 20, 40% of acetonitrile and 59,95% 20 mM MES buffer (pH 7). Injection of the sample made electrokinetically at 3 kV 3,0 s; MIP nanoparticles injection