ii
Inês Filipa Inácio de Morais Faria
How can the association between PRM and
nutritional therapy protocol improve health
outcomes and what is the impact on reducing
expenditure in a public hospital?
Dissertation presented as the partial requirement for
obtaining a Master's degree in Information Management
ii
NOVA Information Management School
Instituto Superior de Estatística e Gestão de Informação
Universidade Nova de LisboaHOW CAN THE ASSOCIATION BETWEEN PRM AND NUTRITIONAL
THERAPY PROTOCOL IMPROVE HEALTH OUTCOMES AND WHAT IS
THE IMPACT ON REDUCING EXPENDITURE IN A PUBLIC HOSPITAL?
Inês Filipa Inácio de Morais Faria
Dissertation presented as the partial requirement for obtaining a Master's degree in Information Management, Specialization in Marketing Intelligence Advisor: Roberto André Pereira Henriques, PhD Advisor: Carla Adriana Santos, PhDDecember 2019
4
To my husband Rúben, To my grandmother
5
ACKNOWLEDGEMENT
The work supporting this dissertation would not have been possible without the collaboration, effort and supportive commitment of a few important people to whom I am absolutely grateful:
• I had the privilege of being guided by Roberto Henriques, PhD, for his availability, for his support in writing and revising this Dissertation. Its orientation, its extraordinary attention to detail, its smooth and catchy correction were crucial to the success of this Dissertation.
• I was also privileged to be co-counselled by Carla Adriana Santos, PhD, a member of the Nutrition Department of Garcia de Orta, E.P.E. hospital, whose work has become a reference. Their collaboration and support in designing the project, integrating this study into the outpatient diabetes comsultation activity, selecting and organising data for publication were critical to the success of this study. Moreover, their constant availability was also a remarkable privilege.
• I also thank Dr. Miguel Eanes, Dr. Pedro Caldeira Dias, and Dr. Maria José Tribolet Bento for all their trust and support demonstrated during this project.
• Finally, a special thanks to all the health professionals of the external diabetes consultation service that always articulate and collaborate with the consultation.
6
ABSTRACT
Introduction: For most type 2 diabetic patients, the most challenging issue of treatment is knowing
what to eat. A healthy and adequate diet, associated with regular physical activity and, in most cases, pharmacotherapy, are the pillars of disease control. To minimise patient noncompliance, the goal is to use Patient Relationship Management (PRM), which allows planning in a systematic and skilled manner, enhancing decision making, as well as delegation and control of tasks. Many hospitals have already recognised the use of the best practice in PRM practices, which has enabled them to deal more effectively and efficiently with the entire healthcare process by responding directly to patients' needs and experiences throughout the assistance process. Objectives: The main objective of this project is to find strategies that support the Win-Win model (patient, institution) to understand the importance of PRM associated with a specific nutritional protocol in adherence to therapy, and whether it is associated with effective health gains. Methodology and Sample: Epidemiological and interventional research study in a convenience sample of all type 2 diabetes outpatients followed in the external diabetes consultation within the time frame established for the study and who agreed to participate and use the proposed tools. The study took place at the Garcia de Orta Hospital, E.P.E., during the period between April and June 2019, in the Diabetes medical appointment. It was used the Statistical Package for Social Sciences (IBM SPSS Statistics), version 21 IBM. The results are considered significant at a 5% significance level. Descriptive statistics were used to evaluate the changes in the different parameters mentioned in the questionnaires, as well as the variation of glycated hemoglobin (HbA1c), weight and BMI. To compare the groups CG and IG we used the Mann-Whitney U test. To compare weight and BMI between the two groups, the independent samples test was used, since the assumption of normality of data in BMI categories is not verified. To compare the parameters between two moments, we used the Wilcoxon test. Results: This study included 62 type 2 diabetes outpatients who were admitted for nutritional therapy through the Endocrinology service in Garcia de Orta Hospital, E.P.E.: 39 men and 23 women, with ages ranging between 32-82 years (51 patients ≥ 50 years old) and a mean age of 59 years (SD=11.18). Patients were randomly divided into two groups using the envelope method: intervention group (IG) and control group (CG). Of the total sample (n = 62), BMI ranged between 21.17 and 48.56 kg/m2, with a mean value of 32 kg/m2. Weight was assessed in 62 patients, ranging from 52-143 kg. It was found a mean HbA1c of 9 ± 0.4g / L, with values ranging from 5.6 to 13.9 g/L. Regarding groups evolution, after six weeks, the CG between T0 and T2 had a variation between 3-6% of their BMI, variation between a 9% loss in body weight and a 6% increase of their weight and a variation between a 3.2g/L decrease and a 2g/L increase in HbA1c. For the IG, the BMI between T0 and T2 had a variation between 1-9%, all patients lost a total of weight ranging from 1-9% and none of the patients had an increase in HbA1c value. The decrease in this value ranged from 0-7 g/L. Conclusions: The use of a nutritional protocol that combines a regular and adapted nutritional therapy, accompanied by a digital tool, boosted health gains in the group of diabetics who had this follow-up.
7
KEYWORDS
8
ÍNDEX
1.
INTRODUCTION ... 1
2.
LITERATURE REVIEW ... 4
2.1
Diabetes Mellitus ... 4
2.1.1
The Type 2 Diabetes Pandemic ... 5
2.1.2
Costs of Diabetes in Portugal ... 6
2.1.3
Hospitalisation ... 8
2.1.4
Diabetes Self-management and Adherence to therapy ... 10
2.1.5
Nutritional monitoring and therapy ... 11
2.1.6
Food Frequency Questionnaire - 24h dietary recall ... 12
2.2
Health Literacy and Health Promoting behaviours in Patients with T2DM ... 13
2.3
Implementation of Health Information Systems ... 14
2.4
Evaluation of information systems ... 14
2.5
Patient Relationship Management (PRM) ... 15
3.
OBJECTIVES ... 17
3.1
General objectives ... 17
3.2
Specific objectives ... 17
4.
METHODOLOGY ... 18
5.
ETHICAL CONSIDERATIONS ... 22
6.
RESULTS ... 23
7.
DISCUSSION AND CONCLUSIONS ... 31
8.
RECOMMENDATIONS FOR FUTURE WORKS ... 34
9.
STUDY LIMITATIONS ... 35
10.
CONFLICT OF INTEREST STATEMENT ... 36
11.
BIBLIOGRAPHY ... 37
9
FIGURE ÍNDEX
Figure 1 – PREVADIAB- SPD, OND Treatment (Adjusted to Population Distribution)
(Observatório Nacional da Diabetes, 2016) ... 5
Figure 2 – INE; Deaths from Causes of Death – Portugal; Potential Years of Life Lost (PYLL) due
to Diabetes Mellitus in Portugal. Adapted from (Factos e Numeros, 2016) ... 6
Figure 3 – GDH’s — ACSS/DGS; IMS Health; Infarmed; DGS; OND Treatment; Variation in costs
associated with hospitalisation when diabetes is a secondary factor to the central
pathology. Adapted from (Observatório Nacional da Diabetes, 2016) ... 8
Figure 4 – GDH – ACSS/DGS: Hospital morbidity statistics. Users out of NHS Hospital
admissions with Diabetes. Adapted from (Observatório Nacional da Diabetes, 2016) .... 9
Figure 5 – GDH's - ACSS / DGS; Number of Inpatients (Patients Left) T2DM - Associated and
Main Diagnosis - Continent - SNS; OND treatment. Causes for Inpatient Admission of
Patients with Diabetes in NHS Hospitals. Adapted from (Observatório Nacional da
Diabetes, 2016) ... 10
Figure 6 – Scheme adapted from the type of strategy adopted for the study. Processes and
methodology ... 21
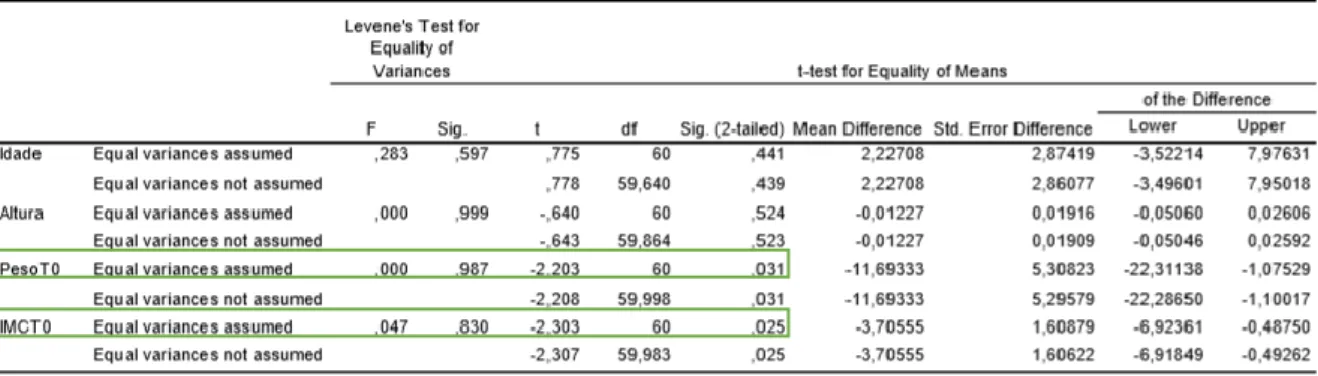
Figure 7 – Independent Sample Test ... 29
Figure 8 - Mann-Whitney test ... 29
10
TABLE ÍNDEX
Table 1 – Results from the diabetes literacy questionnaire applied to the total population (n =
62) in T0 ... 23
Table 2 - Results from the 24h recall questionnaire applied to the total population (n = 62) in
T0 ... 25
Table 3 - Results from the 24h recall questionnaire applied to the total population (n = 62) in
T2, after nutritional therapy and text messaging intervention ... 28
Table 4 – Degree of adherence to the nutritional plan and lifestyle changes for the Control
Group and Intervention Group ... 28
11
ANNEXE ÍNDEX
Annexe 1 - Diabetes Knowledge Questionnaire (QCD): Psychometric Properties - (Sousa et al.,
2015) ... 43
Annexe 2 - Messaging (PRM) - needs-based intervention group ... 44
Annexe 3 -Original schema that served as a model for a study-adapted schema model ... 45
12
LIST OF ACRONYMS AND ABBREVIATIONS
PRM – Patient Relationship Management CRM – Customer Relationship Management CDC – Certified Diabetes Education
NHS – National Health Service WHO – World Health Organization PNP – National Health Plan T1DM – Type 1 Diabetes Mellitus T2DM - Type 2 Diabetes Mellitus IGT - Impaired glucose tolerance IFG - impaired fasting glycemia
DMSE - Diabetes self-management education CDE - certified diabetes educator
BMI – Body Mass Index
ADA – American Diabetes Association
AACE – American Association of Clinical Endocrinologists
OECD – Organization for Economic Co-operation and Development IDF – International Diabetes Federation
MM – Multi-morbidity
HbA1C - Glycated haemoglobin MNT – Nutritional Therapy
PAHO - Pan American Health Organization
UKPDS - Type 2 diabetic patients in the United Kingdom HIS – Hospital Information System
CG – Control Group IG – Intervention Group
13 rEI - reported energy consumption
ROI - return on investment IS – information services IT – information technology HIS – Hospital Institution Systems NHS – National Health Service g – gram
L - Liter Kg – kilogram m - meter
1
1. INTRODUCTION
Average years of life (life expectancy) have continuously increased in most countries over the last century with no apparent plateau. In low-mortality countries, most of the recent rise in life expectancy has been attributed to declining mortality rates at an older age. Whether additional years of life are also accompanied by years in good health has become a subject of intense interest (Beltrán-Sánchez, Soneji, & Crimmins, 2015).
Portugal is no exception when life expectancy at birth was estimated at 80,80 years. In 2016-2018, men and women could expect to live up to 77,78 years and 83,43 years, respectively. Compared with 2015-2017, it represents an increase of 0,48 months for men and 0,24 months for women and a slowdown from gains in 2015-2017 when it increased by 1,56 and 0,96 months, respectively, for men and women. Within a decade, there was a gain of 2,06 years of life for the total population, 2,29 years for men and 1,62 years for women (Instituto Nacional de Estatística, 2017).
A longer life brings with it opportunities, not only for older people and their families but also for societies as a whole. Additional years provide the chance to pursue new activities such as further education, a new career, or pursuing a long-neglected passion. Older people also contribute in many ways to their families and communities. Nevertheless, the extent of these opportunities and contributions depends heavily on one factor: health. If these added years are dominated by declines in physical and mental capacity, the implications for older people and society are more negative (Andrews, 2009).
For this reason, it was necessary to create a new strategic position about the types of approaches and interventions in health that could achieve the goals set by the National Health Plan (PNP) for 2020. For all that has been described, it comes as no surprise that the main concerns are to improve the average life expectancy with health at age 65 and the reduction of premature mortality, which will inevitably go through specific programs to combat most chronic diseases (Ministério da Saúde, 2018).
Also, there are several structural changes to the Health System in Portugal in recent years, and in 2017 the National Strategy for the Health Information Ecosystem 2020 was approved, which aims to increase personal, autonomous and participatory use of citizens. For this to happen, it is envisaged that multiple platforms of digital services will be available to allow access and sharing of information, but also the simplification and dematerialisation of registries and processes in the National Health Service (NHS) by 2020 (Ministério da Saúde, 2018). Nevertheless, the question that always remains present is cost, at a time when the reduction of health expenditure continues without the desired results (Putera, 2017).
Adherence to therapy and compliance, whatever it is, is critical to achieving health gains. The aim of any prescribed medical therapy is to achieve certain desired outcomes in the patients concerned. These desired outcomes are part and parcel of the objectives in the management of the diseases or conditions (Jones et al., 2012). However, despite all the best intentions and efforts on the part of the healthcare professionals, those outcomes might not be achievable if the patients are non-compliant. This shortfall may also have serious and detrimental effects from the perspective of disease management. Therapeutic adherence not only includes patient compliance with medication but also with diet, exercise, or lifestyle changes (Lin, Sklar, Oh, & Li, 2008). In the Oxford dictionary, compliance
2 is defined as the practice of obeying rules or requests made by people in authority (Ross-Smith, 2014) however, when we talk about health, the most commonly used definition of compliance is "patient's behaviours (in terms of taking medication, following diets, or executing lifestyle changes) coincide with healthcare providers’ recommendations for health and medical advice” (Rafii, Fatemi, Danielson, Johansson, & Modanloo, 2014).
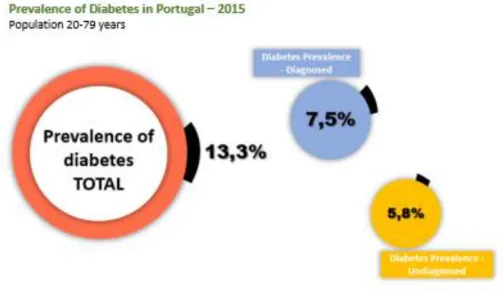
Diabetes is a worldwide epidemic that represents a burden on health systems. The vast majority of the costs of Type 2 Diabetes Mellitus (T2DM) are associated with hospitalisation, causing costs not only to the State but also having a negative impact on the health of the individual (Monteiro, 2011). In Portugal, according to the National Diabetes Program 2017, it is estimated that in 2015, the prevalence of diabetes in the national territory was 13.3%, with about 44% of the Portuguese population as yet undiagnosed (Direção-Geral da Saúde, 2016). The prevalence of diabetes would be 9.9% in adults, which is above the Organisation for Economic Co-operation and Development (OECD35) average of 6.4% (OECD, 2010). For most diabetics, the most challenging issue of treatment is knowing what to eat. A healthy and adequate diet, associated with regular physical activity and, in most cases, pharmacotherapy, are the pillars of disease control (Powers et al., 2015a)
Nutritional therapy is fully recognised as an essential tool in the overall control of T2DM, and there is no generalised standard. This makes it recommended that each person has nutritional therapy appropriate to their situation and that each patient actively participates in the self-regulation, education, and planning of their nutritional therapy with the accompanying nutritionist, which includes the collaborative development of an individualised diet plan (American Diabetes Association, 2019). Therefore, it is crucial that all members of the health team have knowledge about nutritional therapy for diabetes . However, what is seen is that "previous eating habits are the ones that most interfere with diet adherence, being cited in 61.54% of the articles. Emotional aspects and family and/or social support appeared in 46.15% of the studies analysed. Socioeconomic and/or related to social class, food restriction, the absence of diagnosis/knowledge about complications of diabetes were found in 38.46% of the analyses. Other factors cited in 23.08% of the studies evaluated were an asymptomatic disease, neglect and lack of motivation. With a percentage of 7.69%, the articles presented factors such as the absence of care from a multi-professional team, beliefs and inadequate approach of the disease by the health professional. In this way, it can be concluded that several factors influence the treatment, especially the previously acquired alimentary habits and that these should be considered by the professionals, preserving the individuality of the patient” (Hansen, 2002). To maximise patient adherence, the goal is to use Patient Relationship Management (PRM) because, with this tool, healthcare organisations’ focus is set on determining and meeting patients’ needs. (Poku, Behkami, & Bates, 2017).
Health services play a crucial role in the health and well-being of users. A PRM system can be adopted by a public hospital and can prove to be a critical tool for leveraging patient satisfaction because it is designed to manage a complex ecosystem comprising legally independent partner organisations (Craig, 2008).
Patient Relationship Management (PRM) or Customer Relationship Management (CRM) for healthcare is a system design strategy said to have the potential to increase patient satisfaction and reduce healthcare costs (Mohiuddin AK, 2019).
3 Precarious care interfaces and process associations can lead to inefficiencies, which can lead to additional costs and may decrease the patient's experience. This may increase the hypothesis of error in clinical diagnoses. There is already recognition by many hospitals of using good practices in PRM practices coping with improved efficacy and efficiency of the healthcare process and respond directly to the needs and experiences of patients throughout the care pathway (West, Van Kleek, Giordano, Weal, & Shadbolt, 2018).
The use of the PRM will help to prevent the outbreak of new diseases, improve the quality of care and save time in the care process, which will result in higher patient satisfaction (Yousefi & Kargari, 2014).
4
2. LITERATURE REVIEW
2.1 Diabetes Mellitus
Diabetes mellitus is a chronic disease that can arise due to several causes such as a hereditary deficiency and/or acquired in the ability of the body to produce insulin by the pancreas, or even by the inability to produce it. These conditions result in increased blood glucose, which will cause various damage to many of the body's systems, especially blood vessels and nerves (Challis & Semple, 2013). According to the World Health Organization (WHO), there are two main forms of diabetes:
Type 1 Diabetes Mellitus (T1DM) (formerly known as insulin-dependent) is characterised β-cell destruction (mostly immune-mediated) and absolute insulin deficiency, developing most common in childhood and early adulthood (Irvine, 1977).
Type 2 Diabetes Mellitus (T2DM) (formerly non-insulin-dependent) diabetes results from the body's inability to respond adequately to the action of insulin produced by the pancreas. T2DM is much more common and accounts for about 90% of all diabetes cases worldwide. It occurs more often in adults, but it is also being noticed more and more in adolescents (Irvine, 1977).
When specific genetic markers were analysed, it was observed that they might increase the risk of developing T1DM When we talk about T2DM, it is perceived that it has a strong familiar component, but only recently have some genes been consistently associated with one increased risk of T2DM in specific populations (Whitfield, 2014). Both types of diabetes are complex diseases that can also be caused by mutations in more than one gene, or also by environmental factors. (Hansen, 2002). Impaired glucose tolerance (IGT) and impaired fasting glycemia (IFG) refer to situations where blood glucose levels are above the reference values but remain below the limit values at which diagnosed diabetes (McGraw & Lee, 2015). Individuals with IGT and/or IFG have a substantially higher risk of developing not only diabetes but also cardiovascular disease when compared to subjects with normal glucose tolerance. The benefits of clinical intervention in individuals with moderate glucose intolerance are a matter of great concern today (Tabak, Herder, Rathman, Brunner, & Kivimaki, 2014). Diabetes is found in every population in the world and all regions, including rural parts of low and middle-income countries. The number of people with diabetes is steadily rising, with WHO estimating there were 422 million adults with diabetes worldwide in 2014. The age-adjusted prevalence in adults rose from 4.7% in 1980 to 8.5% in 2014, with the most considerable rise in low- and middle-income countries compared to high-income countries (Irvine, 1977).
Also, the International Diabetes Federation (IDF) estimates that 1.1 million children and adolescents aged 14–19 years have T1DM (International Diabetes Federation, 2015). Without interventions to halt the increase in diabetes, there will be at least 629 million people living with diabetes by 2045 (International Diabetes Federation, 2015)
5
2.1.1 The Type 2 Diabetes Pandemic
T2DM accounts for between 90% and 95% of diabetes and it is a common and serious global health problem that has evolved in association with rapid cultural, economic and social changes, ageing populations, increasing and unplanned urbanization, dietary changes such as increased consumption of highly processed foods and sugar-sweetened beverages, obesity, reduced physical activity, unhealthy lifestyle and behavioural patterns, fetal malnutrition, and increasing fetal exposure to hyperglycemia during pregnancy. T2DM is most common in adults, but an increasing number of children and adolescents are also affected (Irvine, 1977).
T2DM management is complex and requires continuous efforts from both clinicians and patients to implement recommendations for self-management and pharmacotherapy to achieve evidence-based targets. For patients who have other chronic conditions in addition to T2DM, this complexity is amplified. This is important as T2DM rarely occurs on its own–multimorbidity (MM) (presence of ≥ 2 conditions) is the norm, with approximately 85% of those living with T2DM having at least one other chronic condition (Chiang et al., 2018)
In Portugal, the last document that dealt with these pandemic dates back to 2016, referring not to T2DM, but also type 1 diabetes and gestational diabetes.
According to the Annual Report of the National Diabetes Observatory - 2016 Edition, in 2015, the estimated prevalence of Diabetes in the Portuguese population aged 20 to 79 (7.7 million individuals) was 13.3%, which is more than 1 million Portuguese in this age group have Diabetes. It is essential to mention that, regarding the composition of the prevalence rate of Diabetes, in 56% of the individuals, this had already been diagnosed, and 44% had not yet been diagnosed (Observatório Nacional da Diabetes, 2016).
Figure 1 – PREVADIAB- SPD, OND Treatment (Adjusted to Population Distribution) (Observatório Nacional da
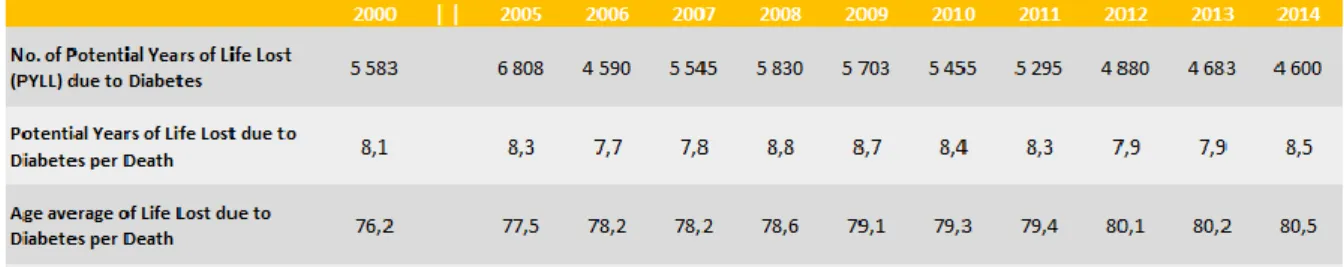
6 These data are of great importance since T2DM influences significantly the quality of life and mortality, if not see: although, in the last decade, there has been a significant decrease in the number of years of life lost by Diabetes Mellitus in Portugal (-32%), the truth is that in 2014 Diabetes represented about eight and a half years of life lost for each death by Diabetes in the population under 70 years, as can be seen in the figure below (Observatório Nacional da Diabetes, 2016).
Figure 2 – INE; Deaths from Causes of Death – Portugal; Potential Years of Life Lost (PYLL) due to Diabetes
Mellitus in Portugal. Adapted from (Factos e Numeros, 2016)
Nevertheless, Diabetes plays a significant role in the causes of death, accounting for 4.0% of deaths in 2015 (Observatório Nacional da Diabetes, 2016).
Another critical parameter is in-hospital mortality (it is the ratio between the number of deaths from a disease and the total number of patients suffering from this disease over a given period of time) in the NHS (49 334 deaths), in that Diabetes already represented in 2015, 25.9% of in-hospital lethality in the NHS (corresponding to 12,799 individuals), that is, more than ¼ of the people who die in hospitals have Diabetes (Observatório Nacional da Diabetes, 2016).
2.1.2 Costs of Diabetes in Portugal
According to the Portuguese Society of Diabetology, with the expected increase in the prevalence of Diabetes, all costs associated with this pathology will continue to increase, with implications both in the lives of individuals and their families, as well as in the Health Systems, in the Governments and Society as a whole. For this reason, much work will have to be done to reverse this trend.
Thus, the change will only be achieved through Prevention at all levels, and Prevention means intervention now! However, talking about Costs of Diabetes is not synonymous with talking about Health Costs with Diabetes, although the weight of Diabetes costs in the total of Health budgets is very representative (Bilandzic & Rosella, 2017).
Diabetes ends up weighing different perspectives in the State Budget:
• Indirect Costs for Society - Diabetes, like other chronic diseases, can lead to greater job abstinence or, in more complicated cases, end up with a chronic and permanent disability that makes a person's work-life shorter or even provokes death. Recent studies have shown that
7 the costs of loss of productivity to society are like the direct costs in the health sector as a result of Diabetes and related complications (Sociedade Portuguesa de Diabetologia, 2011). • Intangible Costs - These types of costs, also called psychosocial costs (including stress, pain,
and anxiety), have a very significant impact on the daily lives of diabetic patients. These costs are more difficult to quantify and translate into a reduction in the life expectancy and quality of life of individuals (“WHO | Diabetes mellitus,” 2010).
• Direct Costs for Health Systems: This category encompasses various types of costs such as primary care medical appointment, specialist consultations, hospital admission, emergency room visits due to diabetes decompensation, medications, test strips, syringes, needles and lancets, technical aids, namely prosthetic costs due to amputations and costs with complementary diagnostic and therapeutic means. This category also includes the costs of prevention: actions of education and health promotion, screening and therapeutic education (“WHO | Diabetes mellitus,” 2010).
There are more difficult costs to quantify, such as the costs of diabetes associated with complications, and are the most significant costs. Urgent care for reasons directly related to Diabetes also represents a cost that can only be quantified by analysing the admission processes in the emergency room. Even the cost associated with the medical appointment performed is not easily quantifiable since these medical appointments are dispersed in the Internal Medicine, Endocrinology, Nephrology and Ophthalmology medical appointment, although there is some autonomous Diabetes medical appointment (“WHO | Diabetes mellitus,” 2010).
The American Diabetes Association (ADA) had previously reported the costs of diabetes in the U.S. for the years 2002, 2007, and 2012. But in 2017 made an update. The most noteworthy findings from the report are the continuing increase and the remarkable magnitude of the total direct costs of diabetes in the U.S.: $116 billion in 2007, $176 billion in 2012, and $237 billion in 2017. The cost of care for people with diabetes now accounts for ∼1 in 4 health care dollars spent in the U.S. Care for a person with diabetes now costs an average of $16,752 per year. As in prior reports, the 2017 analysis also documents substantial indirect costs related to lost productivity due to diabetes and its complications. The 2017 analysis also indicates that, after adjusting for inflation, costs have increased since 2012 due to both an 11% increased prevalence of diabetes and a 13% increase of the cost per person with diabetes (Riddle & Herman, 2018).
In Portugal, despite not being able to measure all diabetes-related costs due to a lack of available information, some of the associated costs can be understood because they are easier to quantify. About hospital admission, the table below shows the variation of costs associated with hospitalisation in which Diabetes is always part of the equation (Observatório Nacional da Diabetes, 2016).
8 Figure 3 – GDH’s — ACSS/DGS; IMS Health; Infarmed; DGS; OND Treatment; Variation in costs associated with
hospitalisation when diabetes is a secondary factor to the central pathology. Adapted from (Observatório Nacional da Diabetes, 2016)
If we consider that the identified expenditure, according to the Diabetes Health Expenditure Framework - CODE-2 Study, corresponds to 50-60% of the total expenditure, Diabetes in Portugal in 2014 represented an estimated direct cost between EUR 1 300 - 1 550 million (maintaining figures for the previous year), which represented 8 to 10% of health expenditure in 2015 (Observatório Nacional da Diabetes, 2016).
2.1.3 Hospitalisation
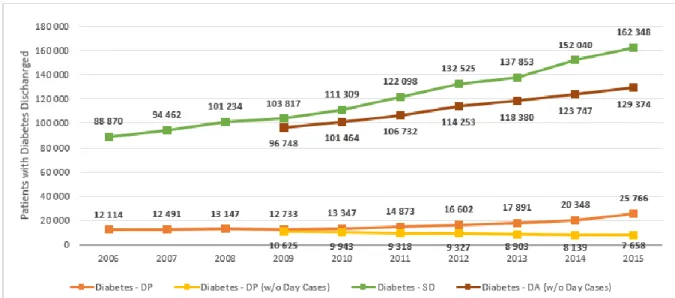
Acute complications of diabetes (hypoglycemia, diabetic ketoacidosis, hyperosmolar hyperglycemic syndrome, and lactoacidosis) cause recurrence of urgency and hospitalisation and are associated, in most cases, with medical complications and/or therapeutic failures (French, Donihi, & Korytkowski, 2019). They can be prevented by the continued education of the person with diabetes and their caregivers, but they remain a current problem, especially in the hyperglycemic crisis with vomiting and dehydration, due to their high incidence and mortality (Westerberg, 2013). Regarding hospitalisations, according to the National Diabetes Observatory Annual Report - 2016 Edition, the number of outpatients/hospitalisations in the NHS hospitals in which Diabetes is the main diagnosis (excluding Day Cases) decreasing significantly in recent years (-27.9% between 2009 and 2015). However, the number of outpatients/hospitalisations in which Diabetes remains as an associated diagnosis has shown a steady growth trend, present throughout the period under review (increased by 82.7% between 2006 and 2015). Besides, and even more worrying, it is the representativeness of Diabetes in
9 the universe of patients from NHS hospitals has increased in recent years, especially in hospitalisations lasting more than 24 hours (s / Day Cases) (Observatório Nacional da Diabetes, 2016).
Figure 4 – GDH – ACSS/DGS: Hospital morbidity statistics. Users out of NHS Hospital admissions with Diabetes.
Adapted from (Observatório Nacional da Diabetes, 2016)
As we can see in the following figure, Circulatory System Diseases, Endocrine Gland Diseases (including Diabetes), Respiratory System Diseases, Digestive Diseases, and Neoplasms represent most users with Diabetes out of the hospital in the NHS (Observatório Nacional da Diabetes, 2016).
10 Figure 5 – GDH's - ACSS / DGS; Number of Inpatients (Patients Left) T2DM - Associated and Main Diagnosis -
Continent - SNS; OND treatment. Causes for Inpatient Admission of Patients with Diabetes in NHS Hospitals. Adapted from (Observatório Nacional da Diabetes, 2016)
In addition to the public health problems demonstrated with this issue, this also entails significant expenditures for the state coffers, since the difference between the average duration of hospitalisations is also visible in the universe of hospitalisations diagnosed with Diabetes. The average length of stay of patients with Diabetes is generally higher than that of the average number of hospitalisations in NHS hospitals in Portugal in 2015 (with or without Day Cases) (Observatório Nacional da Diabetes, 2016).
2.1.4 Diabetes Self-management and Adherence to therapy
Looking at these data, the great concern that is imposed is how to face this situation in the various segments of society. There are two reasons cited as being determinants for this marked increase in T2DM in recent years, population ageing and lifestyle changes. There is evidence that changes in lifestyle such as unhealthy eating, and lack of regular physical activity associated with increased life
11 expectancy have been pointed out as responsible for the increasing prevalence of T2DM (Diair, Alexandre, Soares Tasca, Silva Marcon, & Kenji Nakamura Cuman, 2008);(Bodai et al., 2017). With the increase in the life expectancy of the person with diabetes, late or chronic complications arise if there is no specific care, namely in the prevention of them. Complications are a result of poor metabolic control and reach the arteries and peripheral nervous system. Late complications of diabetes cause high morbidity and mortality (Forbes & Cooper, 2013).
Diabetes self-management education (DSME) provides the foundation to help people with diabetes to incorporate and navigate treatment decisions and activities into their lives and has been shown to improve health outcomes (Brunisholz et al., 2014; Powers et al., 2015b)
Studies have found that DSME is closely associated with improved diabetes knowledge and self-care behaviours of diabetic patients, but also lower glycated hemoglobin or hemoglobin A1c (HbA1c) levels, lower self-reported weight, improved quality of life, healthy coping, and reduced health care costs (Cunningham, A.T., Crittendon, D.R., White, 2018).
The 2017 Standards of Medical Care in Diabetes recommends that each person with diabetes should be actively engaged in education, self-management, and treatment planning with his or her health care team, including the collaborative development of an individualised eating plan (Care Diabetes, 2018).
All individuals with diabetes should receive individualised monitoring from a registered dietitian. Often, DSME begins and ends with the primary care physician. However, the knowledge and support of a health care team are crucial for diabetes management (Brunisholz et al., 2014; Powers, Bardsley, Cypress, Duker, Funnell, Fischl, Maryniuk, & Siminerio, 2015).
2.1.5 Nutritional monitoring and therapy
Already in 2003, the World Health Organization has been pointing out that there is a strong association between weight gain, increased visceral fatness, sedentary lifestyle and the development of type 2 diabetes, emphasizing that habitual food consumption is one of the main factors susceptible to modification, relating to the development of chronic non-communicable diseases (Nogoy et al., 2018). Although there is a genetic influence on the development of the disease, it is indisputable, the prevention or delay in the development of T2DM among individuals who are carriers of risk factors impact on the quality of life of the population, with a reduction in public health costs with complications due to the evolution of the disease (Wu, Ding, Tanaka, & Zhang, 2014). Thus, several studies have shown that the association between weight control, diet, and increased physical activity decreases insulin resistance, thus reducing the likelihood of developing T2DM (Vetrivel Venkatasamy, Pericherla, Manthuruthil, Mishra, & Hanno, 2013). Also, data from the Pan American Health Organization (PAHO) show that this will be a more efficient measure than the use of drugs in primary prevention of T2DM (Nogoy et al., 2018).
Besides, several prospective studies have been conducted not only with T2DM patients in the United Kingdom (UKPDS) but also the studies performed with T1DM have demonstrated an association
12 between hyperglycemia and the development of T2DM complications and indicate that treatment that reduces hyperglycemia also reduces the risks of diabetic retinopathy, nephropathy, and neuropathy, i.e., all chronic complications associated with T2DM(Paneni & Lüscher, 2017).
In a study by Alameddine et al. (Alameddine et al., 2013), patients with T2DM completed a questionnaire, and although 75% of study participants believed that dietitians could assist them in changing their dietary habits, only 38% had consulted with a dietitian. Among the study’s participants, only 34% were referred to a dietitian by their physician. The main determinants of the use of dietary counselling services were a referral by a physician, the presence of outpatient social or private health insurance, and the belief that a dietitian can assist in changing dietary habits. Dietitians can help patients achieve glucose control through individualised MNT and DSME (Care Diabetes, 2018). The specific goals of DSME are as follows: teaching the basic concepts of type 2 diabetes, identifying and counting carbohydrates, maintaining healthy body weight, exercising regularly, and monitoring and controlling blood sugars. These concepts need to be taught according to the specific needs of each patient. The dietitian or certified diabetes educator (CDE) can counsel the patient individually to discuss ways to incorporate all these concepts into their daily routine (Chester, Stanely, & Geetha, 2018). They can provide patients with practical tools for day-to-day meal planning rather than focusing on individual nutrients. This helps patients create a new future lifestyle vs a short-term diet. The partnership between physician and a registered dietitian can help to inform patients regarding all the essential topics related to diabetes (Care Diabetes, 2018).
2.1.6 Food Frequency Questionnaire - 24h dietary recall
Diet is a major lifestyle-related risk factor of various chronic diseases. Dietary intake can be assessed by subjective reports and objective observation. Subjective assessment is possible using open-ended surveys such as dietary recalls or records or using closed-ended surveys, including food frequency questionnaires. Each method has inherent strengths and limitations (Ortega, Perez-Rodrigo, & Lopez-Sobaler, 2015) .
During the 1950s and 1960s, nutritionists began creating questionnaires aimed at assessing the usual intake of food consumed over a period. This has become a necessity due to the problems encountered in the 24-hour recall techniques that existed until then. After several improvements, reviews, and additional evaluations during the 1980s and 1990s, food frequency questionnaires (FFQ) became one of the leading research tools in nutritional epidemiology. No dietary method can measure food intake without error, so sources of error must be considered (Shim, Oh, & Kim, 2014).
In the past few decades, researchers have started to rethink how food intake should be assessed and interpreted. Historically, FFQ has been predominantly used in large cohort studies (Winpenny, Penney, Corder, White, & van Sluijs, 2017). According to Kirkpatrick et al. (Kirkpatrick et al., 2017), up to 64 % of the previous and ongoing Canadian studies rely on FFQ or dietary screeners, while only 14 % are using 24 h recalls. However, studies with recovery biomarkers have consistently reported that multiple 24 h recalls describing energy and protein intakes with higher precision than FFQ.
While several 24-hour recalls are considered costly and time-consuming, with new technologies available, including the web, now opening up a path to a new wave of self-administered automated
13 tools (Lafrenière, Laramée, Robitaille, Lamarche, & Lemieux, 2018). However, to be considered valid and reliable, they need to measure what they should measure consistently over time (Margetts & Nelson, 2009). On the one hand, they should provide an adequate estimate of nutrient intake and identify deficiencies (Gleason, Harris, Sheean, Boushey, & Bruemmer, 2010). On the other hand, they are also should capture regular intake. Therefore, reported energy consumption (rEi) must be consistent with the energy need to sustain normal activities.
2.2 Health Literacy and Health Promoting behaviours in Patients with T2DM
Diabetes is incurable; however, at least 80 per cent of chronic diseases, including diabetes, can be controlled through changing lifestyle and following health-promoting behaviours (Khuwaja et al., 2011). According to some evidence, one of the factors that can be related to lifestyle behaviours is health literacy (Von Wagner, Knight, Steptoe, & Wardle, 2007).
Health literacy is defined as the capacity and ability to obtain, process, and understand healthcare information to make proper decisions about health (Bains & Egede, 2011).
The evidence shows that the health literacy in patients with diabetes is in direct relation with our understanding about self-care and self-efficiency in disease management, (Inoue, Takahashi, & Kai, 2013) disease acceptance, adherence to treatment,(Inoue et al., 2013) self-management (Protheroe et al., 2016) and outcomes of more ideal health (Reisi et al., 2016). Other studies have suggested that low health literacy is associated with deteriorated blood sugar control, more severe side effects, weaker self-management of diabetes, more self-reported side-effects, weak patient-doctor relationship, longer period of hospitalization, more referrals to emergency care ward, reduced cases of proper consumption of medicines, and higher occurrence of various disease and morbidity rate. (Inoue et al., 2013), (Protheroe et al., 2016), (Reisi et al., 2016)
14
2.3 Implementation of Health Information Systems
The implementation of a health information system is a process whose success depends on a range of activities, including strategic planning, preliminary systems analysis, detailed specification design, user training and education, and a good selection of hardware and software (Ammenwerth et al., 2004). Increasingly, the position of the healthcare industry is becoming more important because of its association with human well-being and the complexity of patient health. Thus, it is becoming increasingly significant to treat this health sector like all other sectors where the concepts of CRM, customer satisfaction are well introduced and well implemented. With this, the objective is to see the changes and implications of these concepts in the health sector (Minvielle, Waelli, Sicotte, & Kimberly, 2014).
At their core, healthcare customer relationship management and physician relationship management solutions are dealing with different audiences, different motivators, and behaviours, different use cases. Not to mention, these technologies require different communication skillsets, workflows and address different topics (Poku et al., 2017).
According to (Elske Ammenwertha, Stefan Gräber, & Thomas Bürkle, 2004), for a system to be successful, there must be an organisational strategic plan for the development of the system. Implementing information systems and understanding health practices has proven to be a risky and perilous path with many stories to tell, more failures than successes, and the wider the technology, or the longer the application, the more difficult it is to achieve success. However, even in cases of evident technical difficulties, the question of whether the application is seen as a success or a failure is ultimately not a mere technical question (Ammenwerth et al., 2004).
According to Berg (2001), the elaboration and definition of an Information System must incorporate the collaboration of all involved people from all areas and not only the technical area of the institutions. For example, in the case of health care, groups such as doctors, nurses, clinical and administrative assistants may feel that the system does not fit and is not appropriate to their work routines (Berg, 2001).
2.4 Evaluation of information systems
“When we are talking about Information Systems, it has to be checked whether the system is meeting the objectives for which it was defined and how successful it was. The word success can be defined and viewed in various ways and points of view: economically, for example, by failing to budget or reducing costs, for not having failures during the day, etc. However, when you want to get a perfect system for all organisations, there is no specific recipe or type of best model, as each institution is unique and different compared to others, although there are always some aspects/traits. In successful systems(Bush, Lederer, Li, Palmisano, & Rao, 2009).
Ammenwerth, et al. (2004) ask themselves some questions when evaluating an IS, such as:
• Is the technology useful in the environment in which it develops and is it beneficial to its intended purpose? Do different groups such as doctors, nurses, or clinical staff, accept it and use it as they should? Do users have sufficient preparation for their use?
15 • How does technology affect the quality structure or process (time savings, data quality)? What
effect does this have on the quality of patient care?
• What is the amount of investment, operating cost, or return on investment (ROI)? • What are the system failure areas? Can these flaws be resolved?
• What are the organisational and social consequences of introducing IS? At the same time, these authors also mention some barriers to evaluation:
• Insufficient available assessment methods;
• Insufficient collaboration between evaluators from different areas;
• Costs and evaluation studies developed are usually insufficient and do not meet the requirements;
• Similarly, the organisational resistance encountered is an important barrier to IS assessment. Information technology assessment is typically performed in the healthcare environment, with different groups of professionals (such as doctors, nurses, administration, IT management, hospital staff, funding agencies, etc.), and is highly dependent. External factors such as legislation, economic constraints, or patients. This poses problems for evaluation projects. For example, different actors often have different ideas and views on IT. Both variables depend on the motivation of the stakeholders. This lack of motivation can sometimes be due to many reasons, such as fear of adverse outcomes, problems with previous technologies, etc., is revealed (Daly, Jackson, Mannix, Davidson, & Hutchinson, 2014).
2.5 Patient Relationship Management (PRM)
In recent years, patient involvement and health consumption have been important topics across the health sector.
Patient Relationship Management or Customer Relationship Management for healthcare is a system design strategy said to have the potential to increase patient satisfaction and reduce healthcare costs. We outline an innovative patient relationship management information system architecture. The primary principle of this architecture is modularity, thereby reducing implementation, maintenance and evolution effort and cost . Modularity is not only at system-level components but also at portal interface which provides an application development framework, to be used everyone interested from individual hospital departments to patient associations, in order make information available as well as new services to any end-users (Vardasca & Martins, 2011).
In 2015, HIMSS (a mission-oriented nonprofit organisation, global consultant, and opinion leader supporting the transformation of the health ecosystem through information and technology) prepared a study that confirmed that most health care providers considered patient involvement and should not only be part of the process but also part of their work. At the same time, these professionals also pointed out that lack of time and reimbursement were the biggest barriers. The apparent solution seems to be patient relationship management (PRM) technology because it automates many patient communications, allowing these interactions to be personalised, personalised and targeted (HIMSS, 2015).
With PRM, the focus of the health care organisation is determined to perceive and respond to the needs of the patient (Pramod Kumar S; NarendraT.V; Vinay N.A, 2017).
16 The PRM involves monitoring patient diet information and physical activity data, also allowing access to information from previous diagnoses, family history, and allergy information, which can be added or edited by the patient, enabling him to provide and search for information. By compiling this type of information, health care providers will be able to email patient information about newly published health studies that may be relevant to the patient or offer specific suggestions that fit the patient's profile patient (Pramod Kumar S; NarendraT.V; Vinay N.A, 2017).
The use of a PRM system in the health area can help promote disease education, prevention, and wellness services (Daliri, 2017). In addition to all these advantages, the proper use of this type of information can also help automate the operations of the call centre, so that routine advice on specific aspects of the service can be made available in the call centre without having to rely on the presence of the nurses or care physicians (Pramod Kumar S; NarendraT.V; Vinay N.A, 2017). One of the primary goals is that the use of a PRM system allows patients to email their caregivers and care about issues that relate to their health in order to receive responses with specific treatment options or only responses to their problem, facilitating follow-up by doctors or nurses (Pramod Kumar S; NarendraT.V; Vinay N.A, 2017). The biggest challenge is the ability of this to become sustainable in a public hospital setting. Health organisations should have a significant benefit and some potential to build such a relationship with patients (Vardasca & Martins, 2011).
Having a higher and better understanding of what the patient needs will help healthcare organisations deliver better care. This is essential for all health professionals who try to manage and prevent disease because personalised information can be shared more easily without having to advertise in a general way all the information about a specific disease for all the people who access a site or receive information bulletins. This type of personalisation will become a critical success factor in the health care sector and will serve as another option that health care providers start using as information systems to improve the care they provide (Pramod Kumar S; NarendraT.V; Vinay N.A, 2017).
Data from a Hospital Information System (HIS) should be used by a PRM to strengthen and sustain the relationship between hospitals and patients. Since most of the data required for the PRM is from the HIS, the PRM should be given special care and attention in integrating with HIS to allow maximum utilisation of the PRM's potential. If all the data collected can be analysed appropriately through data warehousing and multidimensional analysis technologies, health institutions can be able to foster closer relationships, personalised medical services and two-way communication with one another among patients and health professionals (Alkhazali & Hassan, 2015)
17
3. OBJECTIVES
3.1 General objectives
The main objective of this project is to find strategies that support the Win-Win model (patient, institution) to understand the importance of PRM associated with a specific nutritional protocol in adherence to therapy, and whether it is associated with effective health gains in T2DM outpatients consultation followed in the external diabetes consultation in Garcia de Orta Hospital, E.P.E.. This factor can become a differentiating agent, not only promoting a gain in health but also a decrease in public spending, avoiding recidivism and hospitalisation (Alderwick & Dixon, 2019).
3.2 Specific objectives
• How can regular monitoring increase adherence to nutritional therapy that translates into health gains when we speak of lifestyle-related chronic diseases such as T2DM?
18
4. METHODOLOGY
a) Study Design:
Epidemiological and interventional research study because including three elements: 1) definition and measure of exposure in two or more groups, 2) measure of health outcome(s) in these same groups, and 3) statistical comparison made between groups to assess potential relationships between the exposure and outcome, all of which are defined by the researcher (Thiese, 2014).
b) Population:
Type 2 diabetes outpatients followed in the external diabetes consultation in Garcia de Orta Hospital, E.P.E.
c) Sample:
Convenience Sample of all T2DM outpatients followed in the endocrinology service within the time frame established for the study and who agree to participate and use the proposed tools.
i. Tools:
• Blood Glucose Meter
o HbA1c values were evaluated according to the American Diabetes Association criteria (Of & Carediabetes, 2015)
• Patient weight was obtained using a TANITA® calibrated the electronic scale, with a maximum capacity of 150 kg and a minimum scale of 0.1 kg. Patients were weighed without shoes and with the least possible clothing.
• To measure height, a SECA® vertical stadiometer with a range of 1 to 2 meters and a 1 cm scale was used. The patient was measured barefoot, in an orthostatic position with feet together, right knees, arms along the body and head in a horizontal plane.
• Body Mass Index (BMI) was obtained in most patients and expressed as body weight/height squared (kg/m2). Malnutrition was defined as a BMI < 18,5kg/m2 for adult patients younger than65 years and < 22 kg/m2 for patients with65 years or older(). (Uccioli et al., 1994) • Application of the diabetes literacy questionnaire(Sousa, McIntyre, Martins, & Silva, 2015)
ii. Inclusion criteria:
• Patients with type 2 diabetes with more than one year of diagnosis; • Patients with ≥ 18 years;
• No insulin therapy;
19 • Self-employed patients who have a support system that allows the use of the proposed
evaluation tools
iii. Exclusion Criteria:
• Pre-diabetics or type 1 diabetics; • Patients outside the defined age group; • Insulin therapy;
• Refusal of the patient or impossibility to apply the proposed evaluation instruments.
d) Duration:
i. Data collection was done during April, May and June 2019 at the external diabetes consultation
of the Garcia de Orta Hospital, E.P.E. The consultation is held weekly, lasting 3 hours.
e) Data collection:
i. Inclusion in the present study was proposed to all patients followed at external diabetes
consultation in Garcia de Orta Hospital, E.P.E., who fulfil the inclusion criteria and sign the Informed Consent Term.
ii. The protocol was created for nutritional consultation, which had three intervention moments.
• T0 - First nutrition consultation - Measurement of HbA1c, BMI and weight; Application of literacy questionnaire to understand each patient knowledge and a 24h recall questionnaire to understand their habits;
• T1 - Second nutrition consultation (Three weeks after T0) – Only applied in Intervention Group (IG), served to reinforce nutritional therapy, clarify doubts and re-structure the nutritional plan, when necessary.
• T2 - Nutrition Reference and Measurement of HbA1c (6 weeks after T0) - Measurement of HbA1c, BMI and weight; Application of a 24h recall questionnaire to understand the evolution of their habits;
iii. The sample was divided into two groups: the control group and the intervention group:
• A Control Group (CG) in which both questionnaires were applied at T0 and body composition parameters (weight, BMI, HbA1C) were measured; They were reevaluated only at T2, repeating the 24h recall questionnaire and body composition parameters. A diet plan was prescribed in T0, but they did not receive text messages.
• An Intervention Group (IG) in which both questionnaires were applied at T0 and body composition parameters (weight, BMI, HbA1c) were measured; They were reevaluated only at T1, reevaluating needs and clarifying doubts. When necessary, there was a restructuring
20 of the food plan; They were reevaluated at T2, repeating the 24h recall questionnaire and body composition parameters. They received text messages every week.
iv. The application of a literacy questionnaire to understand the needs/doubts of T2DM patients
described in annexe 1:
• This questionnaire consisted of 7 themes (Identity, Causes, Duration, Treatment, Limitations, Control and Complications), each of which was divided into several questions that allowed to understand how much knowledge each user had about the disease. In addition, it allowed us to understand which are the major gaps and needs that would have to be addressed at the time of consultation at T0. This questionnaire was applied to both groups at T0 and was one of the parameters taken into account in the prescription of each patient's eating plan.
v. Apply a 24h recall food frequency questionnaire in order to perceive behaviours in both groups
that allow us to understand the evolution (or not) of the behaviour of each group.
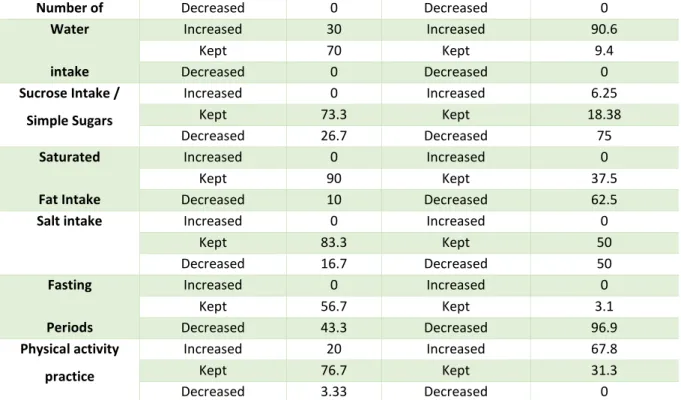
• This questionnaire consisted of a group of questions that comprised the following aspects: Meal Number of meals/day, Water Intake, Simple Sucrose / Sugar Intake, Saturated Fat Intake, Daily Fasting Hours, Physical Activity Practice, Salt Consumption and served to Understand Behaviours of patients at T0;
• The same questionnaire was done at T2, in order to perceive behavioural changes in each patient, and allow us to understand whether or not there was adherence to nutritional therapy.
• These questionnaires were applied to the entire sample at T0, until the time of the next appointment, all patients were treated the same. Before labelling, the envelope method was used to randomly distribute patients by IG or CG;
vi. The table in annexe 2 shows the text messages that were sent weekly to each individual
included in the IG:
• The text messages were created according to the parameters present in the literacy questionnaire that is given in T0 and the difficulties that are detected in each moment of consultation and evaluation. Thus, the text messaging system was created with the needs of each individual in the literacy questionnaire and the 24h food frequency questionnaire. • Once a week, each IG patient received a message from the subject in which she had shown
less knowledge or higher difficulty in complying when advised in consultation.
• These needs/questions/ difficulties were again evaluated in T1, adjusting the type/theme of messages sent to each user.
In the end, tools were applied and all criteria tested, was designed to be tested a model for the study in question, which had reference to another model (Naidu, 2009):
21 Figure 6 – Scheme adapted from the type of strategy adopted for the study. Processes and methodology
f) Statistical Methods:
It was used the Statistical Package for Social Sciences (IBM SPSS Statistics), version 21 IBM. The results are considered significant at a 5% significance level. To assess the normality of the data, we used the Shapiro-Wilk test. Descriptive statistics were used to evaluate the changes in the different parameters mentioned in the questionnaires, as well as the variation of glycated hemoglobin (HbA1c), weight and BMI. To compare the groups CG and IG, we used the Mann-Whitney U test.
To compare weight and BMI between the two groups, the Independent Samples test was used, since the assumption of normality of data in BMI categories is not verified. To compare the parameters between two moments, we used the Wilcoxon test.
22
5. ETHICAL CONSIDERATIONS
The Hospital Ethics Committee approved this study. All subjects were informed of the purpose and procedures of the study and gave their informed consent.
23
6. RESULTS
Evaluation in the day of first nutrition consultation (T0)
This study included 62 T2DM outpatients who were admitted for nutritional therapy through the external diabetes consultation in Garcia de Orta Hospital, E.P.E.: 39 men and 23 women, with ages ranging between 32-82 years (51 patients ≥ 50 years old) and a mean age of 59 years (SD=11.18). Patients were randomly divided into two groups using the envelope method: intervention group (IG) and control group (CG). From the total sample, several patients had at least one cardiovascular risk factor (n = 57), target organ complications (n = 21), or both (n = 19). Cardiovascular risk factors included hypertension (n = 54), ischemic heart disease (n = 5), dyslipidemia (n = 41), overweight (n = 30) and other risk factors (n = 46). As for complications of the target organs, they presented clinical nephropathy (n = 10), retinopathy (n = 5) and other complications (n = 14).
BMI: Of the total sample (n = 62), BMI ranged between 21.17 and 48.56 kg/m2, with a mean value of 32 kg/m2.
Weight: Weight was assessed in 62 patients, ranging from 52-143 kg. The mean value was 91 kg, with
a median of 90 kg. Of the total sample, 13 patients (21%) were overweight and 38 patients (61.3%) were obese.
HbA1c: From 62 patients, we found a mean HbA1c of 9 ± 0.4g / L, with values ranging from 5.6 to 13.9
g/L. The majority of the patients (n = 55, 88.7%) presented high HbA1c values, according to the reference values (Of & Carediabetes, 2015).
As can be seen in Table 1, the results of the diabetes literacy questionnaire showed that in practically all the parameters evaluated, excluding the “Limitations” parameter, most of the patients were able to answer the questions posed correctly, although it is almost 50%, which tells us that there is still a large percentage of people with a high degree of ignorance about T2DM. In the case of the limitations parameter, although the percentage of correct answers does not reach 50%, it is very close (48.4%).
Literacy Dimensions % Correct Answers % Wrong Answers
Identity 51.6 48.4 Causes 54.6 45.4 Duration 51.6 48.4 Treatment 54.2 45.8 Limitations 48.4 51.6 Control 55.9 44.1 Complications 51 49
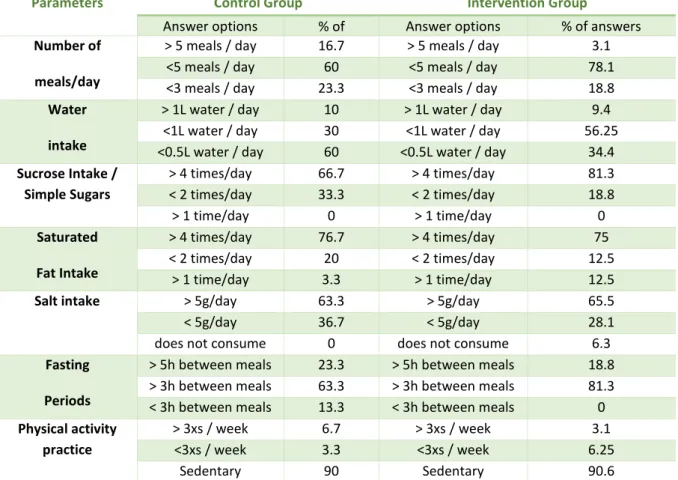
Table 1 – Results from the diabetes literacy questionnaire applied to the total population (n = 62) in T0 Regarding the second questionnaire applied to relate to the consumption habits of users, it was found that the groups had different results, as shown in the table below (2).
24 In the case of the CG concerning number of meals/day, 16.7% of patients responded that they had more than five meals a day, the majority (60%) answered that they had less than five meals a day and almost a quarter of the sample (23.3%) answered that they had less than three meals a day.
About water intake, 10% answered that they consumed more than 1L of water daily, 30% answered that they drank less than 1L and 60% of the population in this group answered that they drank less than 0,5L of water per day.
Regarding the intake of simple sugars/sucrose daily, the majority of the sample (66.7%) consumes more than four times daily, 33.3% consumes less than twice a day, and no patient has total restriction of this. sugar type (0%).
Another of the parameters evaluated was the daily consumption of saturated fat, where it was found that most patients (76.7%) consume saturated fat more than four times a day, less than twice a day 20% of patients and more than once a day, 3.3%.
With regard to daily salt intake, the majority of the sample (63.3%) consumes more than four times daily, 36.7% consumes less than twice a day, and no patient has a total salt restriction ( 0%) in your food.
When speaking during fasting periods, i.e., the number of hours the patient is without food throughout the day, it was found in the control group population that 23.3% of the patients are over five hours without food, most (63.3%) have not eaten for more than three hours and only 13.3% eat at intervals of less than 3 hours.
The last parameter evaluated was the regularity of physical exercise, where it can be verified that the majority (90%) of the population of this group is sedentary, that is, they do not practice physical activity regularly, 6.7% practice physical activity more than three times a week and 3.7% exercise less than three times a week.
Concerning the IG, it was found that concerning Number of meals/day, 3.1% of patients responded that they had more than five meals a day, the majority (78.1%) answered that they had less than five meals a day and almost a quarter of the sample. (18.8%) answered that they had less than three meals a day.
About water intake, 9.4% answered that they consumed more than 1L of water daily, 56.3% answered that they drank less than 1L and 34.4% of the population in this group answered that they drank less than 1L of water per day.
Regarding the intake of simple sugars/sucrose daily, the majority of the sample (81.3%) consumes more than four times daily, 18.8% consumes less than twice a day, and no patient has total restriction of this sugar type (0%).
Another of the parameters evaluated was the daily consumption of saturated fat, where it was found that most patients (75%) consume saturated fat more than four times a day, less than twice a day 12.5% of patients and more than once a day 12.5%.
With regard to daily salt intake, the majority of the sample (65.5%) consumes more than four times daily, 28.1% consumes less than twice a day, and 6.3% patient has total salt restriction on their diet.
25 When speaking about fasting periods, i.e., the number of hours the patient is without food throughout the day, it was found that in the intervention group population 18.8% of the patients are over five hours without food, most of them (81.3%) is more than 3 hours without eating and none of the patients eats at intervals of less than 3 hours (0%).
The last parameter evaluated was the regularity of physical exercise, where it can be verified that the majority (90.6%) of the population of this group is sedentary, that is, they do not practice physical activity regularly, 3.1% practice physical activity more than three times a week and 6.7% exercise less than three times a week.
Parameters Control Group Intervention Group
Answer options % of
answers
Answer options % of answers
Number of meals/day
> 5 meals / day 16.7 > 5 meals / day 3.1
<5 meals / day 60 <5 meals / day 78.1
<3 meals / day 23.3 <3 meals / day 18.8
Water intake
> 1L water / day 10 > 1L water / day 9.4
<1L water / day 30 <1L water / day 56.25
<0.5L water / day 60 <0.5L water / day 34.4
Sucrose Intake / Simple Sugars > 4 times/day 66.7 > 4 times/day 81.3 < 2 times/day 33.3 < 2 times/day 18.8 > 1 time/day 0 > 1 time/day 0 Saturated Fat Intake > 4 times/day 76.7 > 4 times/day 75 < 2 times/day 20 < 2 times/day 12.5 > 1 time/day 3.3 > 1 time/day 12.5
Salt intake > 5g/day 63.3 > 5g/day 65.5
< 5g/day 36.7 < 5g/day 28.1
does not consume 0 does not consume 6.3
Fasting Periods
> 5h between meals 23.3 > 5h between meals 18.8
> 3h between meals 63.3 > 3h between meals 81.3
< 3h between meals 13.3 < 3h between meals 0
Physical activity practice
> 3xs / week 6.7 > 3xs / week 3.1
<3xs / week 3.3 <3xs / week 6.25
Sedentary 90 Sedentary 90.6
Table 2 - Results from the 24h recall questionnaire applied to the total population (n = 62) in T0
Follow-up 6 weeks (T2)
Of the 62 patients who were evaluated, 100% returned for follow-up at T2. After six weeks of nutritional therapy (T2), 30 of the patients did not receive text messages and 32 received a weekly message to reinforce information about nutritional therapy.
Control Group:
This group had 17 men and 13 women, with age ranging between 43-80 years (27 patients ≥ 50 years old) and a mean age of 61 years (SD=10.27).