1
ANALYSIS OF THE RELATIONSHIPS BETWEEN OPERATIONS
STRATEGY PARADIGMS AND PERFORMANCE
Giovani J. C. da Silveira (1) and Rui S. Sousa (2)
(1) Haskayne School of Business, University of Calgary, 2500 University Drive NW, Calgary, Alberta T2N 1N4, Canada, giovani.dasilveira@haskayne.ucalgary.ca.
(2) Catholic University of Portugal (Porto) and CEGE, Rua Diogo Botelho, 1327, 4169-005 Porto, Portugal, rsousa@porto.ucp.pt.
ABSTRACT
We investigate the relationships between performa nce and three paradigms of manufacturing strategy choice: fit, best practices, and capability development. Dependent variables of performance include efficiency, quality, and flexibility. Regression analyses are used to test hypotheses of paradigm-performance relationships in a large database of international manufacturers. The results suggest that paradigms of capabilities and best practices have direct relationships with efficiency, quality, and flexibility. However, fit did not seem to be directly associated to changes in any performance variable .
Keywords : fit, capabilities, best practices.
INTRODUCTION
Since the late 1970s, researchers have been discussing the merits of using alternative paradigms at the time of designing or improving operations strategies. In a seminal paper, Voss (1995) identified three distinct paradigms of operations strategy, i.e. “competing through manufacturing”, “strategic choice”, and “best practice”. His study encapsulated a long-standing debate in the manufacturing strategy field. For example, Hill et al.’s (1998) study of strategic realignment in a pharmaceutical company suggested that improving marketing-manufacturing fit through changes such as increased batch sizes helped to boost competitiveness. However, Schonberger (1999) pointed out that such choices were inconsistent with accepted best practices, to which Hill et al. (1999) replied they were still appropriate because of the company’s market and industry background.
Despite the increased research on the three paradigms, we do not seem close to resolving that debate yet; we cannot tell what paradigm can best explain variation in particular performance dimensions. For example, Morita and Flynn (1997) and Ketokivi and Schroeder (2004) explored performance relationships with both best practices and manufacturing alignment, but did not incorporate capability scales in the analysis.
This study explores performance relationships involving the three manufacturing strategy paradigms. Specifically, we test the extent to which scales of fit , best practices, and capability development explain variation in efficiency, quality, and flexibility performance in an international sample of manufacturing companies.
2 FRAMEWORK AND HYPOTHESES
Fit
The idea of maximizing fit across business strategy, manufacturing priorities, and structural and infrastructural choices has been probably the most significant concern in manufacturing strategy since the early works of Skinner (1969) and Hayes and Wheelwright (1979). “Strategic choice” studies focused on aligning process and infrastructure with strategic variables to maximize competitiveness (Voss, 1995).
Several manufacturing strategy studies, e.g. Smith and Reece (1999), Lindman et al. (2001), da Silveira (2005) , and Brown et al. (2007) found significant performance relationships with either external (i.e. environment-structure) or internal (i.e. structure-organization) fit (such correspondence between Miller’s (1992) “external” and “internal” fit perspectives and manufacturing strategy concepts has been established by Bozarth and McDermott (1998)). They lead to the following hypothesis:
H1. Manufacturing strategy fit is positively related to manufacturing performance. Best practices
Research on “best practices” (BPs) in operations management came out in the 1980s as part of the effort to explain the success of Japanese manufacturing in Western markets (Voss, 1995; Laugen et al., 2005). According to Voss (1995), the concept of best practices has been often associated to “World Class Manufacturing” (WCM) (Hayes and Wheelwright, 1984; Schonberger, 1986). Examples of best practices include just-in-time, customer orientation, and advanced manufacturing technologies (Flynn et al., 1999; Narasimhan et al., 2005).
Several empirical studies provided evidence for relationships between BPs and performance. Flynn et al. (1999) found significant correlations between WCM practices and performance. Laugen et al. (2005) carried out an exploratory study to identify BPs based on their ability to explain improvements in quality, flexibility, speed, and cost. Narasimhan et al. (2005) found that manufacturing clusters with more intensive adoption of BPs also reported higher performance. This literature leads to the second study hypothesis:
H2. Best practices adoption is positive ly related to manufacturing performance. Capabilities
The idea of “competing through capabilities” in manufacturing has been introduced by authors such as Hayes and Pisano (1994) and Hayes and Upton (1998) who suggested that the true objective with manufacturing strategy was to build competencies for sustainable competitive advantage. Hayes and Pisano (1994) in particular were critical of implementing “faddish” programs such as just-in-time or Total Quality Management for short-term gains only, and even of relying on “strategic fit” in times of competitive turbulence.
Schroeder et al. (2002) tested a model of manufacturing capabilities and performance. They classified resources and capabilities in three categories including “proprietary processes and equipme nt”, “internal learning”, and “external learning”. They found that performance in manufacturing could be explained by the first type of capability, which in turn was explained by the two learning capabilities.
The study by Schroeder et al. (2002) followed on the lead of research that aimed at validating the capability building approach through its ability to support performance. Zahra and Das (1993) had earlier developed a framework where “distinctive competence” related to both “manufacturing
3
strategy” and “competitive advantage”, which in turn influenced business and financial performance. Thus , the framework considered both “top-down” (i.e. fit) and “bottom-up” (i.e. capability-based) approaches as necessary to sustain competitiveness. Several studies, e.g. Das and Narasimhan (2000), O’Regan and Ghobadian (2004), and Tracey et al. (2005) provided evidence for relationships between manufacturing capabilities and performance. They lead to the following hypothesis:
H3. Capability investment is positively rela ted to manufacturing performance.
DATA
The study uses data from the 2005 International Manufacturing Strategy Survey (IMSS-IV). IMSS is a global research program on operations strategies, practices, and performance. It is carried out periodically by operations strategy researchers from various countries and consolidated into a common database that is used by the network. Broad information about IMSS has appeared elsewhere, e.g. Voss and Blackmon (1998) and Frohlich and Westbrook (2001).
Twenty-three countries took part in IMSS-IV. However, one country had a very low response rate of 1% and had its responses dropped from this study. The 22 remaining countries were Argentina, Australia, Belgium, Brazil, Canada, China, Denmark, Estonia, Germany, Hungary, Ireland, Israel, Italy, New Zealand, Norway, Portugal, Sweden, the Netherlands, Turkey, UK, USA, and Venezuela. The y sent out 3,051 questionnaires, of which 698 (i.e. 23%) were valid returns. One further observation was dropped from the study as it had an extraordinary number of production days as work-in-process (z-score > 18), which would bias the FIT scale (discussed in the next session). Twelve country offices tested for demographic differences (size, ISIC) between respondents and respondents and found no significant results, suggesting the absence of non-response bias in the survey.
We tested for the potential of CMB through Harman’s one-factor test by factor analyzing the study’s 37 items (Podsakoff et al. , 2003). The analysis generated a large number of factors (k = 8, cumulative variance = 55% , n = 407), and the first factor in the unrotated solution explained just 23% of the variance. Thus, CMB did not appear to be of concern in our analysis.
MEASURES Fit
We selected IMSS-IV variables to estimate fit based on the Hill (2000) framework of process choice (see Appendix). In Hill’s (2000) terminology, the six identified variables include one “market-related” variable and five “manufacturing and investment” variables. The market variable – level of product changed required (CUSTOM) – captures the impact on manufacturing of a firm’s market positioning. Two variables – process choice (PCCHOICE) and work-in-progress inventory (WIP) – were adopted from da Silveira (2005). A third variable – process automation (AUTOM) – was used in place of level of capital investment (CAPINV) since (i) AUTOM had a significantly higher response rate than CAPINV in IMSS-IV and (ii) the two variables were significantly correlated in IMSS-IV (p = .001). We also included two other variables to widen the scope of our fit scale: percentage of direct labor costs (LABORCOST) and level of finished goods inventory (GOODSINV).
We calculated fit scores using the “Compute Variable” dialog in SPSS® 15.0 (SPSS, 2006). Following the rationale in Dess (1987) and adopted by Lindman et al. (2001) and da Silveira (2005), we developed first a MISFIT scale by taking the standard deviation among the six variables
4
of fit (note that high standard deviations correspond to low levels of fit). All of the variables were transformed to a 1-5 scale based on the observed maximum and minimum values in the sample . Moreover, CUSTOM, LABORCOST, and WIP scores were inverted since their high values corresponded to low values of PCCHOICE, AUTOM, and GOODSINV. Thus, MISFIT was obtained by the following expression in SPSS:
MISFIT = SD((6-CUSTOM), (((360-WIP)/90)+1), ((GOODSINV/90)+1),
((99.775-LABORCOST)/19.775), AUTOM, ((PCCHOICE/25)+1)) [1] As a last step, the scale of FIT was obtained by multiplying MISFIT scores by -1.
Best practices
We developed our best practices (BP) scale based on the work of Narasimhan et al. (2005). They identified seven variables of best practices representing a broad range of technologies and programs used in manufacturing. The seven variables were “Integrated technology development (ITD)”, “Statistical process control (SPC)”, “Quality culture (QCULT)”, “Just-in-time operations (JIT)”, “Strategic supply management (SSM)”, “Advanced manufacturing technology (AMT)”, “Customer oriented manufacturing (COM)” (Narasimhan et al., 2005: 1018).
The scale items are shown in Appendix. Our first attempt to validate a scale with all seven items was unsuccessful. The principal components analysis generated two components (one with six items , another with CUSTRD only; ORGINT loaded on both components). Besides, the Cronbach’s alpha for the seven-item scale was .671, which is not usually accepte d for scales based on the literature (Hair et al., 1998). After dropping CUSTRD from the scale, the analysis yielded a single component with eigenvalue greater than one and factor loadings ranging from .519 to .728 (n = 555). The Cronbach’s alpha for the six-item scale was .708, which is above the minimum threshold of .7 (Nunally and Bernstein, 1994; Lattin et al., 2003). Thus, the BP scale was calculated by taking the average between the six items of ORGINT, QPROGRAM, CI, PULL, SUPSTRAT, and FMS. Capabilities
The development of the manufacturing capability scale was based on the work of Schroeder et al. (2002). They studied the performance relationships of three types of manufacturing capabilities, namely “internal learning”, “external learning”, and “process and equipment”. They operationalized those constructs with measures of worker development, supply chain relationships, and manufacturing technology.
We built a scale composed by items of capability development in IMSS-IV that matched constructs in Schroeder et al. (2002) (see Appendix). In our capability (CAP) scale, Schroeder et al.’s (2002) “internal learning” and “process and equipment” were each represented by one item but “external learning” was represented by two items, i.e. one for suppliers and one for customers. In our first attempt, we did create a single “external learning” item given by the average answers given to those two questions; however, the resulting three-item scale had a low Cronbach’s alpha of .637. Moreover, studies such as Frohlich and Westbrook (2001) suggested that coordination with suppliers and with customers represented different types of strategies. Thus, we decided to incorporate the two items in separate.
Principal components analysis validated the CAP scale as the four items loaded on a single component with eigenvector greater than one and loadings ranging from .641 to .790 (n = 601). The Cronbach’s alpha was .703, suggesting the scale was reliable . Thus, the CAP scale was calculated by taking the average of responses given to the four items.
5 Performance
The dependent variables were obtained from the IMSS-IV question on manufacturing performance improvements: “How has your operational performance changed over the last three years?” Answers were given in a scale with five points: (1) “deteriorated more than 10%”, (2) “stayed about the same”, (3) “improved 10%-30%”, (4) “improved 30%-50%”, and (5) “improved more than 50%”. Responses were given to 20 items of performance. They were used to generate performance scales through exploratory factor analysis with principal components and Varimax rotation.
We carried out the analysis in four rounds to generate performance scales that were valid and reliable. In each of the first and second rounds, we dropped the one item (delivery speed, labor productivity) that had the highest significant cross-loading. In the third round, we dropped one item (capacity utilization) that did not load on any component. In the fourth round, we obtained three components with eigenvalues greater than one and no significant cross-loadings. Cronbach’s alphas were all greater than .7 and inter-item correlations were all above .4, suggesting that scales had acceptable reliability and consistency (Hair et al., 1998). Inter-item correlations were always higher than average correlations with items from other scales, indicating acceptable discriminant validity (Flynn et al., 1999; Wageman et al., 2005). The summated scales of EFFICIENCY, QUALITY, and FLEXIBILITY were calculated by taking the averages of their respective items (see Appendix).
ANALYSIS
Regression analyses were carried out to test hypotheses H1 to H3. Little ’s tests (Little, 1988) suggested data could be assumed to be missing completely at random (MCAR); thus, cases with missing data were dele ted listwise. Because of their high correlations, the independent variables of FIT, BP, and CAP were entered in separate in models 1 to 3 to assess their unique relationships with criterion variables. Standardized residual plots suggested no significant departures from normality in the models.
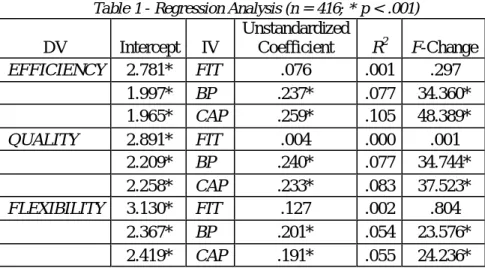
Table 1 - Regression Analysis (n = 416; * p < .001) DV Intercept IV Unstandardized Coefficient R2 F-Change EFFICIENCY 2.781* FIT .076 .001 .297 1.997* BP .237* .077 34.360* 1.965* CAP .259* .105 48.389* QUALITY 2.891* FIT .004 .000 .001 2.209* BP .240* .077 34.744* 2.258* CAP .233* .083 37.523* FLEXIBILITY 3.130* FIT .127 .002 .804 2.367* BP .201* .054 23.576* 2.419* CAP .191* .055 24.236*
Table 1 presents the regression analyses. H1 was not supported as FIT was not significantly related to any performance variable. H2 was accepted as BP related positively and significantly to EFFICIENCY, QUALITY, and FLEXIBILITY (p < .001). The results suggest that firms that used to a higher extent practices including quality programs, pull production, and organizational integration obtained higher performance improvements in a three-year period than firms that used those practices to a lesser extent. H3 was accepted as CAP related positively and significantly to EFFICIENCY, QUALITY, and FLEXIBILITY (p < .001). The results suggest that firms that more
6
intensively built on labor, equipment, supplier, and customer-related capabilities achieved greater performance improvements than firms that gave less emphasis to capability development.
DISCUSSION AND CONCLUSION
Collectively, the results suggest that building capabilities and adopting best practices (BPs) both have direct effects on all performance dimensions (quality, efficiency and flexibility), whereas fit has no direct relationship with performance. Therefore, developing manufacturing capabilities and adopting best practices seem to be at the core of producing manufacturing performance.
Given the results, one should question the role of fit in operations strategy. Using a previous edition of the research database used in our study, da Silveira (2005) found that fit appeared to relate to market share only and not to business performance metrics including return on sales and return on investment. In this connection, our results would support Hayes and Pisano’s (1994) view that fit alone cannot explain performance in manufacturing, especia lly if we consider current markets as increasingly more turbulent than in the past. Moreover, they conform to organizational studies, e.g. Habib and Victor (1991) and Barth (2003) that found no direct relationships between fit and performance. However, they would be at odds with studies that found direct effects of fit on business performance. One hypothesis is that fit enhances the impact of best practices and capabilities. A plant with incoherent choices (e.g. way off the diagonal in Hayes and Wheelwright’s (1979) product-process matrix) may have to consume substantial managerial resources in dealing with these inadequacies, resulting in an environment which may be less amenable to the effective development and deployment of best practices and production capabilities. Under this hypothesis , the studies that found links between fit and performance could be in fact detecting effects of fit through its interactions with existing best practices and capabilities in study samples.
Our results have important implications for research and practice. Concerning research, the results suggest that individual capability development and best practices relate directly to performance, whereas fit may have a support role for the other two approaches. In practical terms, managers are urged to pursue developments in capabilities and adopt best practices as a means to achieve operations improvements across a broad set of performance dimensions.
The study has some limitations, which in themselves provide opportunities for future research. First, longitudinal research would allow for scrutinizing the issues of causality and inter-paradigm dynamics in more detail. Second, resulting from the composition of our sample, our findings are strictly generalizable to producers of metal products, machinery, and equipment including transport equipment. Future research should examine other industries. Finally, by drawing on an existing database we had to adapt some variables to develop measures for our research constructs. Building on the conceptual blocks laid down by this study, future work might benefit from the development of eventually improved measures to test our model.
ACKNOWLEDGEMENTS
Giovani da Silveira’s research is supported by the Natural Sciences and Engineering Research Council of Canada (Discovery Grant #283134-04). Rui Sousa’s research has been supported by Fundação para a Ciência e Tecnologia and POCI 2010 (Programa Operacional Ciência e Inovação 2010). We thank Peter Sherer for comments and suggestions on a previous version of this paper.
7 REFERENCES
Barth, H. (2003), “Fit among competitive strategy, administrative mechanisms, and performance: a comparative study of small firms in mature and new industries ,” Journal of Small Business Management, Vol.41, No.2, pp. 133-147. Bozarth, C. and McDermott, C. (1998), “Configurations in manufacturing strategy: a review and directions for future research,” Journal of Operations Management, Vol.16, No.4, pp. 427-439.
Brown, S., Squire, B. and Blackmon, K. (2007), “The contribution of manufacturing strategy involvement and alignment to world-class manufacturing performance,” International Journal of Operations and Production
Management, Vol.27, No.3, pp. 282-302.
da Silveira, G.J.C. (2005), “Market priorities, manufacturing configuration, and business performance: an empirical analysis of the order-winners framework,” Journal of Operations Management, Vol.23, No.2, pp. 662-675.
Das, A. and Narasimhan, R. (2000), “Purchasing competence and its relationship with manufacturing performance,”
Journal of Supply Chain Management, Vol.36, No.2, pp. 17-28.
Dess, G.G. (1987), “Consensus on strategy formulation and organizational performance: competitors in a fragmented industry ,” Strategic Management Journal, Vol.8, No.3, pp. 259-277.
Flynn, B.B., Schroeder, R.G. and Flynn, E.J. (1999), “World class manufacturing: an investigation of Hayes and Wheelwright’s foundation,” Journal of Operations Management, Vol.17, No.3, pp. 249-269.
Frohlich, M.T. and Westbrook, R. (2001), “Arcs of integration: an international study of supply chain strategies ,”
Journal of Operations Management, Vol.19, No.2, pp. 185-200.
Habib, M.M. and Victor, B. (1991), “Strategy, structure, and performance of U.S. manufacturing and service MNCs: a comparative analysis ,” Strategic Management Journal, Vol.12, No.8, pp. 589-606.
Hair, J.F. Jr., Anderson, R.E., Tatham, R.L. and Black, W.C. (1998), Multivariate Data Analysis with Readings, 5th. Ed., Prentice Hall, Upper Saddle River, NJ.
Hayes, R.H. and Pisano, G.P. (1994), “Beyond world-class: the new manufacturing strategy,” Harvard Business
Review, Vol.72, No.1, pp. 77-86.
Hayes, R.H. and Upton, D.M. (1998), “Operations-based strategy,” California Management Review, Vol.40, No.4, pp. 8-25.
Hayes, R.H. and Wheelwright, S.C. (1979), “Link manufacturing process and product life cycles,” Harvard Business
Review, Vol.57, No.1, pp. 133-140.
Hayes, R.H. and Wheelwright, S.C. (1984), Restoring our Competitive Edge: Competing through Manufacturing, Wiley, New York.
Hill, T. (2000), Manufacturing Strategy: Text and Cases, 2nd Ed., Palgrave, Basingstoke.
Hill, T.J., Menda, R. and Dilts, D.M. (1998), “Using product profiling to illustrate manufacturing-marketing misalignment,” Interfaces, Vol.28, No.4, pp. 47-63.
Hill, T.J., Menda, R. and Dilts, D.M. (1999), “Reply to ‘Comment: using product profiling to illustrate manufacturing-marketing misalignment’,” Interfaces, Vol.29, No.6, pp. 129-132.
Ketokivi, M. and Schroeder, R. (2004), “Manufacturing practices, strategic fit and performance: a routine-based view,”
International Journal of Operations and Production Management, Vol.24, No.2, pp. 171-191.
Lattin, J., Carroll, J.D. and Green, P.E. (2003), Analyzing Multivariate Data, Thomson, Pacific Grove, CA.
Laugen, B.T., Acur, N., Boer, H. and Frick, J. (2005), “Best manufacturing practices: what do the best-performing companies do?” International Journal of Operations and Production Management, Vol.25, No.2, pp. 131-150.
Lindman, F.T., Callarman, T.E., Fowler, K.L. and McClatchey, C.A. (2001), “Strategic consensus and manufacturing performance,” Journal of Managerial Issues, Vol.13, No.1, pp. 45-64.
Little, R.J.A. (1988), “A test of missing completely at random for multivariate data with missing values,” Journal of the
American Statistical Association, Vol.83, No.404, pp. 1198-1202.
8
Morita, M. and Flynn, E.J. (1997), “The linkage among management systems, practices and behaviour in successful manufacturing strategy,” International Journal of Operations and Production Management, Vol.17, No.10, pp. 967-993.
Narasimhan, R., Swink, M. and Kim, S.K. (2005), “An exploratory study of manufacturing practice and performance interrelationships: implications for capability progression,” International Journal of Operations and Production
Management, Vol.25, No.9/10, pp. 1013-1033.
Nunally, J.C. and Bernstein, I.H. (1994), Psychometric Theory, 3rd Ed., McGraw-Hill, New York.
O'Regan, N. and Ghobadian, A. (2004), “The import ance of capabilities for strategic direction and performance,”
Management Decision, Vol.42, No.2, pp. 292-312.
Podsakoff, P.M., Mackenzie, S.B., Lee, J.Y. and Podsakoff, N.P. (2003), “Common method biases in behavioral research: a critical review of the literature and recommended remedies ,” Journal of Applied Psychology, Vol.88, No.5, pp. 879-903.
Schonberger, R.J. (1986), World Class Manufacturing: The Lessons of Simplicity Applied, Free Press, New York. Schonberger, R.J. (1999), “Comment: using product profiling to illustrate manufacturing-marketing misalignment,”
Interfaces, Vol.29, No.6, pp. 127-132.
Schroeder, R.G., Bates, K.A. and Juntilla, M.A. (2002), “A resource-based view of manufacturing strategy and the relationship to manufacturing performance,” Strategic Management Journal, Vol.23, No.2, pp. 105-127.
Skinner, W. (1969), “Manufacturing: missing link in corporate strategy,” Harvard Business Review, Vol.47, No.3, pp. 136-145.
Smith, T.M, and Reece, J.S. (1999), “The relationship of strategy, fit, productivity, and business performance in a services setting,” Journal of Operations Management, Vol.17, No.2, pp. 145-161.
SPSS® (2006), SPSS Base 15.0 User's Guide, SPSS Inc., Chicago.
Tracey, M., Lim, J.S. and Vonderembse, M.A . (2005), “The impact of supply -chain management capabilities on business performance,” Supply Chain Management, Vol.10, No.3/4, pp. 179-191.
Voss, C. and Blackmon, K. (1998), “Differences in manufacturing strategy decisions between Japanese and Western manufacturing plants: the role of strategic time orientation,” Journal of Operations Management, Vol.16, No.2/3, pp. 147-158.
Voss, C.A. (1995), “Alternative paradigms for manufacturing strategy,” International Journal of Operations and
Production Management, Vol.15, No.4, pp. 5-16.
Wageman, R., Hackman, J.R. and Lehman, E. (2005), “Team diagnostic survey – development of an instrument,”
Journal of Applied Behavioral Science, Vol.41, No.4, pp. 373-398.
Zahra, S.A. and Das, S.R. (1993), “Building competitive advantage on manufacturing resources ,” Long Range
Planning, Vol.26, No.2, pp. 90-100.
APPENDIX: STUDY SCALES. Independent scales
Fit
1. CUSTOM (Min = 1; Max = 5): Which of the following best describes the level of customisation of your dominant activity? (Tick one): (1) standard products; (2) modularized products; (3) platform products; (4) customized to some extent; (5) made entirely to customer’s specification
2. PCCHOICE (Min = 0; Max = 100): To what extent are your manufacturing activities organized in the following layout categories (indicated percentage of total volume): Dedicated lines __%
3. WIP (Min = 0; Max = 360): How many days of production (on average) do you carry in the following inventories: Work-in-process
9
4. AUTOM (Min = 1; Max = 5): Indicate degree of the following action programmes undertaken over the last three years [(1) none; 5 (high)]: Engaging in process automation programs
5. GOODSINV (Min = 0; Max = 360): How many days of production (on average) do you carry in the following inventories: Finished goods
6. LABORCOST (Min = .9; Max = 80): Estimate the present cost structure in manufacturing (NB: percentages should add up to 100 %): Direct salaries/wages __%
Best Practices
(Items 1-5): Indicate degree of the following action programmes undertaken over the last three years [(1) none; (5) high]:
1. ORGINT: Increasing the organizational integration between product development and manufacturing through e.g. Quality Function Deployment, Design for manufacturing, Design for assembly, teamwork, job rotation and co-location, etc.
2. QPROGRAM: Undertaking programs for quality improvement and control (e.g. TQM programs, 6σ projects, quality circles, etc.)
3. CI: Implementing Continuous Improvement Programs through systematic initiatives (e.g. kaizen, improvement teams, etc)
4. PULL: Undertaking actions to implement pull production (e.g. reducing batches, setup time, using kanban systems, etc.),
5. SUPSTRAT: Rethinking and restructuring supply strategy and the organization and management of suppliers portfolio through e.g. tiered networks, bundled outsourcing, and supply base reduction.
6. FMS: To what extent is the operational activity in your plant performed using the following technologies [(1) no use; (5) high use]: Flexible manufacturing/assembly systems – cells (FMS/FAS/FMC)
7. CUSTRD: To what extent do the following stakeholders collaborate with the R&D function in your product development process? [(1) no collaboration; (5) high collaboration]: Customers
Capabilities
Indicate degree of the following action programmes undertaken over the last three years [(1) none; (5) high]:
1. EQUIPCAP: Undertaking programs for the improvement of your equipment productivity (e.g. Total Productive Maintenance programs)
2. LABORCAP: Implementing actions to increase the level of delegation and knowledge of your workforce (e.g. empowerment, training, autonomous teams, etc.)
3. SUPPLYCAP: Increasing the level of coordination of planning decisions and flow of goods with suppliers including dedicated investments (in e.g. Extranet/ EDI systems, dedicated capacity/tools/equipment, dedicated workforce, etc.)
4. CUSTCAP: Increasing the level of coordination of planning decisions and flow of goods with customers including dedicated investments (in e.g. Extranet/ EDI systems, dedicated capacity/tools/equipment, dedicated workforce, etc.)
10 Dependent Scales
“How has your operational performance changed over the last three years?”[(1) “deteriorated more than 10%”, (2) “stayed about the same”, (3) “improved 10%-30%”, (4) “improved 30%-50%”, and (5) “improved more than 50%”]:
Efficiency
1. Unit manufactur ing cost 2. Procurement lead time 3. Procurement costs 4. Manufacturing lead time 5. Overhead costs
6. Inventory turnover Quality
1. Product quality and reliability 2. Manufacturing conformance 3. Environmental performance 4. Customer service and support 5. Employee satisfaction
6. Delivery dependability Flexibility
1. Mix flexibility 2. Volume flexibility
3. Product customization ability 4. Product innovativeness 5. Time to market