Application of the Fama French 3-Factor
model to the cryptocurrency and token
markets
Diana Mara Costa Coelho
Dissertation written under the supervision of Professor João
Freire de Andrade
Lisbon, 15th June 2020
Dissertation submitted in partial fulfilment of requirements
for the MSc in Finance, at Universidade Católica Portuguesa
ABSTRACT
Title of thesis: Application of the Fama French 3-Factor model to the cryptocurrency and token markets
Author: Diana Mara Costa Coelho
This study investigates the ability of the Fama French 3-Factor model in predicting the returns of the cryptocurrency and token markets. The dataset is comprised of 30 cryptocurrencies and 30 tokens with a timeframe starting at 13th of November 2018 and
finishing on the 15 of May 2020. In accordance to the methodology stablished in the original study, this analysis creates 6 portfolios based on the market capitalization and network to value transaction ratio in order to create the size and profitability factors, being followed by the creation of the 25 portfolios based on the same characteristics to analyse the behaviour of the model across different scenarios. The results for the cryptocurrency market show low prediction power, with all of the model’s factors not being significant in the cross-sectional regression. Moreover, the results in the token market show a high correlation across the size and profitability factors which made the analysis on this segment to follow an adapted version of what was performed for the cryptocurrency market. The size and profitability factors were analysed separately, and the results show an even lower prediction power compared to cryptocurrencies.
RESUMO
Título: Aplicação do modelo Fama French de 3 fatores no mercado de criptomoedas e tokens Autor: Diana Mara Costa Coelho
Este estudo investiga a capacidade do modelo Fama French de 3 fatores em prever os retornos dos mercados de criptomoedas e tokens. O conjunto de dados é composto por 30 criptomoedas e 30 tokens com prazo de 13 de novembro de 2018 a 15 de maio de 2020. De acordo com a metodologia estabelecida no estudo original, essa análise cria 6 portfólios com base na capitalização de mercado e relação de valor da transação da rede para criar fatores de tamanho e rentabilidade, seguida pela criação de 25 portfólios com base nas mesmas características para analisar o comportamento do modelo em diferentes cenários. Os resultados para o mercado de criptomoedas mostram baixo poder de previsão, com todos os fatores do modelo não sendo significativos na regressão transversal. Além disso, os resultados no mercado de tokens mostram uma alta correlação entre os fatores de tamanho e rentabilidade que fizeram a análise desse segmento seguir uma versão adaptada do que foi realizado para o mercado de criptomoedas. Os fatores de tamanho e rentabilidade foram analisados separadamente e os resultados mostram um poder de previsão ainda menor em comparação às criptomoedas.
ACKNOWLEDGMENTS
In the first place, I would like to thank my partner, Fouad, for all the fruitful discussions and insights he has provided during this study alongside his never-ending support and love in my journey. I also want to thank my long-time friend Patrícia for always being there whenever I needed the most.
Secondly, I am thankful to my parents and my brother for their continuous support and motivation during this important period of my life, and for everything they ever taught me. Lastly, I would like to thank to my supervisor, João Freire, for his support and help throughout all the steps in the elaboration of this dissertation.
CONTENTS
LIST OF TABLES ... v
LIST OF FIGURES ... vi
LIST OF EQUATIONS ... vii
APPENDIX ... viii 1 INTRODUCTION ... 1 2 LITERATURE REVIEW ... 3 2.1 Blockchain ... 3 2.2 Cryptocurrency ... 4 2.3 Tokens ... 5 2.4 Portfolio Theory ... 8 3 RESEARCH HYPOTHESIS ... 11
4 DATA AND METHODOLOGY ... 12
4.1 Factors Construction ... 13
4.1.1 Market Factor ... 13
4.1.2 Small minus Big (SMB) and High minus Low portfolios (HML)... 13
4.2 Model ... 14
5 RESULTS – PRESENTATION AND ANALYSIS ... 15
5.1 Cryptocurrency ... 15 5.1.1 Factor Analysis ... 15 5.1.2 Cryptocurrencies Analysis ... 17 5.2 Tokens ... 20 5.2.1 Factor Analysis ... 20 5.2.2 Token Analysis ... 21
5.3 Limitations and further research ... 25
6 CONCLUSION ... 26
REFERENCES ... 28
LIST OF TABLES
Table 1 - Fama-French Factors Summary Statistics ... 15
Table 2 - Correlation Between Fama-French Factors ... 16
Table 3 - Individual alphas ... 18
Table 4 - Cross-sectional results for cryptocurrencies ... 19
Table 5 – Fama French Factors Summary Statistics ... 20
Table 6 - Correlation Between Fama-French Factors ... 21
Table 7 - Individual Alphas Regression 1... 23
Table 8 - Individual Alphas Regression 2... 23
Table 9 - Cross-sectional results regression 1... 24
LIST OF FIGURES
Figure 1 – Small vs big cap portfolios mean returns ... 17
Figure 2– Risk vs Returns ... 18
Figure 3 - Small vs big cap portfolios mean returns ... 21
LIST OF EQUATIONS
Equation (1) ... 8
Equation (2) ... 9
Equation(3) ... 10
APPENDIX Appendix 1 ... 33 Appendix 2 ... 34 Appendix 3 ... 36 Appendix 4 ... 38 Appendix 5 ... 40 Appendix 6 ... 44 Appendix 7 ... 53 Appendix 8 ... 55 Appendix 9 ... 56
1 INTRODUCTION
Despite its brief history, the cryptocurrency market has caused a huge turmoil in the financial world as it represents a revolutionary approach for a safe and dynamic financial system without any form of regulatory control from governments. The use of the disruptive blockchain technology allows cryptocurrencies to function without a regulatory central agency while transactions are safely performed due to the proof of work mechanism. Moreover, smart contracts created in the blockchain environment offer companies a new alternative in raising funds that has shown incredible potential.
The technology immediately attracted virtual currency enthusiasts due to its transparency and immutability which protected transactions against tampering and allowing a decentralised financial system. However, despite being revolutionary, Bitcoin did not have an immediate impact on the global landscape as the financial system was still dealing with the aftermath of the 2008 crisis. When markets started showing signs of improvement, investors had lost confidence on the mainstream financial institutions and wanted to protect their investments against the next downfall. In this scenario, Bitcoin was seen as a promising investment. Its innovative technology had potential applications beyond the financial system and its value was not subject to the fluctuations in the traditional market.
Soon after Bitcoin started gaining momentum, new crypto coins were created using the same technology and the market for cryptocurrencies developed massively with around 2400 altcoins1 available by January 20202. However, differently from Bitcoin, some of the
new altcoins also had its own blockchain platform, which allowed for the easy development and execution of smart contracts. This enabled companies to raise funds through initial coin offerings (ICO), which works almost in the same way as an IPO. In an ICO, the company gives tokens in exchange for investment. Albeit being considered cryptocurrencies, the tokens do not hold value outside its platform and its utility depends on what the owner of the ICO decides.
Differently from the IPO, an ICO is considerably easier to perform. There is no regulatory oversight and checks on the company’s record and credibility, as long the company provides a white paper3 to back up its project it is deemed valid to perform an ICO.
This makes it an extremely risky investment, as no guarantee are given besides the word of
1 Altcoin is an umbrella term to all other cryptocurrencies except Bitcoin.
2 According to the data available on https://coinmarketcap.com/. Accessed on 15/05/2020
3 A white paper is a document that outlines what problem is the business trying to solve and how does it plan in achieving its goals
the company performing it. Nonetheless, ICOs attracted a lot of attention from investors raising around $11.4 billion in 2018 alone (Pozzi, 2019). As an example, the BAT (Basic Attention Token) ICO was able to raise $35 million selling all its available tokens in less than 30 seconds and the Filecoin ICO, considered to be the biggest one so far, raised $257 millions in only a month of activity.
However, the growth for cryptocurrencies and tokens was also marked by incredibly high volatility that led to extremely bearish scenarios such as the Bitcoin crash in 2013, when the price went from $1150 in November to less than half of it in December and only four years later would Bitcoin’s price surpass $1000 again. The crypto market suffered another strong crash in 2019 in which the market capitalization of the sector went from $830 billions in January to only $280 billions in February of the same year (Wu, Wheatley, & Sornette, 2018).
Alongside the extreme crashes, the market has also experienced a series of hacks that put the trust of investors in jeopardy. In 2011, Mt. Gox, one of the main Bitcoin exchanges at the time, suffered a massive attack in which the hackers artificially dropped the price of Bitcoin in the exchange from $17 to $0,01. The hacker bought around 2600BTC at the artificial price and leaked the usernames and hashed passwords of the investors on the internet. The token market was also affected by similar events, in June 2016 around $70 million were stolen from the DAO, which was supposed to work as a venture capital fund using smart contracts. Even though it was possible to retrieve the money to investors, the hack caused people to lose its confidence in the project which led to its failure.
These events raised concerns on the speculative nature of cryptocurrencies as it is not yet understood what the main drivers of their prices are and how does the pricing of this new type of financial asset behave under different conditions. Moreover, there are not many studies on the pricing of cryptocurrencies and even less attention is dedicated to analysing tokens besides the returns of the ICOs. Having that in mind and inspired by the research of Fama and French (1993), this work aims to analyse the suitability of Fam and French three-factor model (1993) in predicting the returns of both cryptocurrencies and tokens. Furthermore, this work also aims to analyse the differences on the fitting of the model between them.
Due to the different nature of cryptocurrencies and tokens, the original model was adapted and instead of determining the high minus low (HML) factor using the book-to-market ratio this work applies an network to value transaction ratio which takes into account the size of the coins according to their market capitalization and its network value to
transactions which, similarly to the book-to-market ratio, it is a way to gauge the under or overvaluation of the assets considered in this work.
2 LITERATURE REVIEW 2.1 Blockchain
The concept of cryptocurrency is still very recent, its first appearance was only in 2008 with Bitcoin. The creator Satoshi Nakamoto (whose real identity is unknown up to this day) was trying to develop a decentralized digital cash system after many previous failed attempts by others in creating digital cash without a centralized body. At the end of 2008, Nakamoto announced the success of his work using the innovative and disruptive blockchain technology and Bitcoin was launched in January 2009.
The blockchain technology in which the cryptocurrencies are based in is essentially a tamper-resistant database of transactions across a large number of nodes (Beck, 2018). The technology works by storing data into cryptographic blocks using a hash function which allows any size of information to be converted into a string of the same size. Bitcoin uses a SHA256 algorithm4 for hashing its transactions, however other altcoins use different
algorithms. These blocks can be connected and hashed together, forming a structured called Merkle Tree and as long as the hash at the root is known, it is possible to identify whether the data has been tampered or not.
The system security is based on a proof of work mechanism in which the nodes5 of
the network verify the validity of the transaction by checking if the hash of the data of the transaction performed is smaller than a set number. Only when consensus is achieved by the majority of the nodes the transaction is deemed valid and it is stored as a new block of data into the original hash that is then transmitted through the network. This check performed by the nodes makes the possibility of tampering any part of the original string of data almost impossible to conduct as any change would require a re-checking of the following blocks of transactions and that would all need to be concluded before the next block of data is added to the hash.
The nodes that do the checks are called miners and after performing this procedure they are rewarded with units of the cryptocurrency of the network which incentives more people to join it and also increases the difficulty of the checks performed inside it. The
4 SHA256 is a one-way cryptographic hashing algorithm that converts any data into a 256 bits string 5 A node refers to any device that stores blocks of data of the blockchain network
calculations performed on the constant checking requires a huge amount of machine power and are actually fairly costly which further prohibits people from trying to tamper any transaction. Currently, if someone were to perform a 51% attack, which means taking control of the majority of the hashing in the network and therefore being able to exclude or modify the transactions at will, it would cost $16 billion in hardware cost alone plus the 219 million Kwh per day the attack would consume 6.
2.2 Cryptocurrency
Cryptocurrencies are an internet based medium of exchange based on the blockchain technology and work in the same way as fiat currencies7 without the centralized body.
Investors can even create digital wallets8 in which they can store their coins and are able to
perform any financial transaction with it. Some altcoins also have some special characteristics such as Ether that can also be used to fuel the transactions that happen inside Ethereum and NEO, in which owners earns dividends on the amount they have stored in their wallets and the transactions made inside the network are paid with those dividends.
Not many studies have been conducted regarding the behaviour of cryptocurrency returns so far, however Urquhart (2016) was the first to suggest that the market is inefficient being later supported by Nadarajah and Chu (2017) and Tiwari et al. (2018). This implies that the market does not follow a random walk and therefore it is possible to analyse which factors have predictive powers. Nonetheless, considering that the crypto market is still very recent it can be considered to be still in development so it is possible that this observed inefficiency may change in the next years as the crypto market matures.
In order to assess the influencing factors on the behaviour of the cryptocurrency market it is important to understand whether it behaves as a currency or commodity. In a study conducted by (Dyhrberg, 2016) Bitcoin was compared against gold and the US dollar using GARCH9 models and the conclusion shows that most of its aspects react similarly to
gold. Furthermore, the crypto also possess hedging capabilities, react symmetrically to positive and negative news and the mining process supposedly mimics the production costs seem in precious metals. Baek and Elbeck (2014) go even further suggesting that crypto should be treated as a speculative commodity rather than a currency. Although, given it still
6 Data available at https://gobitcoin.io/tools/cost-51-attack/. Accessed on 05/02/20
7 Fiat currencies refers to a govern issued currency – or groups of governments- ex: EURO
8 Digital software that stores private and public keys and interact with a multitude of blockchain to enable its users to perform financial transactions and monitor their account balance.
have some fiat currency characteristics as well, Selgin (2014) suggests cryptocurrencies are a special new category called synthetic commodity money.
The current existing literature shows that volatility, volume and the returns for the previous two days are considerable drivers of the attention on the cryptocurrencies which translates as an effect on the price (Urquhart, 2018). Moreover, the number of tweets also seems to have an impact on the market (Shen et al., 2019) alongside uncertainties in the economic policy (Demir et al., 2018). The crypto market does not seen to be influenced by economic factors at all (Baek & Elbeck, 2014) and prices seen to react mostly to market sentiments (Dwyer, 2014; Shiller, 2005; Weber, 2014) which explains the instability experienced since its conception.
In the traditional financial market, the momentum strategy has been shown to have strong power in predicting returns, however this effect does not seem to hold for the digital market as according to Grobys and Sapkota (2019) it has no persistent momentum effect. Moreover, empirical testing shows that coins with smaller market capitalization have better profits than the ones with bigger capitalization (Zainuddin, 2020), which implies the presence of a size effect such as the one described in Banz’s (1981) work.
This opens the possibility of testing an adapted version of the Fama and French three-factor model (1993) in which the high minus low three-factor is substituted for an equivalent assessing metric that works for cryptocurrencies, the network to value transaction ratio (NVT ratio). The purpose of this work is then to test the applicability of a modified version of the Fama and French 3-factor model (1993) in predicting the returns of cryptocurrencies.
2.3 Tokens
Besides the use of blockchain for digital currencies, the technology also allowed the creation of smart contracts. The concept was first introduced by Nick Szabo in 1994, when he realized that any decentralised ledger could be used as a self-executable contract (Pratap, 2018). In these contracts, one can completely bypass the middleman as this type of contracts can automatically execute whatever is agreed on as long as the requested criteria are met, also its proper execution is enforced by the consensus mechanism. Albeit its conception a few decades ago, only now with the rise of cryptocurrencies and specially with the creation of the Ethereum platform that smart contracts are starting to grow in many different sectors.
In 2015 Vitalin Buterik created Ethereum, the first platform for blockchain, that similarly to Bitcoin had its cash system called Ether but it went beyond by allowing the creation and execution of any application in blockchain by using a Turing complete
language10. This was a breakthrough as it provided an environment for developers to
experiment with the potential applications of blockchain technology (Egbertsen, Hardeman, Hoven, Kolk, & Rijsewijk, 2016). Following Ethereum, many other platforms were created, such as Ripple and EOS, however until today the most utilized protocol for the development of tokens is still Ethereum’s ERC-20 (Saini, 2018).
Taking advantage of the potential uses of blockchain, businesses started using smart contracts to raise capital to fund their projects through initial coin offerings (ICOs) (Adhami, Giudici, & Martinazzi, 2018). The first ICO ever performed was for a digital currency and communications protocol platform called Mastercoin which raised $3.15 million in 2013. Since then, ICOs have become an increasingly popular crowdfunding method being able to raise around $800 million in less than thirty-five ICOs in January 2018 alone (Preston, 2018). However, the crypto winter at the end of 2018 caused countless tokens to become almost worthless. Moreover, a study published by the Satis Group stating that more than two-thirds of the ICOs were scams - although the vast majority of the money invested went to real projects - raised serious concerns about the credibility of this market. This had a severe impact on the ICO market, which at November of 2018 had raised only $0.36 billion out of the $11.8 billions raised during the year, being the worst result since May 2017 (Pozzi, 2019). The market has been stagnant since this period, however the 6th ICO report published by PwC
and Crypto Valley Association, suggests that it is actually experiencing a maturing phase in which there is a progressive institutionalization of ICOs as a crowdfunding instrument with an increase in quality projects.
This maturing process is followed by an increase on the number of security token offerings (STO) and initial exchange offerings (IEO) whilst ICO figures steadily decrease. In an STO, the token is legally considered as an actual security and the checks performed in the IPO are also applied in this process. The IEO, on the other hand, has the exchange house taking the major role of picking the most promising and viable projects to launch in its platform, it also allows other types of token to be used. Those new modalities were developed as a way to protect the investors against the many fraudulent projects.
In an ICO (or STO, or IEO), a company sells tokens of the application at a pre-specified price to investors that can either pay with fiat or cryptocurrencies. A token refers to a representation of a particular asset or utility inside a system and its concept is constantly utilized in everyday life; a store’s loyalty card, casino chips are all examples of a token. In
10 A Turing complete language refers to a programming language in which any kind of program can be written to solve any computational problem
the context of the cryptocurrency market, a token represents a unit of value that a company creates to enable users to interact with its products while it facilitates the distribution of rewards and benefits amongst all stakeholders (Mougayar, 2017).
Those tokens can have different properties depending on what the developer chooses, according to the Swiss Financial Market Supervisory Authority (FINMA) there are currently four main types: security tokens, considered in legal terms in the same way as traditional securities; Equity tokens that work in the same way as a normal stock, although due to the lack of regulation, it is hard to define what is legal and what is not; Utility tokens that provide access to the either a product or a service, also not a very common type as investors are expecting to make gains on the investment and payment tokens that are used only to pay for goods and services within the application. Tokens can also have the characteristics of more than one type and are called hybrid tokens in those cases.
A clear parallel can be drawn between traditional stocks and tokens, as both are used as a way to raise funds for a specific project, their value is tied to the company that has issued them and investors are enticed to invest on them according to the prospects of their returns. Furthermore, security and equity tokens are also subjected to regulatory oversight. Even many utility tokens are actually securities in disguise as they meet all the criteria on the Howey test11 and are actually labelled as utility to avoid the regulation ("What Are Utility
Tokens, And How Will They Be Regulated? – SFOX Edge", 2018). In a recent case, SEC filed a complaint against Telegram alleging that its token is an unlicensed security as Telegram classified it as a utility token in its ICO. It is clearly a blurry line, however for investment purposes, most tokens behave as actual securities. Even traditional financial assets are being tokenized to take advantage of the flexibility the digital environment provides as seen on the news of Apple, Facebook and Tesla stocks being available as ERC-2012 tokens in
the Ethereum platform in January 2019.
Currently the only research conducted in the field of pricing of crypto tokens was regarding the underpricing tokens experience during ICOs, similar to what happens in IPOs in the traditional financial market. However, given the many similarities between traditional shares and tokens this study aims to analyse the suitability of applying the Fama and French (1993) 3-factor model to predict the returns on tokens. In the analysis performed in this work,
11 The Howey test was created in 1946 to determine whether a transaction is classified as an investment. In case of crypto, SEC stablishes the use of this test to assess whether a token is a security or not
12 ERC-20 refers to the technical standards and rules all smart contracts within the Ethereum platform must follow
stablecoins13 such as tether are not taken into consideration as they are a virtual
representation of a traditional financial asset and therefore its returns are not the focus of this analysis.
2.4 Portfolio Theory
The idea of portfolio diversification is not particularly new, in 1660 Torriano already mentioned the existence of the idiom of “not keeping all the eggs in one basket” in his work called Piazza universal de proverbi italiani. Centuries later, Markowitz (1952) and Tobin (1958) laid what is considered today the fundamental concepts of asset pricing theory by creating the mean-variance model and the concept of diversification in which investors can decrease their exposure to specific risk through the diversification of their portfolios. Adding to their work, Sharpe (1964), Lintner (1965) and Black (1972) developed the capital asset pricing model (CAPM) by demonstrating that the market portfolio of all risky assets must be mean-variance efficient therefore allowing for a testable relationship between expected return and risk, this relationship is expressed by the CAPM formula in equation 1.
𝐸(𝑅𝑖) − 𝑅𝑓= 𝛽𝑖,𝑚(𝐸(𝑅𝑚) − 𝑅𝑓) (1)
In which 𝐸(𝑅𝑖) − 𝑅𝑓 is the excess return on a portfolio i, 𝐸(𝑅𝑚) − 𝑅𝑓 is the excess return of the market portfolio and 𝑅𝑓 is the risk-free rate. By analysing the equation for CAPM it can be noticed that the returns on a given portfolio relies on the risk-free rate and the beta coefficient, which is a measure of the volatility of the portfolio compared to the market (Fama and French, 1992). However, this model has been strongly criticized throughout the years as it assumes investors only care about mean and variance of the returns and that they only plan one period ahead which suggests either a quadratic utility function with the property of increasing absolute risk aversion or that individual risk assets are multivariate normal (Levy, 2006), which are both violated in practice (Harvey et al (2000)). CAPM’s relevance was summarized by Fama and French (2000) and despite many authors trying to improve on this model’s predictions, its empirical record remains very poor (Friend and Blume,1970) (Fama and French,1992). It is not very clear if the model's empirical failure is due to its controversial assumptions (Levy and Solomon 2000) or to its implementation (Fama and French, 2004), nonetheless researchers have identified misspecifications in the CAPM and many have found additional factors to be significant in explaining expected stock
returns (Banz, 1981) (Chan et al 1991).
Straying from attempts to loosen the CAPM's assumptions as in (Black, 1972), Ross, based on the lack of arbitrage opportunities and the law of one price, created a new model known as the Arbitrage Pricing Theory (APT) in 1976. The APT model is a multi-factor model that links the returns linearly to the factor loadings and therefore allows for multiple sources of systematic risk to be factored into the model, and its strength resides in allowing the addition of any number of factors that explain returns within a particular sample differently to the CAPM (Groenewold and Fraser, 1997). However, Ross (1976) highlights the importance of choosing economically meaningful factors. The APT theory can be expressed through equation 2.
𝐸(𝑅𝑖) = 𝑅𝑓+ ∑ 𝛽𝑖𝑗𝜆𝑗
𝑁
𝑗=𝑖
(2)
In which 𝜆𝑗is the risk premium investors demand for the risk they are taking and 𝛽𝑖𝑗 is the sensitivity of asset i to the market.
In the 1980's, researchers started to realize that other factors could help explain expected stock returns besides the market portfolio used in the CAPM. For example, Lakonishok (1991) suggests that BE/ME ratios have a strong significance in explaining the cross-section of average returns on the Japanese stock market and Basu (1983) finds that the E/P ratio has a significant power in explaining the cross section of average returns on the U.S. market. Furthermore, Berk (1995) further reinforces the importance of a firm's size, which is determined by its market capitalization, in explaining cross-sectional stock returns.
Following the idea that other factors could also explain returns, Fama and French (1993) proposed a three-factor model in which they show that both the market value of a firm (size) and the book-to-market ratio have a high predictive power in the stock returns that are not captured by the market premium in the CAPM. Thus, the Fama-French model can be considered as an extension of the CAPM, in which two additional factors that should be priced according to the APT (1976), are added. Fama and French also mention that their model captures evidence for a "distress premium", although without providing an explanation on why such a premium should be priced in the first place. Some authors suggest that the result obtained by Fama and French is a product of survivor bias (Kothari et al.1995) and data snooping (Black,1993). However, regardless of the controversies, many other studies confirmed the results presented by Fama and French, not just on the U.S. stocks, but also in other international markets such in the Italian Stock Exchange (Aleati et al.,2000), Indian
stock market (Connor et al.,2001), Australian stock market (Faff,2001). Moreover, Cochrane (2005) states that near arbitrage opportunities would arise if the Fama and French model did not hold.
In 1981 Banz noticed the existence of a size effect on stock returns as companies with small capitalisation usually outperformed the ones with big capitalisation on the American market. He assumed that this effect was due to the asymmetrical information between small and big firms and therefore, the higher returns obtained by small firms’ stocks were cause by information deficit. Moreover, the size factor is considered as a measure of profitability as smaller stocks yield higher expected return after controlling to book-to-market ratio, and the latter is associated with financial distress problems which is signalled when the BE/ME ratio is high. Fama and French (2004) also point out that momentum could be linked with stock returns which was explored by Carhart in 1997.
The Fama and French (1993) model passes both stages of the Friedman (1953) tests which clarifies the controversy regarding the choice of factors based on previous knowledge of their data, and the fact that the factors have some economic intuition behind them further reinforces their model. The model implies a linear relationship between returns and the factors which can be expressed as it is shown in equation 3.
𝐸(𝑅𝑖) − 𝑅𝑓 = 𝛽(𝐸(𝑅𝑚) − 𝑅𝑓) + 𝑆𝑖𝐸(𝑆𝑀𝐵) + 𝐻𝑖𝐸(𝐻𝑀𝐿) (3)
In which SMB is the difference between the return on a portfolio of small stocks and a portfolio of large stocks (Small Minus Big), HML is the difference between the return on a portfolio of high book-to-market ratio and a portfolio of low book-to market stocks (High Minus Low) and the factor loadings are 𝛽, 𝑆𝑖 and 𝐻𝑖 while the rest of the terms are identical to those of the CAPM.
In the work of Fama and French (1993), 6 portfolios are created according to the market capitalization and book to market ratio. However, in the case of coins and tokens, there is no way of calculating the book to market ratio as this new type of asset has no income such as traditional companies nor is it backed by a central bank or government such as fiat currencies. Given that the book to market ratio is used in the original model to assess whether a stock is over or undervalued, it can be substituted for an equivalent metric that can actually be estimated for cryptocurrencies such as the Network Value to Transaction (Vlastelica, 2017|).
The NVT ratio was conceptualized by Woo and Chris Burniske who were based on the idea that in traditional companies its utility is given its earnings and therefore for cryptocurrencies its utility would be given by its ability to move money. Considering this idea, the metric aims to measure the efficiency of cryptocurrencies as a medium of exchange and the ratio is calculated by dividing the market capitalization of the coin or token by the transaction volume on a given day following the same logic as the PE ratio (Vlastelica, 2017).
A high NVT ratio indicates that the currency is expensive in relation to its actual transaction value which can indicate market optimism or overvaluation and similarly, a low ratio indicates either a pessimistic view from the market or undervaluation. Due to its similar interpretation to the PE ratio, the NVT metric is often considered a PE for the crypto market and is commonly used by analysts in the sector (Vlastelica, 2017). However, the metric is not a perfect measure as the transaction volume is actually hard to properly quantify ("On the difficulty of estimating on-chain transaction volume", 2018) and the market capitalization is a flawed indicator of the size ("Market Cap: A Flawed Ranking System for Valuing Crypto | Op-Ed Bitcoin News", 2019). Despite its flaws it is still a straight forward way to analyse the price of different coins and tokens that is heavily adopted by the market (De Pace & Rao, 2020).
3 RESEARCH HYPOTHESIS
Currently the literature on asset pricing models for cryptocurrencies is extremely scarce, with the vast majority of an already small group of studies dedicating their attention to Bitcoin and sometimes Ethereum and Ripple. However, the entire crypto market has reached by May 2020 a market capitalization of $243 billions with altcoins alone being responsible for $80 billions of this value14. Considering its growing popularity, the size of the crypto
market is expected to keep increasing and therefore it is utmost necessary to analyse whether the existing pricing models are useful in predicting the returns in this new sector or its incredible volatile nature and fast paced dynamic required a new approach that better account for those factors than the traditional models.
Furthermore, the cryptocurrency market does not consist of only altcoins and Bitcoin. Tokens have also gained immense popularity in the recent years, becoming a common source
14 According to TradingView, “Cryptocurrency Market”,
of funding for companies nowadays and raising impressive amounts in a very short time spam through ICOs. As the token market increases and matures, tokens are getting increasingly more similar to traditional stocks and even its regulations converge towards the same path, hence the shift from ICOs to STOs and IEOs. However, despite its increasing popularity, no research was ever conducted regarding its pricing after the ICO stage and neither was the differences in their prices compared to the altcoins such as Bitcoin and Ethereum.
With those considerations in mind, this work can be summarized into three main hypotheses
H1 – There is a size effect and profitability premia represented, respectively, by the SMB
and HML factors in the cryptocurrency and token markets, as described in the Fama and French model (1993)
H2 – The 3-factor Fama and French model (1993) outperforms the CAPM model in
predicting the returns of cryptocurrency and token market
H3 – The average mean R2 of the 3-factor Fama and French model (1993) in the
cryptocurrency and token markets is similar to what is obtained in the original study
4 DATA AND METHODOLOGY
The data used in this work was all obtained from CoinGecko.com, which is currently one of the largest crypto data providers ("Best Crypto APIs for Developers", 2019) that still provide free access to its API, it also offers data on volume, price and market capitalization on both cryptocurrencies and tokens. The list with all the cryptocurrencies and tokens used in this study is available in Appendix 1. The risk free used on this project was the T-bill yield obtained in the U.S Department of Treasury website which is also used in Fama and French’s (1993) work. In total, 30 coins and 30 tokens are being used in this analysis, with a timeframe from 13th November 2018 to 15th May 2020. The timeframe selected is short due to the fact
that both the token and cryptocurrency markets are very recent and therefore very few tokens and cryptocurrencies are old enough therefore a bigger timeframe would imply in a much smaller sample size. Each asset group was calculated separately in order to analyse the fit of the Fama and French model in each case.
4.1 Factors Construction 4.1.1 Market Factor
The market factor is proxied by the CRIX index, which was created by Humbolt University in Berlin with the purpose of representing the cryptocurrency market movements as accurately as possible. It follows an adapted version of the Laspeyres construction in which the market capitalization is utilized instead of the price and amount. Each component of the index is weighted according to its market capitalization. Furthermore, the index uses a AIC15 and BIC16 criteria to determine the number of constituents in the basket which is
reviewed on a monthly basis to account for the fast pace changes in this sector (Trimborn & Härdle, 2018).
4.1.2 Small minus Big (SMB) and High minus Low portfolios (HML)
The SMB and HML factors available on French’s website are estimated using a sample of common stocks in which the effects of companies with smaller market capitalization outperforming the one with bigger capitalization and firms with high book to market ratio performing better than the ones with low book to market are already proven and well known and well known in the market. These effects are not yet studied for the cryptocurrency market and therefore applying those factors could lead to wrong results about the fit of the model. Therefore, in order to properly analyse the model and the significance of its explanatory variables in predicting the returns for this type of assets, it was decided to calculate manually the factors following the guidelines provided in Fama and French’s (1993) work and using data from the crypto market.
Following the framework stablish by Fama and French (1993), the coins and tokens in which the market capitalization is above the 90th percentile are considered to have large
capitalization while the bottom 10th percentile is classified as small capitalization.
Afterwards, each group is further divided into 3 quantiles based on the NVT ratio, the bottom 30th quantile is classified as low (called value in their work), the ones between 30th and 70th
quantiles are considered neutral and the rest above the 70th quantile is considered high (called
growth in their paper). The six portfolios are then created through the intersection of for those factors which generates the following combinations: S/L, S/M, S/H, B/L, B/M and B/H. The SMB factor is then determined by calculating the average return of the three small portfolios (S/L, S/M, S/H) minus the average return of the three big portfolios (B/L, B/M,
15 Akaike Information Criterion (AIC) compares the quality of a set of statistical models to each other 16 Bayesian Information Criterion (BIC) is a criterion for model selection among a finite set of models
B/H). The HML factor follows the same fashion, the average return of the two high portfolios (S/H, B/H) minus the average return of the two low portfolios (S/L, B/L). The returns for SMB and HML factors are given by formula 4 and 5.
According to Fama and French (1993), the portfolios are constructed in July of t year and its returns are calculated until June of t+1 year, afterwards they are reconstructed to adapt to changes in the markets. However, given the fact the analysed period is considerably short and the cryptocurrency market changes at a very fast pace, the portfolios were updated on a daily basis and daily value weight returns were utilized instead of monthly returns.
4.2 Model
The returns of a portfolio can be estimated using an adapted version of the CAPM model showed in equation 3 in the literature review. In this study, the model is applied to the intersection of 5x5 portfolios created based on the quintiles of the market capitalization and NVT ratio, following the approach described on Fama and French’s (1993) work. Each analysis is performed separately for tokens and cryptocurrencies.
𝐸(𝑅𝑠) − 𝑅𝑓 = 𝛽𝑀𝐾𝑇∗ (𝐸(𝑅𝑀𝑘𝑡) − 𝑅𝑓) + 𝛽𝑆𝑀𝐵∗ 𝐸(𝑅𝑆𝑀𝐵) + 𝛽𝐻𝑀𝐿∗ 𝐸(𝑅𝐻𝑀𝐿) + 𝜀 (4)
In which:
𝐸(𝑅𝑀𝐾𝑇) − 𝑅𝑓 – Market risk premium 𝑅𝑓 – Risk free
𝛽𝑀𝐾𝑇 – Market beta
𝛽𝑆𝑀𝐵 – Beta for small minus big portfolio
𝛽𝐻𝑀𝐿 – Beta for high minus low portfolio
𝐸(𝑅𝑀𝐾𝑇) – Expected return of the market portfolio 𝐸(𝑅𝑆𝑀𝐵) – Expected return of small minus big portfolio 𝐸(𝑅𝐻𝑀𝐿) – Expected return of high minus low portfolio 𝜀 – Error term
The R2 diagnosis obtained in the regression analysis indicates the quality of the fit of
the model. The close it is to 1, the best if the model the reflect the reality of the returns studied. The ANOVA test also further helps to understand how much in model is actually explained by the variables present. The significance level is measured by the p-value and the level is set to be 5% as it is used in the vast majority of the studies. Another element considered in this analysis is the Gibbons Ross Shanken (GRS) F test, which, alongside the
p-value, is used to test the if the model’s intercept values for all the regressions done are jointly equal to zero which indicates the efficiency of the model.
Furthermore, the results obtained for the variables included (SMB and HML) will also be checked with the same methodology as the one was performed for the entire model to observe whether small sized assets perform better than big sized assets in the same it happens in the stock markets and whether coins and tokens with high NVT ratio outperform the ones with low ratio as it also observed in the market.
5 RESULTS – PRESENTATION AND ANALYSIS
This chapter will discuss the characteristics of the elements in the different samples analysed, using their respective descriptive statistics in order to better understand the data being used to test the Fama and French model (1993). Moreover, the results of the regression analysis are also discussed and compared against each type of asset and in order to better assess the model fit, a comparison with the CAPM model is also made.
5.1 Cryptocurrency 5.1.1 Factor Analysis
The first analysis is performed on the Fama and French (1993) factors to understand their nature and whether it is in accordance with what is stated on the original work. The summary statistics listed on Table 1 show that the mean return for the SMB factor was positive but not significantly different from zero at the 5% level, according to a two-tailed t-test. Moreover, the mean return for the HML factor is negative and the mean is also not significantly different from zero at the 5% level. At a first look, these results do not indicate the existence of both a size effect and a profitability premium as described in Fama French’s work.
Moreover, both SMB and HML factors show medium skew (between 0.5 and 1) with very high kurtosis (>3) which is very close to what is also observed on the factors provided by the Fama and French website for the same time period. This indicates the distribution of the factors calculated for the crypto market follows a close pattern to what is observed on the traditional stock market. However, the factors for the cryptocurrencies have a higher standard deviation which implies that the crypto market has a higher volatility than the traditional market.
Table 1 - Fama-French Factors Summary Statistics
Mkt-Rf 0.18% 0.049 -0.620 9.692 0.741 0.459
SMB 0.05% 0.027 0.685 5.996 0.374 0.785
HML -0.45% 0.036 0.587 9.000 -2.535 0.011
Furthermore, another important element of the analysis is to check the correlation between the variables as it can severely impact the results obtained in the regression. A high correlation amongst any of the factors could lead to a high R2 which would be misleading as
it is not a faithful representation of the sample analysed. According to the correlation table listed in Table 2, none of the factors have a high degree of correlation, with the highest value being between HML and Mkt-Rf factors at 0.076 which is low and also similar to the results obtained from the factors available at the Fama and French website. This means that the results obtained in the regression are actually representative of the relationship studied.
Table 2 - Correlation Between Fama-French Factors
Mkt-Rf SMB HML
Mkt-Rf 1
SMB -0.011 1
HML 0.076 -0.063 1
Figure 1 shows the mean returns of the 6 portfolios created to calculate the SMB and HML factors. It can be clearly seen that there is no clear relationship between the returns of small portfolios and big portfolios which further reinforces what was already shown in the first analysis conducted in the crypto market factors, mentioned earlier in this work. Similarly, the relationship between the NVT ratio portfolios does not seem to follow any structure in both big and small portfolios, which also goes against what is described in the work of Fama and French (1993).
Figure 1 – Small vs big cap portfolios mean returns
5.1.2 Cryptocurrencies Analysis
The descriptive statistics for all 25 crypto portfolios are available on Appendix 2 of this study. The vast majority of the portfolios have medium skew and high kurtosis, following what was observed on the SMB and HML factors in the previous section and therefore also have heavy tails which are toward the right side of the distribution graph. The maximum and minimum values are fairly extremes in each portfolio, which shows high volatility, which was also observed in the factors analysed before.
Figure 2 displays the relationship between volatility and mean returns of the 25 portfolios analysed. As it can be seen, the portfolios with higher volatilities do not necessarily yield higher returns than the ones with lower volatility which is not in accordance to the expectation that the extra risk taken would result in higher returns. The minimum volatility observed in the sample is 4.35% which is considerably higher than the volatility of the S&P500 (1.78%) for the same period and it further shows how much more volatile the crypto market is compared to the traditional financial market.
-0.6% -0.4% -0.2% 0.0% 0.2% 0.4% 0.6%
Small NVT Medium NVT Big NVT
Big Small
Figure 2– Risk vs Returns
After conducting the initial analysis on the descriptive statistics of the sample analysed, the time series regression was performed in order to check the fit of the Fama and French model (1993) in predicting the returns of the crypto market. According to the results available in Appendix 4, the average R2 of all the portfolios is 0.230 which is considered low
as it implies that the model can explain, on average, only 23% of the results observed. Comparatively, the minimum R2 obtained in all regressions in Fama French’s (1993) work is
0.82. Moreover, the result is higher than the average R2 obtained with the CAPM model
which is 0.113 (available in Appendix 7). The mean alpha for the FamaFrench model is -0.001 and is worse than the result obtained with the CAPM model, which yields a mean alpha of -0.000001. The mean standard error is 0.058 for the Fama-French and 0.062 for the CAPM model.
Table 3 shows the individual alphas for each portfolio, in which it can be observed that only portfolios P14, P15, P21, P22 and P32 have alphas that are significantly different from zero at the 5% level. A statistically significant alpha implies that those portfolios consistently have excess returns not captured in what is predicted by the model and it is not due to coincidence, therefore the results obtained show that the model has is not able to explain all the returns in some portfolios. Furthermore, both the Fama-French and CAPM models pass the GRS (1989) F-test at the 5% level, indicating that the sum of all intercepts is jointly equal to zero and therefore suggesting the model is able to capture the expected returns in all portfolios together.
Table 3 - Individual alphas
Lowest 2 3 4 Highest -1.5% -1.0% -0.5% 0.0% 0.5% 1.0% 1.5% 0% 2% 4% 6% 8% 10% 12% M ean R et urns Volatility
Smallest 0.008* -0.007*** 0.001 0.000 -0.004
2 -0.004 0.010** -0.008*** -0.001 0.001
3 -0.001 0.000 -0.005* 0.002 -0.003
4 -0.011*** -0.001 -0.004 0.001 0.000
Biggest -0.006*** 0.001 -0.003 -0.001 0.001
Note: ***, **, * – significance at 1, 5 and 10% level.
Despite the lack of evidence of the size effect in the previous analysis, the results displayed in Appendix 4 show that the SMB factor is significantly different than zero at the 5% level in 20 of the portfolios analysed which indicates that the factor has some significant explanatory power. The HML factor is significant at the 5% level in 16 portfolios, so even though the HML factor does not display a clear relationship with returns in the initial analysis, it also has a close predictive power to the SMB factor. The Mkt-Rf factor is also significant in 19 portfolios. It can be noticed that all factors in the model are statistically significant in the majority of the portfolios analysed.
After the time series regression, the next stage of the analysis is running the Fama-Mcbeth (1973) cross-sectional regression of the results obtained in the first part. In this part, the estimates are expressed in daily percentages for the model analysed. According to the results displayed in Table 4, none of the factors is statistically significant at any level. This implies that there is no significant premium associated with the factors analysed and therefore they fail to be able to predict returns across different portfolios. Furthermore, the Fama-French model fails the F-test, suggesting that the factors are not a very fit into the model in the cross-sectional regression and suggesting that there are pricing errors embedded into it. The CAPM model also has no statistically significant factor and fails the F-test (Appendix 9).
Table 4 - Cross-sectional results for cryptocurrencies
Variable Coefficient Std. Error t-Statistic Prob.
α 0.003 0.005 0.588 0.563
βMkt-Rf -0.003 0.005 -0.739 0.468
βSMB 0.003 0.004 0.809 0.427
βHML -0.001 0.003 -0.414 0.683
Adjusted R2 -0.035 S.D. dependent var 0.005
S.E. of regression 0.005 Akaike info criterion -7.765 Sum squared
residual 0.000 Schwarz criterion -7.570
Log likelihood 101.063 Hannan-Quinn criteri -7.711 F-statistic 0.733 Durbin-Watson stat 2.625
Prob(F-statistic) 0.544
5.2 Tokens
5.2.1 Factor Analysis
Same as is was done with the cryptocurrencies data, the Fama and French factors are the first analysis conduct to understand their behaviour and how that might impact the results obtained. Also, similarly to the cryptocurrency model, Table 5 shows that the SMB factor has a positive mean and, according to the T-test, it is significantly different from zero at the 5% level which can indicate the existence of a size effect. The HML factor has a negative mean and it is also significantly different from zero at the 5% level as well, suggesting the lack of a profitability premia. HML shows the highest volatility across all of the factors. Both SMB and HML have high skew (>1) with HML showing a negative value, which means that the tail is situated on the left side of the distribution, both values are also similar to ones obtained with the Fama and French factors available at the website. However, the factors have lower kurtosis and much higher volatility than what is observed on the factors provided in the Fama and French’s website.
Table 5 – Fama French Factors Summary Statistics
Mean Stdev Skewness Kurtosis t value p-value
Mkt-Rf 0.18% 0.049 -0.620 9.692 0.741 0.459
SMB 6.67% 0.160 1.265 1.555 8.277 <0.001
HML -12.36% 0.222 -1.130 1.056 5.965 <0.001
It is also important to analyse the relationship across the different factors, to avoid a spurious relationship. Table 6 shows that SMB and HML factors have a significantly high correlation of -0.88, which can severely affect the time series regression results. In order to further assess the multicollinearity between the SMB and HML factors and their suitability to be used in the model analysed, it was necessary to calculate the variance inflation factor (VIF). The results yielded a VIF of 4.463 for HML, 4.527 for SMB and 1.032 for Mkt-Rf
which indicates a moderate (borderline high) multicollinearity between the SMB and HML factors. Due to this, the approach for tokens needed to be adapted as following the same methodology performed on cryptocurrencies will lead to serious mistakes and decrease the credibility of the results.
Table 6 - Correlation Between Fama-French Factors
Mkt-Rf SMB HML
Mkt-Rf 1
SMB -0.163 1
HML 0.112 -0.880 1
In Figure 3, it is possible to notice that similarly to what was observed on the cryptocurrencies analysis, there is no clear pattern that indicates the presence of a size effect or a profitability premia. The small market cap with small NVT portfolio has a much higher mean return than all the other portfolios but is not related to a size effect as it is not sustained on the other small portfolios. Both factors go against what is described in Fama and French’s (1993) work.
Figure 3 - Small vs big cap portfolios mean returns
5.2.2 Token Analysis
The descriptive statistics for all 25 tokens portfolios are available in Appendix 3 of this study. The majority of portfolios have high skew and extremely high kurtosis which further suggests that the token market is marked by extreme scenarios both negative and positive. The minimum and maximum values for returns in the portfolios are also very extreme which indicates that the token market is incredibly volatile, considerably more than what is observed in the crypto market.
-5.0% 0.0% 5.0% 10.0% 15.0% 20.0% 25.0%
Small NVT Medium NVT Big NVT
Small Big
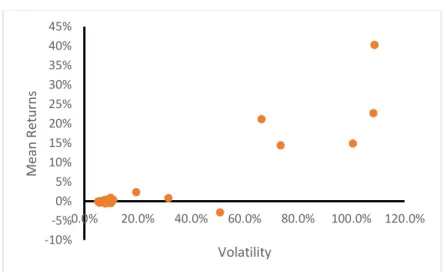
In Figure 4 is possible to analyse the relationship between the risk and returns on the 25 portfolios considered in this analysis. The data shows that the majority of the portfolios are clustered in the same area, however some of the portfolios with higher volatility yield considerably higher returns which goes in accordance to the risk return trade off. Moreover, the minimum volatility observed is 5.20% and the highest is 108.77%, both much higher than what was obtained for the crypto market implying that the token market is considerably more volatile.
Figure 4 – Risk vs Returns
The next step of the analysis is to perform the time series regression of the Fama and French model. However, given the high correlation detected between SMB and HML in the previous section of this work, the time series regression was performed separately for both factors in order to properly assess its results. Both regressions included the market factor as its correlation with either factor is low, and it does not affect the results obtained for the other factors. The regression with Mkt-Rf and SMB factor is referred as regression 1 and the one with Mkt-Rf and HML factor, as regression 2.
According the results available at the Appendix 5 of this work, the mean R2 for
regression 1 is equal to 0.070 and for regression 2 is 0.071, which are extremely low compared to the values obtained in Fama and French’s (1993) work and indicates that both models have almost no predictive power. The mean alpha is 0.014 and 0.004, respectively and the mean standard error is 0.262 and 0.261, also respectively.
Albeit the extremely low R2, the models analysed still performs better than the CAPM
model which yields a R2 of only 0.003, a mean alpha of 0.045 and a slightly higher mean
standard error at 0.278. Moreover, both models pass the GRS (1989) F-test alongside the CAPM model, which assumes that all intercepts (alphas) obtained in the regression are
-10% -5% 0% 5% 10% 15% 20% 25% 30% 35% 40% 45% 0.0% 20.0% 40.0% 60.0% 80.0% 100.0% 120.0% M ean R et urns Volatility
jointly equal to zero, at the 5% level and therefore implies that there are no embedded errors in all models.
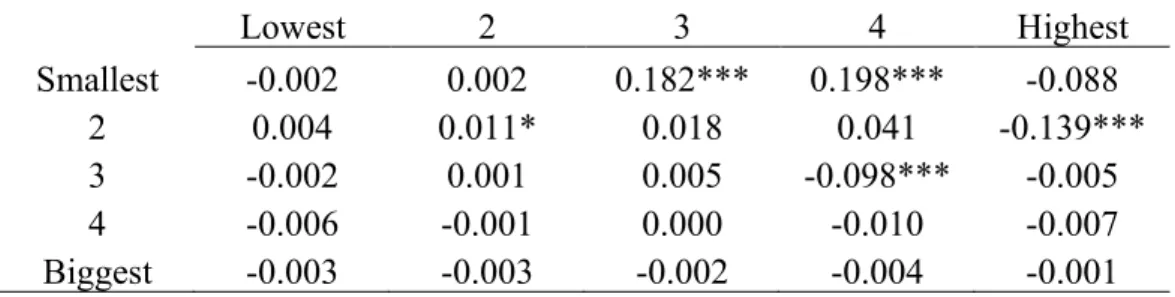
Table 7 shows that the alphas for regression 1 and Table 8 for regression 2. In the first regression, alpha is significantly different from zero at 5% level in 3 portfolios, indicating that the model is not able to completely explain the returns in the model in those portfolios. Similarly, the second regression shows that alpha is significantly different than zero in 4 portfolios.
Table 7 - Individual Alphas Regression 1
Lowest 2 3 4 Highest Smallest -0.002 0.004 0.194*** 0.251*** -0.020 2 0.003 0.009 0.016 0.077* -0.053 3 0.002 0.000 0.005 -0.083*** -0.002 4 -0.005 -0.001 -0.002 -0.011 -0.006 Biggest -0.002 -0.003 -0.005 -0.006** 0.000
Note: ***, **, * – significance at 1, 5 and 10% level.
Table 8 - Individual Alphas Regression 2
Lowest 2 3 4 Highest Smallest -0.002 0.002 0.182*** 0.198*** -0.088 2 0.004 0.011* 0.018 0.041 -0.139*** 3 -0.002 0.001 0.005 -0.098*** -0.005 4 -0.006 -0.001 0.000 -0.010 -0.007 Biggest -0.003 -0.003 -0.002 -0.004 -0.001
Note: ***, **, * – significance at 1, 5 and 10% level.
The results also show that the SMB factor is significant at the 5% level only in 9 portfolios in regression 1, which suggests that the size effect has very little predictive power in the model considered, as it is not a significant predictor is most portfolios. Following the same pattern, the HML factor is significant at the 5% level in only 7 portfolios in regression 2 implying that, alongside the SMB factor, its predictive power is considerably weak. The market factor is significant at the 5% level only in 4 portfolios in both regressions. It can be noticed that all factors are not statically significant in most of the portfolios which is opposite to what was obtained in the cryptocurrency analysis.
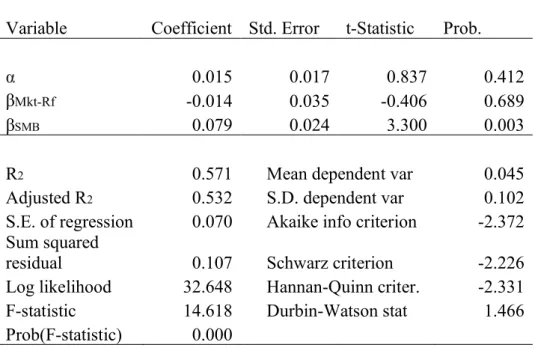
After running the time series regression, the next stage of the analysis is running the Fama-Macbeth (1973) cross-sectional regression of the results obtained in the first part in which the estimates are expressed in daily percentages for the model analysed. According to the results displayed in Table 9 for regression 1, both alpha and the market factor are not
significant at any level. The SMB factor is however significant to the 1% level, indicating that despite its weak results in the time series analysis, it has a risk premium and therefore is able to explain some of the difference in returns across the different portfolios.
The results in Table 10 shows the results for regression 2, the HML factor is significantly different from zero at the 1% level, however all the market factor and alpha are not significant. This suggests that the HML factor has a risk premium and similar to the results in regression, is able to explain returns across the different portfolios. Moreover, the Fama-French model passes the F-test, suggesting that the independent variables are good fit in the model while the CAPM model fails.
Table 9 - Cross-sectional results regression 1
Variable Coefficient Std. Error t-Statistic Prob.
α 0.015 0.017 0.837 0.412
βMkt-Rf -0.014 0.035 -0.406 0.689
βSMB 0.079 0.024 3.300 0.003
R2 0.571 Mean dependent var 0.045
Adjusted R2 0.532 S.D. dependent var 0.102
S.E. of regression 0.070 Akaike info criterion -2.372 Sum squared
residual 0.107 Schwarz criterion -2.226
Log likelihood 32.648 Hannan-Quinn criter. -2.331 F-statistic 14.618 Durbin-Watson stat 1.466
Prob(F-statistic) 0.000
Table 10 - Cross-sectional results regression 2
Variable Coefficient Std. Error t-Statistic Prob.
α 0.013 0.017 0.752 0.460
βMkt-Rf -0.010 0.036 -0.278 0.784
βHML -0.106 0.027 -3.863 0.001
R2 0.577 Mean dependent var 0.045
Adjusted R2 0.539 S.D. dependent var 0.102
S.E. of regression 0.069 Akaike info criterion -2.387 Sum squared
residuals 0.106 Schwarz criterion -2.241
F-statistic 15.021 Durbin-Watson stat 1.436
Prob(F-statistic) 0.000
5.3 Limitations and further research
One of the main limitations of this study was the sample size. The sample size was short due to the difficulty in extracting data through Coingecko’s API, however it is possible to develop a code that can extract all the data available on the website and that would allow to utilize a considerably bigger sample size. This would result in a much better representation of the crypto and token markets.
The short timeframe is also considered a main limitation. Both the crypto and token markets are also very recent and therefore very few of its components are available for a longer period of time. Ideally, an analysis of this nature would require around 3-5 years of data returns in order to properly assess its behaviour during both bearish and bullish scenarios. Moreover, the period considered in this work is encompasses the crypto winter in 2019 so the results are reflecting almost exclusively a bearish market and therefore results can be considerably different when considering different market conditions.
Moreover, the Fama French model is adapted using the NVT ratio instead on the PE ratio as in the original work due to the nature of cryptocurrencies and tokens. However, the NVT ratio is a metric used for the crypto market and therefore its suitability for the token market is questionable. This is further highlighted by the high correlation observed between the SMB and HML factors in the token analysis. This correlation is not observed neither in the crypto market nor in the original Fam and French (1993) work.
Given the shortcomings of this study, further research on this topic should focus on utilizing a longer timeframe with a bigger sample in order to have a better representation of the market. Different metrics to calculate the HML factor should be considered as well. Furthermore, the analysis the fit of the Carhart 4-factor model and Fama and French 5-factor model in the cryptocurrency and token markets is also highly suggested. It would also be interesting to analyse the performance of the Fama-French model against different types of tokens.
6 CONCLUSION
In the cryptocurrency market analysis, there was no evidence suggesting the existence of a size effect as the positive mean return of the size factor is insignificant at the 5% level. Moreover, the comparison across the 6 portfolios created on size and NVT demonstrates that the big portfolios outperforms the small ones in several instances. This result goes against the expectations as the size effect was empirically tested, however it does seem to hold across different portfolios. There is also no suggestion of the existence of a profitability premium as the mean return is negative and statistically significant, the high NVT portfolio is also outperformed by the low portfolio.
After performing all the necessary steps in assessing the suitability of the Fama-French model in the cryptocurrency market, it is possible to conclude that albeit performing marginally better than the CAPM model used in the comparison, the Fama-French 3-factor model still does not have a high explanatory power and therefore it is not considered a good fit for future applications. The mean R2 is considerably low although the model passes the
GRS test which implies the lack of pricing errors in the time series regression. Moreover, none of the variables was significant in the cross-sectional regression indicating that there is no significant premium associated with any of the factors and the model fails the F test in the cross-sectional regression, meaning that the model has low predictive power across different portfolios.
In the token market analysis similar results to the cryptocurrency market were observed. There was no clear evidence of the existence of a size effect or profitability premium, as the model yielded a neglectable mean R2 value and no pattern was found across
the 6 portfolios sorted on size and profitability. There was also a strong correlation across the 2 factors, suggesting that the NVT ratio was not an appropriate choice to proxy the PE ratio used in the Fama French (1993) model.
Due to the high correlation observed, the model was adapted and each SMB and HML factors were analysed separately alongside the market factor. Both models performed even worse than what was observed in the crypto market with a much lower R2 albeit passing the
GRS test in the time series regression. In the cross-sectional regression, the model also has significant HML and SMB at the 1% level, indicating that those variables have an associated premium in the returns across the portfolios, although its predictive power is extremely weak in the time series regression. Meanwhile alpha is not significant in the regressions which means that there are no significant unexplained excess returns. Both models also perform
slightly better than the CAPM model in both stages of the analysis. These results suggest that the variables in the model have some predictive power, however it is extremely low to be practically used in further analysis on the topic.
The Fama and French 3-factor model performed poorly in both the cryptocurrency and token markets yielding considerably low mean R2 in all cases analysed. Furthermore, the
factors were not significant in the cross-sectional regression in the cryptocurrency market and no size effect or profitability premium were observed throughout the study. However, the Fama French 3-factor model performs better slightly than the CAPM model in both markets analysed. With these considerations in mind, further research is highly recommended in order to assess other factors influencing returns in the crypto and token markets.