2019
UNIVERSIDADE DE LISBOA
FACULDADE DE CIÊNCIAS
DEPARTAMENTO DE BIOLOGIA ANIMAL
Metabolomics of Menopause in HIV-infected women
Cláudia Alexandra Ferreira Nunes
Mestrado em Biologia Humana e Ambiente
Dissertação orientada por:
Doutora Judit Morello Bullón
Professora Doutora Deodália Dias
III
Agradecimentos
O apoio e a contribuição de inúmeras pessoas foram imprescindíveis para o desenvolvimento desta dissertação e por isso aqui deixo os meus sinceros agradecimentos.
Primeiramente, agradeço à Doutora Judit Morello Bullón, pela orientação prestada ao longo desta dissertação, todo o apoio e disponibilidade que me prestou e por me ter introduzido ao mundo da metabolómica.
À Professora Doutora Sofia de Azeredo Pereira, por me ter integrado no grupo de Farmacologia do Centro de Estudos de Doenças Crónicas (CEDOC) e por toda a simpatia, apoio e ensinamentos que me transmitiu.
À Professora Doutora Alexandra Maria Moita Antunes, por me receber no Centro de Química Estrutural do Instituto Superior Técnico e a todo o seu apoio e explicações de química.
Sem esquecer da Dra. Umbelina Caixas, por toda a sua extrema simpatia, ajuda e disponibilidade e por me ter dado a conhecer um pouco do seu mundo clínico.
À Professora Doutora Deodália Dias, por ter aceite ser minha orientadora ao longo deste ano e por toda a atenção prestada.
Agradeço também ao grupo de Farmacologia do CEDOC, Catarina, João, Nuno e Clara por me integrarem no grupo e por toda a ajuda que me prestaram no laboratório.
À minha colega de tese, Sara Martins, por me ouvir e me apoiar todos os dias; à sua companhia e a todas as nossas conversas geek.
Aos meus pais pelo constante apoio e por sempre acreditarem em mim.
Aos meus irmãos por ouvirem sempre os meus desabafos, mesmo que não queiram muito. Às minhas amigas, Ana Filipa, Andreia, Correia, Gracinha, Natacha e Vanessa, que apesar de estarem longe, estão sempre presentes para tudo!
Às minhas 친구s por também me acompanharem e me apoiarem durante este período.
E todas as demais pessoas que estiveram presentes e que me apoiaram de qualquer forma ao longo desta etapa.
Obrigada a todos! “Dream 결국 시련의 끝에 만개하리 Dream 시작은 미약할지언정 끝은 창대하리” - 민윤기
IV Agradeço também ao Roteiro Português de Infraestruturas de Pesquisa Científica de Interesse Estratégico (categoria 1 – ref ROTEIRO/0028/2013) pelo acesso ao nó da RNEM do IST (RNEM-LISBOA-01-0145-FEDER-022125). Este trabalho foi apoiado da Fundação para a Ciência e Tecnologia (FCT) através dos projetos UID/QUI/00100/2019 (para o Centro de Química Estrutural) e UID/MULTI/04046/2019.
V
Abstract
The reproductive aging process in females consists in three major phases: the premenopause corresponding to the reproductive years, the perimenopause that consists in the transition to the final phase, the postmenopause that begins at menopause diagnosis.
Postmenopause is known for both its distinctive hormonal and metabolic changes, primarily the well-known estrogen loss. This change triggers the loss of the protective effects that estrogen confers to women and raises the risk for the development of diseases, specifically, cardiovascular diseases by lipid profile alterations. This status has been mainly studied through assessments of differences between premenopause and postmenopause. However, it is reported that most of these changes occur earlier, especially during late perimenopause. For this reason, studies between perimenopause and postmenopause are of interest to better assess this transition.
HIV infection results in the loss of cell-mediated immunity, which favors the acquisition of opportunistic infections that will irremediably cause the death of the patient. It is reported that over 32 million people have died due to HIV and approximately 37.9 million currently live with HIV-infection. However, thanks to the development and introduction of antiretroviral therapies (ART), which have shown to be effective on the control of the virus and the prevention of transmission to other individuals, HIV-infected patients experienced a great increase in both their quality of life and their life expectancy. Compared to the late 1990’s and early 2000’s, HIV-infected patients can now live over 50 years old and approach the same life expectancy as non-HIV individuals. However, HIV-infected patients now face new threats. HIV-infection, chronic inflammation and ART increases the risk of metabolic, cardiometabolic, neurocognitive and bone diseases due to their potential adverse effects.
So, HIV-infected women adherent to antiretroviral therapy, have an increased life expectancy, which means that they are able to live long enough to reach menopause. This way, and additionally to their HIV and ART-inherent risk of disease, these women are now also susceptible to menopause-driven age-related diseases.
In this study, we assessed the urinary metabolic profile of 74 HIV-infected women with similar chronological ages and close to the menopause (from 45 to 49 years old). The menopausal status of these women was defined according to their Antimüllerian hormone (AMH) levels (postmenopause and three consecutive groups of perimenopause, from closest to furthest from menopause onset). A non-targeted liquid chromatography and mass spectrometry-based metabolomics approach was conducted to assess the impact of the menopausal status on the metabolic profile.
No metabolic differences were found between the postmenopause and the group of women furthest from menopause. However, metabolic differences between the furthest and closest groups from menopause were identified. These results prove that the most relevant metabolic changes can happen in late perimenopause. However, the metabolites responsible for the observed differences could not be identified and thus, further studies are required to corroborate these results.
Keywords: Menopause, Human Immunodeficiency Virus, Metabolomics, Antimüllerian hormone,
VII
Sumário
A vida das mulheres é caracterizada por grandes mudanças hormonais e metabólicas que apresentam um grande impacto na suscetibilidade a certas doenças. Destas mudanças, a menopausa é considerada como a mais distinta.
O processo de envelhecimento reprodutivo feminino consiste em três fases: a pré-menopausa, correspondente aos anos reprodutivos da vida de uma mulher; a perimenopausa, que consiste na transição para a fase final, a pós-menopausa que se inicia após o diagnóstico da menopausa.
A perimenopausa e a pós-menopausa são assinaladas pelas principais mudanças hormonais e metabólicas que mais ameaçam a saúde de uma mulher. A pós-menopausa descreve várias alterações, sendo a mais relevante, a perda de estrogénio que anteriormente fornecia um efeito protetor à saúde feminina e que pode contribuir para o risco do desenvolvimento de doenças, principalmente, as cardiovasculares. Os fatores de risco que mais são descritos na pós-menopausa são os elevados níveis de colesterol total, lipoproteínas de baixa densidade (LDL), triglicéridos e apolipoproteínas-B (apoB).
Contudo, estas alterações não ocorrem apenas aquando do evento da menopausa. Estas têm início e ocorrem gradualmente durante a perimenopausa, mais especificamente durante a fase final da perimenopausa, até uma estabilização após o evento da menopausa. Esta fase é definida por ciclos menstruais irregulares, mais longos e a presença de meses amenorreicos.
Deste modo, tendo em conta a presença de alterações metabólicas ainda na fase anterior ao evento da menopausa, um estudo extensivo da perimenopausa pode contribuir para a prevenção de doenças futuras associadas a estes sintomas.
VIH (vírus da imunodeficiência humana) é um retrovírus com particular tropismo para o sistema imunitário, conduzindo à imunossupressão. Esta condição propicia o desenvolvimento de infeções comumente chamadas de infeções oportunistas que podem conduzir à morte.
Até aos dias de hoje, o VIH já causou a morte de mais de 32 milhões de pessoas e atualmente cerca de 37.9 milhões vivem com infeção VIH. Contudo, a terapêutica antirretroviral de alta eficácia (TAR) veio mudar o paradigma da infeção VIH que passou de potencialmente fatal a uma infeção crónica.
O estudo e desenvolvimento dos antirretrovirais permitiu o aparecimento de fármacos não só eficazes, mas também menos tóxicos e melhor tolerados. A eficácia dos atuais regimes antirretrovirais mostrou o controlo da infeção assim como o controlo da transmissão do vírus. No entanto, a TAR, juntamente com outros fatores como o próprio vírus, hábitos ou estilos de vida do individuo e fatores ambientais e/ou hereditários contribuem para o risco do desenvolvimento de comorbilidades como diabetes, stress oxidativo, aterosclerose, dislipidemia, osteopenia, hipogonadismo e inflamação. Ainda assim, o aumento da esperança média de vida dos indivíduos com infeção VIH foi apenas possível com o apoio destas terapias. Comparativamente com os últimos anos da década de 1990 e início dos anos 2000, pessoas infetadas por VIH com 20 anos, viviam em média até cerca dos 30 anos de idade e atualmente vivem para além dos 50 anos e cada vez mais se aproximam da esperança média de vida de pessoas saudáveis.
Deste modo, as mulheres com infeção HIV vivem para além da menopausa e por isso apresentam um risco acrescido de doenças relacionadas com a idade. Tendo em conta este risco, esta população é assim alvo para estudos de análise de possíveis biomarcadores destas doenças, assim como
VIII marcadores de progressão das mesmas, para que deste modo possibilitem o desenvolvimento de métodos preventivos.
Metabolómica é um método de análise que avalia um amplo grupo de metabolitos com o objetivo de a estabelecer relações entre o fenótipo e o metabolismo. Este método consiste na análise química de fluídos biológicos através de plataformas como a espectrometria de massa ou espectroscopia por ressonância magnética nuclear de modo a identificar metabolitos (pequenas moléculas) nas amostras. Por esta razão, a metabolómica é um método amplamente usado para o estudo de biomarcadores e alvos de doenças.
Neste estudo foi traçado o perfil metabolómico na urina de 74 mulheres com infeção HIV entre os 45 e os 49 anos de idade. O estádio da menopausa foi classificado de acordo com os níveis da hormona antimülleriana (AMH). Assim, 54 mulheres foram classificadas em três estádios da perimenopausa (grupo B, o grupo mais aproximado ao evento da menopausa e grupos C e D, grupos gradualmente mais afastados do evento) e as restantes 20 como pós-menopáusicas (grupo A).
Deste modo, tendo em conta estes grupos, avaliámos o perfil metabólico das urinas adotando uma abordagem metabolómica não direcionada onde as amostras foram analisadas através de cromatografia líquida e subsequente espectrometria de massa de modo a avaliar o impacto do estado da menopausa no perfil metabólico.
As diferenças nos resultados da PCA entre o grupo A, mulheres pós-menopáusicas, e o grupo D, mulheres mais afastadas da menopausa, eram espectáveis por apresentarem a maior diferença de idade biológica entre todos os nossos grupos, no entanto estas não foram confirmadas.
Contudo, os resultados entre os grupos B e D demonstraram que existe uma influência da AMH no perfil metabólico, ou seja, diferenças entre os perfis metabólicos das mulheres mais próximas do evento da menopausa e das mulheres mais afastadas do evento foram visíveis, confirmando assim as mudanças metabólicas que ocorrem na fase final da perimenopausa. No entanto, não foi possível a confirmação da identificação de nenhum destes metabolitos.
Em suma, este estudo aplicou métodos metabolómicos para avaliar os perfis metabólicos de mulheres com infeção HIV especificamente na sua transição para a menopausa. Não temos conhecimento de um estudo prévio com estas características. Apesar de não termos conseguido identificar possíveis metabolitos como biomarcadores, concluímos, através dos dados metabolómicos, a existência de diferenças na transição da perimenopausa para a menopausa que confirmam a diferença de idades biológicas das mulheres em estudo, ainda que apresentem idades cronológicas aproximadas.
Palavras chave: Menopausa, Vírus da Imunodeficiência Humana, Metabolómica, Hormona
X
Index
Agradecimentos... III Abstract ... V Sumário ... VII List of Figures and Tables ... XI List of abbreviations and acronyms ... XIII
1 Introduction ... 1
1.1 Menopause ... 1
1.2 Antimüllerian hormone ... 2
1.3 Metabolic changes associated to menopause ... 3
1.4 Brief introduction on HIV ... 4
1.5 Metabolic changes due to HIV infection ... 4
1.6 Metabolic changes due to ARVs ... 5
1.7 Higher risk of age-related diseases in menopausal HIV-infected women ... 5
1.8 Metabolomics ... 6
1.9 Rationale ... 9
2 Materials and Methods ... 10
2.1 Clinical samples ... 10 2.2 Hormone quantification ... 11 2.3 Urine treatment ... 11 2.4 Sample acquisition ... 11 2.5 Validation of LC-MS analyses ... 12 2.6 Data preprocessing ... 12 2.7 Statistical analyses ... 13
2.7.1 Statistical analyses of clinical data ... 13
2.7.2 Statistical analyses of metabolomics data ... 13
2.8 Metabolites identification ... 14
3 Results ... 15
3.1 Characterization of the population ... 15
3.2 Quality of the data ... 16
3.3. Influence of race, menopause, ARV and hormone levels in the metabolic profile ... 19
3.4 Metabolite identification ... 24
3.5 Analysis of saturation in samples ... 25
4 Discussion ... 36
4.1 Conclusions ... 38
References ... 39
XI
List of Figures and Tables
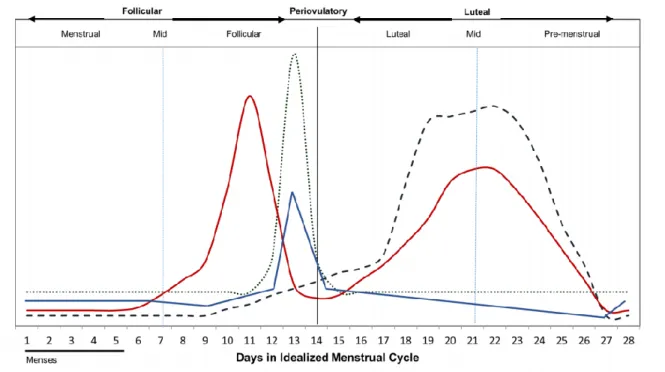
Figure 1.1 Hormone levels throughout menstrual cycle phases;
Figure 1.2 Schematic visualization of HIV-infection, ART and ageing outcomes in the human
physiology and metabolism;
Figure 2.1 Data preprocessing steps;
Figure 3.1 Hormone levels in each AMH group;
Figure 3.2 Example of a saturated ion present in the LC-MS chromatograms found at approximately 3
min of retention time;
Figure 3.3 PCA score plot of total area normalized data and PQN data of all samples;
Figure 3.4 PCA score plot of total area normalized data and PQN data of all samples colored by
acquisition day;
Figure 3.5 PCA plot score colored by race;
Figure 3.6 PCA score plot colored by AMH group;
Figure 3.7 PCA score plot of samples with identified ART regimens colored by principal ART; Figure 3.8 PCA score plot of samples with identified ART regimens colored by backbone ART; Figure 3.9 PCA scores plot of AMH group combinations;
Figure 3.10 Cross-validated score plot comparing AMH groups B and D; Figure 3.11 p(corr)/VIP score plot; Red circles correspond to the selected ions;
Figure 3.12 MS/MS spectra of the ions that matched online metabolomic data and correspondent
chemical structures of their fragments;
Figure S.1 Chromatographic representation of double peaks.
Table 1.1 Nomenclature of the stages/events of reproductive ageing;
Table 1.2 Metabolomic studies performed on menopause and its different stages; Table 1.3 Metabolomic studies performed on HIV infection;
Table 2.1 Groups of women according to AMH levels; Table 2.2 AMH values in healthy women in ng/mL;
XII
Table 3.1 Characterization of the population in study; groups are defined by AMH values (in ng/mL); Table 3.2 Potential identifications searched in online databases for the ions selected by the p(corr)/VIP
score plot;
Table 3.3 Potential identifications for the saturated ions (characterized by a minimum intensity of 1x10⁷);
XIII
List of abbreviations and acronyms
3TC – lamivudine ABC – abacavir
AIDS – acquired immunodeficiency syndrome AMH – Antimüllerian hormone
apoB – apoprotein B
ART – antiretroviral therapy ARV - antiretroviral
ATV – atazanavir
BMD – bone mass density CHD – coronary heart disease CV – coefficient of variation CVD – cardiovascular disease DRV – darunavir
E2 – estradiol EI – entry inhibitor
FMP – final menstrual period
FSH – follicular stimulating hormone FTC – emtricitabine
GC-MS – gas chromatography-mass spectrometry HDL – high-density lipoprotein
HIV – human immunodeficiency virus II – integrase inhibitor
LC-MS – liquid chromatography-mass spectrometry LDL – low-density lipoprotein
LH – luteinizing hormone
LLQ – lower limit of quantification MS – mass spectrometry
NMR – nuclear magnetic resonance
NNRTI – non-nucleoside reverse transcriptase inhibitor NRTI – nucleoside reverse transcriptase inhibitor NVP – nevirapine
XIV PI – protease inhibitor
PLS – partial least squares PLS-DA – partial least squares
PQN – probabilistic quotient normalization QC pool – quality control pool
RAL – raltegravir TC – total cholesterol TDF – tenofovir TG – triglycerides
1
1 Introduction
1.1 Menopause
A woman’s life is characterized by major shifts at hormonal levels which comprehend three different hormonal phases: the premenopause, the menopause transition and the postmenopause. At menarche, the reproductive years begin followed by the menopause transition where menstrual and hormonal irregularities occur. Menstrual irregularities keep happening until the final menstrual period (FMP) and after 12 months of amenorrhea, menopause is diagnosed and thus postmenopause stage begins. Perimenopause is the stage that comprehends both menopause transition and the 12-month amenorrhea period (Table 1.1) (Monteleone, Mascagni, Giannini, Genazzani, & Simoncini, 2018; Polotsky & Polotsky, 2010).
Table 1.1 Nomenclature of the stages/events of reproductive ageing (adapted from Monteleone et al., 2018); FMP, final
menstrual period. M ena rc he Early reproductive years Late reproductive years E ar ly menopa us e tr ans it ion L ate menopa us e tr ans it ion F M P + 12 -mont h ameno rr he a Early postmenopause Late postmenopause
Premenopause Perimenopause Postmenopause
Beginning at menarche, the premenopause is described as the woman’s reproductive years where ovulation occurs. Women are born with a set number of oocytes which are then released gradually in each menstrual cycle. These are stimulated by a positive and negative feedback-regulated cycle of hormones. Starting at mid follicular phase, follicular stimulating hormone (FSH) stimulates the recruitment of antral follicles for further development and a rise of estradiol (E2) at the granulosa cells. This rise of E2 halts the menses and the uterus lining thickens. At the ovary, follicles are developed, and the selection of a dominant follicle is followed. The dominant follicle will then mature and a peak of luteinizing hormone (LH), stimulated by FSH, will release the mature egg from the ovarian follicle. E2 later suppresses LH and stimulates the proliferation of the endometrium (Figure 1.1). To negatively feedback the FSH, inhibin B is secreted by oocytes inhibiting FSH synthesis at the pituitary (Draper et al., 2018; Hayes, Hall, Boepple, & Crowley, 1998).
Due to aging, the number of oocytes decreases and consequently the amount of inhibin B also decreases, and thus, without its negative feedback, FSH levels conversely increase (Monteleone et al., 2018). These hormonal changes depict the early stages of the menopausal transition, known as perimenopause (Polotsky & Polotsky, 2010). In this phase, the number of ovarian follicles keeps decreasing and consequently the levels of estrogen slowly decrease while the levels of FSH keep rising. Some of the physical symptoms of the perimenopause are menstrual irregularities with increasingly longer stages of amenorrhea, hot flashes, night sweats and sleep disorders (Monteleone et al., 2018; Santoro & Randolph, 2011).
At the near exhaustion of ovarian follicles, the ovary cannot respond to the rapidly rising levels of FSH and leads to a sharp decline in estrogen levels (Randolph et al., 2011; Santoro & Randolph, 2011). These hormonal shifts and loss of ovarian follicular function at the perimenopause lead to the ultimate event in the female body: menopause (Polotsky & Polotsky, 2010).
2 Menopause is clinically diagnosed after 12 months of amenorrhea and typically sets between 45 and 60 years old with a mean age of approximately 51 years of age (Calvet et al., 2015).
Proceeding this event, postmenopause is established, which is characterized by low levels of estrogen and high levels of FSH and includes numerous symptoms such as vaginal dryness, vulvovaginal atrophy, lower urinary tract symptoms and dyspareunia, which can be relieved through hormonal treatments (Chada et al., 2003; Polotsky & Polotsky, 2010; Takahashi & Johnson, 2015).
1.2 Antimüllerian hormone
Antimüllerian hormone (AMH) has been mainly associated to the early male development, specifically to their sexual differentiation at fetal stage (approximately 7th week of gestation). Reversely,
in females, AMH production has only been detected at the final stages of gestation. The absence of AMH throughout gestation promotes the Müller ducts development and thus the differentiation of the female reproductive system structures.
In females, AMH is secreted the highest by the granulosa cells in the preantral and small antral follicles of the ovary during reproductive years. At the end of gestation, AMH is produced in very low quantities, however it increases reasonably after birth until its peak at approximately 25 years of age (Oh, Choe, & Cho, 2019). Once the female reaches menarche and the menstrual cycles begin, the AMH has the important function of inhibiting the follicle growth by restraining the effects of FSH. This inhibition limits the recruitment and subsequent growth of primordial follicles, therefore preserving the ovarian reserve. Furthermore, AMH concentrations can be measured in both serum and urine and so, over the years, AMH physiology and clinical utility has been extensively studied and was found to exhibit a direct correlation to the number of primordial follicles in the ovary. For this reason, AMH is currently used in the evaluation of several conditions such as predicting the ovarian response to hyperstimulation of the ovaries for IVF, assessing damage to the ovarian follicle reserve, assessing
3 polycystic ovary syndrome condition and predicting the age of menopause (de Kat et al., 2019; Dewailly et al., 2014; A. La Marca & Volpe, 2006).
In this study, we used AMH as an assessment parameter for menopausal stages (premenopause, perimenopause and postmenopause) that, contrarily to FSH and inhibin B, has shown to be stable throughout the menstrual cycle and is not influenced by the presence of oral contraceptives (Bleil, Gregorich, McConnell, Rosen, & Cedars, 2013; Oh et al., 2019).
1.3 Metabolic changes associated to menopause
Beyond the major physical symptoms of postmenopause, numerous metabolic changes also occur in the menopausal onset period which can lead to severe conditions. These changes occur predominantly between 45 and 50 years old, corresponding to the menopause transition, and primarily contribute to high risks of cardiovascular diseases (CVD) (Auro et al., 2014).
The loss of estrogen is one of the major changes. Estrogen expresses numerous protective effects by interacting with various pathways in female metabolism. It is reported that estrogen improves the vascular integrity reducing permeability to LDLs, increases endothelial cell survival, inhibits reactive oxygen species (ROS), participates in the regulation of angiogenesis and inhibits inflammation (Fortini et al., 2019). So, with the loss of estrogen and the subsequent loss of these effects, women become more susceptible to cardiovascular complications namely myocardial infarction and stroke, renal diseases, osteoporosis and overall mortality (Fortini et al., 2019; Maric-Bilkan, Gilbert, & Ryan, 2014; Souza & Tezini, 2013). Atherogenic metabolites were found to increase rapidly at menopause transition through oxidative stress, changes in the lipid profile and endothelial dysfunction, thus demonstrating the higher prevalence of atherosclerosis with menopause onset (Auro et al., 2014; Polotsky & Polotsky, 2010; Wang et al., 2018).
Postmenopausal women present higher levels in total cholesterol (TC), triglycerides (TG), low-density lipoprotein (LDL) and apolipoprotein-B (apoB). Moreover, it has been reported that both total and LDL cholesterol tend to increase while HDL cholesterol declines among women who stopped menstruating for at least 1 year in comparison to women around the same age who continued menstruating. This loss of protection provided by HDL compromises postmenopausal women’s health with higher CVD risk independently of age. Furthermore, the high levels of TC, TG, LDL and apoB can promote hyperglycemic environments (diabetes leading condition), which can pose even greater risk of oxidative damage (Auro et al., 2014; Carr, 2003; Stachowiak, Pertyński, & Pertyńska-Marczewska, 2015).
In addition, it is important to remark that, although postmenopausal women present these lipid alterations, most of these changes occur majorly in late perimenopause, specifically proatherogenic lipid changes (Auro et al., 2014; Derby et al., 2009; Polotsky & Polotsky, 2010). The scarce number of studies on metabolic changes through perimenopause into postmenopause strengthens the need to study these stages to completely understand menopausal transition.
In sum, women spend a large percentage of their life in postmenopause experiencing inflammation and several alterations in their lipid profile that can compromise the metabolic profile causing it to be more proatherogenic and proinflammatory independently of age and thus greatly increasing the risk of developing numerous diseases and, ultimately, death (Polotsky & Polotsky, 2010; Wang et al., 2018).
4
1.4 Brief introduction on HIV
Human immunodeficiency virus (HIV) is a retrovirus that targets vital cells of the human immune system, specifically the CD4+ T cells, macrophages and dendritic cells (Cunningham, Donaghy,
Harman, Kim, & Turville, 2010; Pedro, Henderson, & Agosto, 2019). This infection has caused over 32 million deaths and approximately 37.9 million currently live with HIV (World Health Organization, 2019).
HIV infection of CD4+ cells has been described as a chronic cycle of infection. This designation
was applied considering that once infected, these cells die through pyroptosis that consequently promotes inflammation, which in its turn recruits more CD4+ cells that ultimately also get HIV infected
(Doitsh et al., 2014; Doitsh & Greene, 2016). The repercussion of this chronic cycle of infection and inflammation is a decrease in the CD4+ cell count that progresses to acquired immune deficiency
syndrome (AIDS). The condition of AIDS then describes a weakened immune system that favors the growth of opportunistic infections (J. P. Moore, 1997).
In order to control HIV infection, highly active antiretroviral therapy (ART) was introduced. ART consists on the combination of at least three antiretrovirals (ARVs) that operate in different steps of the virus life cycle. For identification purposes, the ARVs are grouped into five main classes according to their mechanism of action: nucleoside reverse transcriptase inhibitors (NRTIs) and non-nucleoside reverse transcriptase inhibitors (NNRTIs) inhibit the activity of reverse transcriptase (Das & Arnold, 2013); protease inhibitors (PIs) bind to the viral proteases thus inhibiting the virus replication (Wensing, van Maarseveen, & Nijhuis, 2010); integrase inhibitors (IIs) inhibit the viral integrase that is responsible for integrating the virus DNA into the target cell DNA (Métifiot, Marchand, & Pommier, 2013) and entry inhibitors (EIs) which inhibit the binding of the HIV virion to the human cell (Margolis, Heverling, Pham, & Stolbach, 2014). Hence, the ART’s main goal is to inhibit the virus replication, increasing the number of CD4+ cells and decreasing the risk of opportunistic infections and overall death.
The adhesion to these therapies enabled the progress of HIV infection from an acute to a chronic illness (R. D. Moore & Chaisson, 1999; Palmisano & Vella, 2011; Srinivasa & Grinspoon, 2014). The introduction of ART regimens has so far increased lifestyle and life expectancy for people living with HIV which has increased from 30 years old (as of late 1990’s and early 2000’s) to over 50 years old, approaching the life expectancy of non-HIV infected individuals (Nakagawa, May, & Phillips, 2013).
1.5 Metabolic changes due to HIV infection
HIV infection poses a great threat to human health given its characteristics and general symptoms. But, furthermore, it also implies other complications. Reports have shown that HIV-infected people experience numerous metabolic changes such as increased levels of triglycerides, oxidative stress, fatty acids and mitochondrial dysfunction, decreased levels of sphingomyelin, glutathione, taurine and tryptophan and hypocholesterolemia (Cassol et al., 2013; Peltenburg et al., 2018; Williams, Koekemoer, Lindeque, Reinecke, & Meyer, 2012).
Another major feature of HIV infection is chronic inflammation that derives from the destruction of the gut mucosa by the virus. The microbial products then go to the liver causing damage and impairing the organ to properly function at both microbial clearance and protein synthesis. This contributes to a chronic recruitment of monocytes and systemic inflammation condition that leads to end-organ disease, that is, all major organs that maintain their function through the circulatory system (Deeks, Tracy, & Douek, 2013).
5
1.6 Metabolic changes due to ARVs
ART allows to suppress HIV viremia and recover CD4+ cells, which positively impacts
HIV-induced metabolic alterations. However, on the other side, ART associated toxicity can have negative metabolic effects. HIV-infected patients on ART have been characterized by increased triglycerides, increased total and LDL cholesterol, and decreased HDL cholesterol as consequence of ARV use (Cassol et al., 2013), thus leading to the acknowledgement of characteristic metabolic alterations of each ARV classes.NRTIs have reported to cause mitochondrial toxicity which can lead to several conditions as renal and hepatic failures, pancreatitis and neuropathy; NNRTIs, neurological and hepatic alterations and dyslipidemia; PIs, dyslipidemia with increased total cholesterol, triglycerides, and LDL which elevates the susceptibility to cardiovascular diseases. Entry inhibitors have reported cases of hyperglycemia and pancreatitis, and integrase inhibitors, renal failure (Margolis et al., 2014). For this reason, ART, specifically PIs, are associated with atherosclerosis and insulin resistance (Avelino-Silva, Ho, Avelino-Silva, & Santos, 2011; Bociaga-Jasik et al., 2014), and both NRTIs and PIs for inducing oxidative stress, unregular adipogenesis and lipid metabolism, impaired glucose transport and lipolysis (Srinivasa & Grinspoon, 2014).
It is known that HIV infection and ART regimes have led to metabolic disorders (Avelino-Silva et al., 2011; Srinivasa & Grinspoon, 2014) and, together with the underlying chronic inflammation, these may still pose threats to the human health through metabolic changes. So, HIV infection in association with ART regimes have been highly related with several conditions such as diabetes mellitus, oxidative stress, inflammation, atherosclerosis, dyslipidemia, osteopenia and cardiovascular diseases due to metabolic and hormonal disorders. However, in an attempt to minimize these risks associated to ART, ARVs have been highly improved and, although they demonstrate less toxicity, metabolic changes persist and thusa non-AIDS mortality is still present (Ahmed, Roy, & Cassol, 2018; Avelino-Silva et al., 2011; John, 2016).
1.7 Higher risk of age-related diseases in menopausal HIV-infected women
Since the life expectancy of HIV-infected women who follow antiretroviral therapy has increased enough for them to be able to reach menopause, they are then faced with a combination of multiple factors with a clear negative metabolic impact, namely the presence of HIV-infection, the ART regimen, the aging process and the menopause transition and onset. Thus, HIV-infected women possess a great risk of developing metabolic-related diseases such as bone, metabolic, renal and cardiovascular diseases, namely osteopenia, osteoporosis, hypogonadism, diabetes mellitus, atherosclerosis, dyslipidemia and overall inflammation. (Avelino-Silva et al., 2011; Fan, Maslow, Santoro, & Schoenbaum, 2008; John, 2016; Nasi et al., 2017; Nicks et al., 2010), that develop as result of changes at the lipid profile, fatty acids, oxidative stress, mitochondrial toxicity and losses of estrogen and HDL protections that menopause provokes (Auro et al., 2014; Cassol et al., 2013; Derby et al., 2009; Fortini et al., 2019; Polotsky & Polotsky, 2010; Stachowiak et al., 2015)
To summarize, HIV-infected women going through menopause are faced with numerous accumulated risks that are heightened by ART, however, it is important to recall that the lack of these therapies would stand as a death sentence, so more support must be provided for these women in order to avoid a reduced adherence of or withdrawal from ART (Monteleone et al., 2018).
6
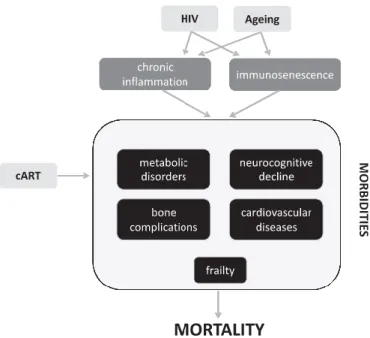
Figure 1.2 Schematic visualization of HIV-infection, ART and ageing outcomes in the human physiology and metabolism
(Nasi et al., 2017); cART, combination antiretroviral therapy.
1.8 Metabolomics
Metabolomics is a post-genomic technology that allows an unbiased investigation and understanding of the mechanisms behind biological functions through the analysis of the metabolites (small molecules) present in biological fluids and thus has been used to identify biomarkers and targets of several diseases and conditions (Cassol et al., 2013; Cui et al., 2019; Woo et al., 2009).
To perform this type of analysis, different analytical chemistry platforms may be used such as mass spectrometry (MS) and nuclear magnetic resonance (NMR). NMR is known for its high reproducibility and MS for its high sensitivity and, although NMR provides nondestructive and noninvasive characteristics, MS remains superior due to its high detection level, structural understanding through parent and fragment ions and identification of compounds by spectral matching (Emwas, 2015; Serkova & Little, 2014).
Metabolomics can be characterized into two categories: nontargeted and targeted analyses. The nontargeted analyses aim to profile the total number of metabolites in a sample (metabolomic
fingerprinting). In their turn, the targeted analyses focus on the identification and quantification of
selected metabolites. These metabolites are often known, enabling the study of specific metabolic pathways or even drug or food metabolism products (Emwas, 2015).
Metabolomic analyses of menopause or HIV infection have been performed using both MS and NMR techniques as well as different statistical analysis methods. The main goal of those studies is to find metabolic changes that occur in between premenopausal and postmenopausal women or between HIV-infected patients and healthy individuals (Tables 1.2 and 1.3). These differences can then help identify potential biomarkers of disease and drug targets (Cassol et al., 2013; Ghannoum et al., 2013; Ke et al., 2015; Miyamoto et al., 2017).
However, to our knowledge, there are no studies addressing the metabolic changes of menopause in HIV infected women. Nevertheless, it has shown to be of interest to assess this target population due to their distinct condition.
7
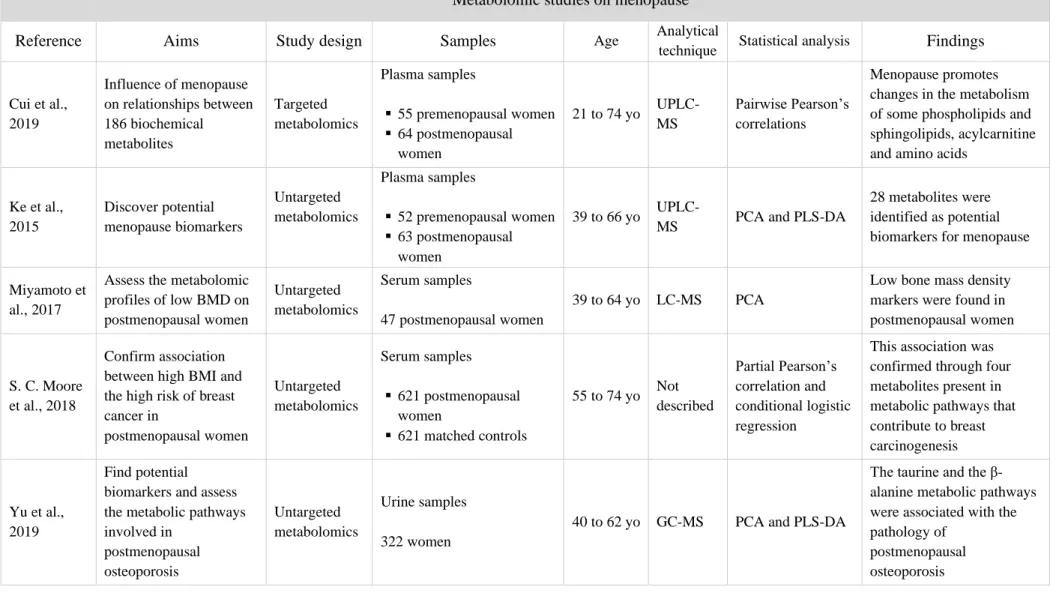
Table 1.2 Metabolomic studies on menopause and its different stages; (UP)LC-MC, (ultra-performance) liquid chromatography-mass spectrometry; GC-MS, gas chromatography-mass
spectrometry; NMR, nuclear magnetic resonance; PCA, principal component analysis; PLS-DA, partial least squares – discriminant analysis; yo, years old.
Metabolomic studies on menopause
Reference Aims Study design Samples Age Analytical
technique Statistical analysis Findings
Cui et al., 2019 Influence of menopause on relationships between 186 biochemical metabolites Targeted metabolomics Plasma samples ▪ 55 premenopausal women ▪ 64 postmenopausal women 21 to 74 yo UPLC-MS Pairwise Pearson’s correlations Menopause promotes changes in the metabolism of some phospholipids and sphingolipids, acylcarnitine and amino acids
Ke et al., 2015 Discover potential menopause biomarkers Untargeted metabolomics Plasma samples ▪ 52 premenopausal women ▪ 63 postmenopausal women 39 to 66 yo
UPLC-MS PCA and PLS-DA
28 metabolites were identified as potential biomarkers for menopause
Miyamoto et al., 2017
Assess the metabolomic profiles of low BMD on postmenopausal women Untargeted metabolomics Serum samples 47 postmenopausal women 39 to 64 yo LC-MS PCA
Low bone mass density markers were found in postmenopausal women
S. C. Moore et al., 2018
Confirm association between high BMI and the high risk of breast cancer in postmenopausal women Untargeted metabolomics Serum samples ▪ 621 postmenopausal women ▪ 621 matched controls 55 to 74 yo Not described Partial Pearson’s correlation and conditional logistic regression
This association was confirmed through four metabolites present in metabolic pathways that contribute to breast carcinogenesis
Yu et al., 2019
Find potential biomarkers and assess the metabolic pathways involved in postmenopausal osteoporosis Untargeted metabolomics Urine samples 322 women
40 to 62 yo GC-MS PCA and PLS-DA
The taurine and the β-alanine metabolic pathways were associated with the pathology of
postmenopausal osteoporosis
8
Table 1.3 Metabolomic studies on HIV infection; ART, antiretroviral therapy; CVD, cardiovascular diseases; CHD, coronary heart disease; LDL, low density lipoproteins, HDL, high density
lipoproteins; LC-MS, liquid chromatography-mass spectrometry; GC-MS, gas chromatography-mass spectrometry; NMR, nuclear magnetic resonance; PCA, principal component analysis; PLS-DA, partial least squares – discriminant analysis.
Metabolomic studies on HIV
Reference Aims Study design Samples Analytical
technique
Statistical
analysis Findings
Cassol et al., 2013
Identify metabolic differences between HIV-infected persons on ART and healthy controls
Untargeted metabolomics
Plasma samples ▪ 32 HIV-infected on
ART (at least one PI) ▪ 20 healthy controls
LC/GC-MS
PCA and PLS-DA
35 metabolites were identified as markers of inflammation, microbial translocation, and hepatic function to which were linked to lipid irregularities Cassol, Misra, Dutta, Morgello, & Gabuzda, 2014
Identify changes at metabolic pathways associated with neurocognitive disorders through comparisons between HIV infected patients and HIV negative controls Untargeted metabolomics Cerebrospinal fluid samples ▪ 46 HIV-infected patients ▪ 54 controls LC/GC-MS PCA and PLS-DA
Metabolites associated with neurotransmitter production, mitochondrial function, oxidative stress and metabolic waste on HIV-infected persons were identified confirming the higher risk of neurocognitive disorders
Duprez et al., 2009
Find associations between lipoproteins and CVD in HIV-infected individuals Targeted metabolomics Blood plasma 728 HIV-infected patients: ▪ 248 CVD cases ▪ 480 controls NMR Conditional logistic regression
The authors demonstrated that a lower baseline of total, large and small HDL-particles is related to CVD in HIV infected patients
Swanson et al., 2009
Characterize the lipid profile of medically underserved HIV-infected individuals Targeted metabolomics Blood serum 132 HIV-infected individuals NMR One-way ANOVA
Changes at lipidic profiles (specifically LDL and HDL lipoproteins) demonstrate a greater risk of CHD in medically underserved HIV-infected individuals Williams,
Koekemoer, Lindeque, Reinecke, & Meyer, 2012
Detection of metabolic changes during the 2nd stage HIV;
Identification of disease progression markers for prevention of future symptoms
Untargeted metabolomics Blood serum ▪ 18 2nd stage HIV- infected individuals without ART ▪ 21 healthy controls GC–MS PCA and PLS-DA
10 metabolites were linked to disrupted mitochondrial metabolism, changes in lipid metabolism and oxidative stress
9
1.9 Rationale
Several studies have already evaluated the metabolic differences between premenopausal and postmenopausal women (Cui et al., 2019; Ke et al., 2015). However, few studies have evaluated the specific metabolic changes that occur during the perimenopause, which was identified as the menopausal period where most metabolic changes begin (Derby et al., 2009; Polotsky & Polotsky, 2010). Thus, there’s a high need of studies focused on perimenopause in order to develop and increase prevention to these diseases.
Since the survival rate of HIV-infected individuals is the highest ever, infected women can now live long enough to experience menopause. However, HIV-infected women reaching menopause present higher risk of metabolic alterations than non-HIV women due to the additive detrimental effects of HIV and ARVs on the metabolism. These characteristics combine a fast ageing process on these women which can be studied in order to assess disease progression as well as disease biomarkers.
Based on the information explored above, we hypothesized that there are metabolic differences between HIV-infected women in postmenopause and HIV-infected people in perimenopause.
Thus, we performed a non-targeted metabolomic study using a liquid chromatography and mass spectrometry platform in order to assess the impact of menopausal status according to AMH levels in a population of HIV-infected women with similar chronological ages and close to menopause.
10
2 Materials and Methods
2.1 Clinical samples
Urine samples were collected at Centro Hospitalar de Lisboa Central, EPE and Hospital
Professor Doutor Fernando Fonseca, EPE and stored frozen at -80 ºC at CEDOC – Chronic Diseases Research Center, UNL.
The study is part of a project that aims to find biomarkers at molecular level for the cardiometabolic risk in human immunodeficiency virus (HIV)-infected women and its protocol was approved by the Ethics Committees of the hospitals involved. All patients provided written informed consent to participate. Inclusion criteria were defined as women with more than 18 years old and HIV-infection with or without antiretroviral therapy.
Demographic, clinical and laboratory data collected for the study included: age, sex, ethnicity, antiretroviral therapy (ART) regimens and concentrations of the hormones AMH, E2, FSH and LH. The concentrations of the hormones were quantified previous to this study through specific essays described in section II.2 Hormone quantification.
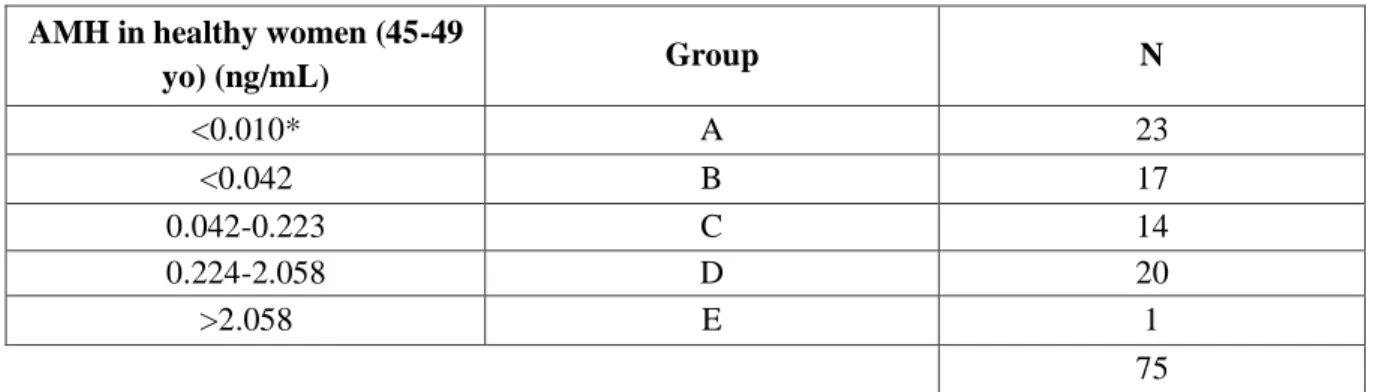
For this master’s project, in order to assess the metabolic differences between menopausal status in HIV-women, we selected those women between 45 and 49 years old. The rationale for this selection was 1) to avoid the influence of the chronological age; and 2) to focus on the women who are close to the menopause. A total of 75 urine samples met these criteria. These 75 samples were then divided into five groups (Table 1) according to the AMH reference values in healthy women of the same age (Table 2) (adapted from Wilson, Sabin, & Hartshorne, 2017).
Given that group E consisted on a single sample was thus excluded.
Table 2.1 Groups of women according to AMH levels; *Lower limit of quantification (LLQ).
AMH in healthy women (45-49
yo) (ng/mL) Group N <0.010* A 23 <0.042 B 17 0.042-0.223 C 14 0.224-2.058 D 20 >2.058 E 1 75
Table 2.2 AMH values in healthy women (adapted from Wilson et al., 2017) in ng/mL; LLQ, lower limit of quantification.
AMH values (ng/mL)
10th percentile Median 90th percentile LLQ
20-24 years 1.876 3.962 7.294 <0.010 25-29 years 1.834 3.332 7.532 30-34 years 0.952 2.758 6.692 35-39 years 0.770 2.044 5.236 40-44 years 0.098 1.064 2.954 45-50 years 0.042 0.224 2.058
11 Women who presented AMH values below the lower limit of quantification (LLQ = 0.010 ng/mL) were included in the group A and were considered as the women in postmenopausal phase. Women with detectable AMH levels were considered as women in the perimenopausal phase and were divided in 4 different groups according to their AMH levels. Samples with AMH values higher than the LLQ and below the 10th percentile of the reference values (<0.042 ng/mL) were included in the group
B. AMH values between the 10th percentile and the median value were considered as group C
(0.042-0.223 ng/mL). AMH values from the median to the 90th percentile (0.224-2.058 ng/mL) were included
in the group D. Finally, AMH values above the 90th percentile (>2.058 ng/mL) were included in the
group E.
2.2 Hormone quantification
All four hormones were quantified, previous to this study, following urine sample collection. AMH quantification was accomplished by electrochemiluminescence immunoassay (ECLIA) (Elecsys® AMH assay, Roche Diagnostics) on Cobas 411 with a lower limit quantification (LLQ) of 0.01 ng/mL and LH (2P4035 ARCHITECT Kit - 0.09 mIU/mL), FSH (7K75-35 ARCHITECT Kit - 0.05 mIU/mL) and E2 (7K72-35 KIT, 25 pg/mL) were quantified in serum by chemiluminescent microparticle immunoassay (CMIA) on ARCHITECTi2000.
2.3 Urine treatment
Urine samples were processed following a protein precipitation method (adapted from Pacchiarotta et al., 2012).
From each sample, 10 µL were used to create a quality control pool (QC pool) in order to assess the quality of sample processing, both chromatographic and mass spectrometry analysis and the data’s ultimate reproducibility and subsequent validation (Dunn, Wilson, Nicholls, & Broadhurst, 2012).
Samples were randomized and the extraction protocol was performed. A volume of 50 µL of each sample or QC pool was mixed with 150 µL of cold ethanol and incubated on ice for 20 minutes. The samples were then centrifuged at 3660 g and 4°C for 10 minutes. Subsequently, the supernatant was evaporated until dryness using an Eppendorf Concentrator plus (Eppendorf, Germany). Reconstitution of samples was made with 400 µL of 10% of acetonitrile in water.
2.4 Sample acquisition
The samples were injected in four sequences in four different days. Each sequence contained from 23 to 26 samples. QC pools and waters were injected in the beginning of each sequence and every four samples.
The UHPLC Elute (Bruker Daltonics, Bremen, Germany) was equipped with a pre-column (SecurityGuard™ ULTRA Cartridges, UHPLC Polar C18, 2.1mm ID, Phenomenex) and a column (Kinetex 2.6 µm Polar C18 100 Å, LC Column 100 x 2.1 mm, Phenomenex). The UHPLC mobile phases were water + 0.1% formic acid v/v (phase A) and methanol + 0.1% formic acid v/v (phase B) at a flow rate of 400 µL/min. The gradient was as follows: 1 min to 5% phase B, then 5 min to 50% phase B, and 4 min to 100% whereas was held for 8 min at 100% phase B. Subsequently in 1 min, the phase B decreased to 0% and held at 0% for 6 more min. The volume of injection was 3 µL.
12 The mass spectrometer (impact II, Bruker Daltonics) was operated in positive ionization mode via electrospray at a voltage of 4500 V, end plate offset of 500, 80 L/min of nebulizer gas (N2) and 40
Bar of dry gas (N2) at 200 °C. The mass spectrometer operated in full scan acquisition mode with a
spectra rate of 1.00 Hz. The m/z range was from 50 to 1000 m/z. Sodium formate 10 mM was injected before each run to calibrate the mass spectrometer.
2.5 Validation of LC-MS analyses
LC-MS files were visualized and assessed in Data Analysis (Bruker Daltonics).
For the purpose of validating our analysis, seven intense ions were randomly selected through their chromatograms to cover both their total RT range and m/z range. The correspondent area of the peak and retention time (RT) of each ion were obtained with the Data Analysis software in all the QC pools injected in each sequence and both mean and standard deviation were calculated. Subsequently, the coefficients of variation (CV = standard deviation / mean) were determined.
The CV of the successful sequences ranged from 1,38% to 21,78% (See Annex Table S.1) to which, according to the proposed value of CV < 20% by Godzien et al. (2015) and Karaman (2017) were consider satisfactory.
2.6 Data preprocessing
Data was then preprocessed using MZmine (version 2.39) (Pluskal, Castillo, Villar-Briones, & Orešič, 2010). For this purpose, LC-MS files were exported and converted into mzXML files using Msconvert by Proteowizard (Chambers et al., 2012).
Data preprocessing consisted on four steps: peak detection (mass detection, chromatogram builder and deconvolution), retention time correction, peak matching and gap filling (Figure 2.1).
Figure 2.1 Data preprocessing steps.
Peak detection takes three steps which started with mass detection using the following parameters: retention time from 0.5 to 10 min, mass detector as centroid and noise level of 7000. Next, the chromatograms were built with the same retention time interval, minimum time span of 0.1, minimum height of 7000 and m/z tolerance of 0.005 m/z or 15.0 ppm. For the peak deconvolution, the algorithm used was Wavelets (XCMS) with signal to noise threshold of 10, wavelet scales from 0.2 to 5 and peak duration range from 0.1 to 2; raw data was used as peak integration method and average as
m/z center calculation.
The next step was retention time correction, in which the m/z tolerance was set to 0.005 m/z or 10 ppm, the retention time tolerance, 2 min and minimum standard intensity, 7000. Subsequently peak alignment was performed at the same m/z tolerance (0.005 m/z or 10 ppm), a retention time and a retention time after correction of 2 min, 0 RANSAC iterations, a minimum number of points of 45% and a threshold value of 2.
Peak detection Retention time
13 The last step was the gap filling where an intensity tolerance of 30% was considered, the m/z tolerance was once again maintained (0.005 m/z or 10 ppm) and the retention time tolerance was set to 1 min.
After this procedure, the resulting table containing 1899 ions was exported as a CSV file. Two filters were applied to reduce the number of ions. The first filter consisted in excluding ions that belonged exclusively to water samples thus all ions that presented a mean peak area above 7000 were excluded (661 ions).
After this first filter, 1238 ions remained to which the second filter was applied excluding all ions that presented a CV above 30% in the QC pools (849 ions). Thus, the final table contained 389 ions. Finally, the dataset was normalized to correct for differences in metabolite concentrations due to discrepancies in the patients’ water intake. Since water works as a solvent, these differences will mirror the dilution instead of the actual metabolic profile of each sample.
Two possible types of normalization were applied: total area normalization and probabilistic quotient normalization (PQN) (Karaman, 2017). Both normalizations were performed in R (version 3.5.3). PQN normalization was performed with the function pqn after the installation of the Rcpm package (Dieterle, Ross, Schlotterbeck, & Senn, 2006).
2.7 Statistical analyses
2.7.1 Statistical analyses of clinical data
Demographic and clinical data were analyzed using SPSS (Version 25) software. Non-parametric tests were chosen due to small sample size (14 to 23 samples per group of AMH) (Hill & Lewicki, 2007).
Comparisons between two variables were achieved through Chi-square tests or Fisher’s test and, for comparisons between three or more variables, Kruskal-Wallis tests with post hoc Dunn tests or Mann-Whitney U tests were performed. A significance level of 0.05 was defined.
Data were expressed as median and interquartile range.
2.7.2 Statistical analyses of metabolomics data
Multivariate analyses were operated using the software SIMCA (version 14.1).
Principal component analysis (PCA) and partial least squares-discriminant analysis (PLS-DA) were performed to both normalized datasets (total area normalization and PQN). These datasets were analyzed after centering and scaling either with unit variance or pareto. Moreover, data log transformation was also tested. PCA and PLS-DA models were then assessed, taking into account the number of components created and the fitness parameters (cumulative R2, Q2). Besides, PLS-DA models were also evaluated through permutation tests and their p-value and F value.
Following PLS-DA, p(corr)/VIP score plots were generated to select the most relevant ions as those ones with a VIP value over 1 and a p(corr) value between -0,6 and 0,6.
Partial least squares (PLS) regression analyses were also performed to assess relationships between our data and the quantified hormone levels (AMH, E2, FSH and LH).
14
2.8 Metabolites identification
Potential metabolite identifications were searched on online databases according the m/z value with an error of 10 ppm (Human Metabolome Database and METLIN). In parallel, chemical formulas were obtained for each ion of interest using the Smart Formula tool from Data Analysis (Bruker Daltonics) with a mass error < 10 ppm and mSigma < 20.
Then, for each of the ions of interest, 3 samples where their peaks presented high intensity, defined as > 1x10⁴, and good chromatographic shape were selected.
MS/MS analyses were performed using the sample with the highest intensity for each ion. Both auto MS/MS and MRM (multiple reaction monitoring) methods were performed. For compound identifications, MS/MS experiments were performed using ESI-ultra high resolution UHPLC-QTOF and ESI-ion trap MS (HCTultra, Bruker Daltonics). The data were acquired in a scan range from m/z 50 to 1000 in MRM and auto MS/MS mode and by using an inclusion list of precursor ions of interest (the ones relevant after statistical data analysis). Collision energies were the following: m/z 203.1490, 30 V;
m/z 221.0910, 30 V; m/z 233.1130, 32 V; m/z 245.1130, 33 V; m/z 285.0820, 33 V and m/z 487.2130,
35 V. All the m/z values within this interval were fragmented with interpolated values of collision energy. Following MS/MS analyses, experimental MS/MS data were matched against the online MS/MS information to verify the potential identifications.
15
3 Results
3.1 Characterization of the population
The population with a total of 74 patients was characterized as follows:
Table 3.1 Characterization of the population in study; groups are defined by AMH values (in ng/mL); hormone values are
shown as median and interquartile range [25th percentile-75th percentile].
Group A B C D AMH (ng/mL) <0.01 <0.042 0.042-0.223 0.224-2.058 n 23 17 14 20 Race Caucasian n (%) 12 (52.2%) 5 (29.4%) 7 (50%) 12 (60%) Hormones AMH (ng/mL) [0.01-0.01] 0.01 [0.01-0.03] 0.02 [0.08-0.21] 0.11 [0.25-0.70] 0.39 E2 (pg/mL) [10.0-17.0] 10.0 [22.0-223.0] 69.0 [17.5-96.5] 52.0 [30.75-183.0] 87.0 FSH (mIU/mL) [37.62-74.36] 52.35 [8.64-27.07] 18.83 [1.99-14.32] 6.77 [3.80-7.77] 6.26 LH (mIU/mL) [20.99-38.44] 27.25 [10.47-22.87] 20.32 [1.5-12.59] 4.12 [2.69-6.85] 4.05 ARVs n (%) NRTIs Abacavir 6 (26.1%) 6 (35.3%) 5 (35.7%) 4 (20%) Emtricitabine 13 (56.5%) 7 (41.2%) 5 (35.7%) 12 (60%) Lamivudine 6 (26.1%) 5 (29.4%) 5 (35.7%) 2 (10%) Tenofovir 14 (60.9%) 11 (64.7%) 6 (42.9%) 14 (70%) NNRTIS Nevirapine 1 (4.4%) 4 (23.5%) 3 (21.4%) 2 (10%) IPs Atazanavir 5 (21.7%) 4 (23.5%) 2 (14.3%) 3 (15%) Darunavir 4 (17.4%) 4 (23.5%) 1 (7.1%) 5 (25%) IIs Raltegravir 2 (8.7%) 2 (11.8%) 0 (0%) 2 (10%)
The number of Caucasian and Non-Caucasian patients was similar among groups (Chi-square,
p = 0.299). For AMH, significant differences were found between A and either B (p < 0.05), C and D
(p < 0.005) with higher levels recorded in the three latter groups. For E2, higher values were also demonstrated in groups B, C and D and were all statistically significant (B and D: p < 0.005; C: p < 0.05). FSH was figuratively inversed to the AMH plot showing lower levels in groups from B to D (B:
p < 0.05; C and D: p < 0.005). Lastly, for LH, the plot followed the same pattern as FSH: the levels of
the groups B to D were lower than A however statistical differences were only verified between group A and groups C and D (p < 0.005) (Figure 3.1).
Besides these comparisons, there were also statistically significant differences between group B and D (p < 0.0005) in the AMH hormone analysis.
16
Figure 3.1 Hormone levels in each AMH group; A) AMH in ng/mL, B) E2 in pg/mL, C) FSH in mIU/mL and D) LH in
mIU/mL; Comparisons were made using the Kruskal-Wallis tests and post-hoc Dunn-Bonferroni tests. Boxplots represent minimum and maximum values, 25th percentile, 75th percentile and median: blue asterisks indicate significant differences (* p
< 0.05; *** p < 0.0005) in comparison with A group; Black asterisks (*) and black circles (°) represent outlier values.
The differences in the hormone levels among groups follow accordingly to the biological events in which both AMH and E2 decrease and FSH and LH increase with the menopause onset (Takahashi & Johnson, 2015).
3.2 Quality of the data
Data quality was assessed with two strategies. First, we visualized all base peak chromatograms of the samples. Second, we performed PCA to assess the quality of the LC-MS analyses.
For the first strategy, chromatograms were visualized to evaluate any irregularities that could be present. Unexpectedly, some chromatograms were found to show broad peaks with plateau shaped tops (Figure 3.2). These signs of saturation were present in 15 samples (20.3%).
And, due to these unexpected behaviors, we decided to exclude those 15 samples from the analysis.
A
B
17
Figure 3.2 Example of a saturated ion present in the LC-MS chromatograms found at approximately 3 min of retention time.
The second strategy consisted in multivariate analysis, specifically PCA, and were performed with both total area normalization and PQN datasets.
The first PCA model was carried out on all 59 samples and the 22 QC pools. The plot scores for both approaches (total area normalization and PQN) show that QC pools create a cluster demonstrating few differences between them (Figures 3.3). This represents good quality in the QC pools.
0 1 2 3 4 5 6 7 8 9 10 Time [min] 0.0 0.5 1.0 1.5 7 x10 Intens. KS1833_10_01_11527.d: BPC +All MS A B
Figure 3.3 PCA score plot of A) total area normalized data (R2X = 0.632; Q2 = 0.198) and B) PQN data (R2X = 0.678; Q2
18 Subsequently, we excluded the QC pools and assessed if the different days of acquisition of the samples constituted any influence in our LC-MS analyses through PCA (Figures 3.4).
Figure 3.4 PCA score plot of A) total area normalized data (R2X = 0.604; Q2 = 0.149) and B) PQN data (R2X = 0.424; Q2 =
0.135) of all samples colored by acquisition day (1st day, blue circles; 2nd day, dark circles; 3rd day, red circles and 4th day,
yellow circles).
Results showed a good dispersion between the samples of each day, with no clusters created, meaning that the day of acquisition did not influence the analyses.
After assessing these results, we concluded that the multivariate analyses performed to our normalized dataset through total area demonstrated better results than PQN given their R2 values. For
the samples and QC pools models where QC pools quality was assessed, R2 was 0.632 and 0.678 for
total area normalization and PQN, respectively, did not show great differences however for the models that assessed the quality regarding the day of acquisition of the samples, the R2 values were 0.604 for
total area normalization and 0.424 for PQN.
For these reasons, further analyses were based on total area normalized data.
A
19
3.3. Influence of race, menopause, ARV and hormone levels in the metabolic profile
To find possible influences of our different variables in the metabolic profile, the PCA model created with our 59 samples (PCA model: R2X = 0.604; Q2 = 0.149) was assessed.
Race seemed to have some influence on the metabolic profile since the distribution of the dots (samples) seemingly created a pattern where Caucasian race samples are predominantly on the top half of the plot and Non-Caucasian samples on the bottom half (Figure 3.5).
Menopause status, defined by our groups of AMH levels, did not seem to have a big influence on the metabolic profile since no patterns were visible (Figure 3.6).
20
Figure 3.6 PCA score plot colored by AMH group (A, blue circles; B, dark circles; C, red circles and D, yellow circles).
The influence of ARV drugs was also evaluated. Two analyses were performed, considering the principal ARV (atazanavir, ATV; darunavir, DRV; raltegravir, RAL; and/or nevirapine, NVP) (Figure 3.7) and the backbone ARV (abacavir, ABC and/or tenofovir, TDF) (Figure 3.8).
Figure 3.7 PCA score plot of samples with identified ART regimens colored by principal ART (atazanavir, blue circles;
atazanavir + raltegravir, dark circles; darunavir, red circles; darunavir + raltegravir, yellow circles; nevirapine, green circles; raltegravir, purple circles; no ARV data, grey circles).
Figure 3.8 PCA score plot of samples with identified ART regimens colored by backbone ART (abacavir, blue circles;
abacavir + tenofovir, dark circles; tenofovir, red circles; no ARV data, grey circles).
Considering these score plots, the principal ARV and the backbone ARV had no visible patterns thus showing no influence.
21 Since no clear influence of AMH was observed in the totality of our samples (Figure 3.6), we decided to perform PCA models in two-group combinations of the predefined AMH groups in order to find possible patterns of influence. The following combinations were assessed: A and B, A and C, A and D, B and C, B and D and C and D (Figure 3.9).
Figure 3.9 PCA scores plots of AMH two groups combinations A) A and B (R2X = 0.59; Q2 = 0.121), B) A and C (R2X =
0.524; Q2 = 0.113), C) A and D (R2X = 0.47; Q2 = 0.117), D) B and C (R2X = 0.495; Q2 = 0.049), E) B and D (R2X = 0.538; Q2 = -0.062) and F) C and D (R2X = 0.515; Q2 = 0.005). Samples are colored according to AMH group (A group, blue circles; B group, dark circles; C, red circles and D, yellow circles).
A
B
C
D
22 The only resultant PCA model that showed some differences between AMH groups was the one between groups B and D (PCA model: R2X = 0.538; Q2 = -0.062) due to a pattern that can be acknowledged: group B tending to the left side of the plot and group D, opposingly, to the right side (Figure 3.9.E).
Even if the influence of menopause (defined by the AMH levels) on the metabolic profile was not dominant, we conducted PLS-DA models in order to improve the separation between groups. Two-class PLS-DA models were performed. The only statistically significant model was B vs D (p < 0.05) (Figure 3.10).
Figure 3.10 Cross-validated score plot comparing AMH groups B and D. Samples are colored according to AMH group (B
group, dark circles; D group, yellow circles).
The model was created with two components and its statistical parameters were R2X = 0.185, R2Y = 0.819, Q2 = 0.358, F = 4.21, p value = 0.0092. This PLS-DA result confirms the results obtained in the analyses through PCA.
In view of these modest results, other types of analysis were tried. PLS models were performed to evaluate a potential association between the hormonal levels of AMH, E2, FSH and LH and the metabolic profile (Figure 3.11). However, no model was statistically significant.
23
Figure 3.11 Observed vs predicted plots of each hormone (AMH, E2, FSH and LH); observed values (Y-axis) are correlated
with predicted values produced by the model (X-axis); A) AMH in ng/mL, y = x – 1.074e-8,R2 = 0.647, p = 1; B) E2 in
pg/mL, y = x + 2,759e-6, R2 = 0,6908, p = 1; C) FSH in mIU/mL, y = x - 5,359e-7, R2 = 0,5683, p = 1; LH in mIU/mL, y = x
+ 1,155e-6, R2 = 0,7064, p = 0.07; plots are colored by AMH group (group A, blue circles; group B, dark circles; group C,
red circles and group D, yellow circles).
So, upon all different analyses performed, we selected the PLS-DA model comparing B and D as the best model to explain the influence of AMH on the metabolic profile. And, in order to identify the most important metabolites responsible for the differences between these groups, a p(corr)/VIP score plot was created (Figure 3.12).
A
B
24
3.4 Metabolite identification
For the 34 ions that were selected from the p(corr)/VIP score plot (Figure 3.11) created through the PLS-DA model which better showed the AMH influence on the metabolic profile, potential identifications were searched through the m/z values of the ions in online databases. Only 11 ions showed results (Table 3.2).
Table 3.2 Potential identifications searched in online databases for the ions selected by the p(corr)/VIP score plot;
correspondent p(corr) values are expressed as well as the databases which returned results. Shaded ions were selected for MS/MS analysis. m/z [M+H+] p(corr) value Potential identification
Database Chemical formula Name
203.149 0.6046 HMDB/Metlin C8H18N4O2 Symmetric dimethylarginine Asymmetric dimethylarginine 204.086 0.627 HMDB C8H13NO5 N-acetyl-L-2-aminoadipate (2-) N-Acetyl-L-2-aminoadipic acid 221.091 0.7225 HMDB/Metlin C11H12N2O3 5-Hydroxy-L-tryptophan 233.113 0.6629 HMDB/Metlin C9H16N2O5 Aspartyl-Valine Valyl-Aspartate Threoninyl-Hydroxyproline 241.155 0.6102 HMDB C12H20N2O3 Pirbuterol 245.113 0.6091 HMDB/Metlin C10H16N2O5 Prolyl-Glutamate 285.082 0.6229 HMDB C10H12N4O6 Xanthosine Diazepam 346.123 0.6785 HMDB C17H19N3O3S Omeprazole 368.153 0.6475 HMDB C21H22ClN3O Desmethylazelastine 487.213 0.605 HMDB C18H34N2O13 Glucosylgalactosyl hydroxylysine
514.876 -0.7904 HMDB C12H10Ca2FeO14 Ferrous calcium citrate
Considering the shape of the peaks, intensity and possible biological interest to our study, six ions (shaded in Table 3.2) were selected for MS/MS analysis. Through online databases, spectra
Figure 3.12 p(corr)/VIP score plot; Red
circles correspond to the selected ions (VIP value over 1 and p(corr) value below -0.6 and over 0.6).


![Table 3.1 Characterization of the population in study; groups are defined by AMH values (in ng/mL); hormone values are shown as median and interquartile range [25th percentile-75th percentile]](https://thumb-eu.123doks.com/thumbv2/123dok_br/19292900.994405/29.893.108.790.270.699/table-characterization-population-defined-hormone-interquartile-percentile-percentile.webp)


