Vol. 34, No. 04, pp. 1011 – 1021, October – December, 2017 dx.doi.org/10.1590/0104-6632.20170344s20150420
* To whom correspondence should be addressed
CONVECTIVE RECIRCULATION EFFECT ON
THE SELECTIVE NON-CATALYTIC REDUCTION
BEHAVIOR IN AN INDUSTRIAL FURNACE
F. C. L. Oliveira
1,2, W. P. Martignoni
1, E. Souza, L.G. Pereira
1, L.S. Santos
2,
D.M. Prata
2and L.P.C. Monteiro
2,*1Petrobras, Petróleo Brasileiro, Brazil.
2Departamento de Engenharia Química e de Petróleo, Escola de Engenharia, Universidade Federal Fluminense, Rua Passo da Pátria, 156, 24210240, Niterói, RJ, Brazil.
*E-mail: [email protected]
(Submitted: July 4, 2015; Revised: April 1, 2015; Accepted: June 29, 2016)
Abstract – Selective non-catalytic reduction (SNCR) has become an important technique for reducing NOx emissions
in industrial furnaces. The occurrence of convective recirculation can cause significant changes in SNCR performance.
This paper presents the results of a study performed by Computational Fluid Dynamics (CFD) considering: (i) changes of initial NOX; (ii) injection plan and (iii) NH3/NO molar ratio. The simulations have demonstrated that the convective
recirculation (resultant from different injection plans and high temperature gradients) of flue gas assumes a role of vital
importance for performance analysis of existing plants and the potential NOX reduction in furnaces during the design phase.
Keywords: SNCR, industrial furnaces, NOX, ammonia.
INTRODUCTION
Selective non-catalytic reduction (SNCR)
Environmental standards in various parts of the world require the commercial deployment of technologies for the control of nitrogen oxide (NOx) emission (Tayyeb Javed et al., 2007). This phenomenon is quite frequent in chemical process equipments where combustion of gases occurs.
NOx formed in combustion processes are typically caused by thermal fixation of atmospheric nitrogen in the combustion air leading to ‘‘thermal NOx’’; by the combination of hydrocarbon fragments and atmospheric nitrogen in the flame zone; or caused by the conversion of chemically bound nitrogen in the fuel, leading to ‘‘fuel
NOx’’. Fuel NOx is believed to be the major contributor to NO emission in coal-fired combustion systems (Pershing and Wendt, 1977). Several experimental studies can be found on this subject: Pershing and Wendt (1977), Ballester et al. (1997), Adams and Harding (1998), Lee and Baek (2007), Mahmoudi et al.( 2010).
Formation of thermal NOx is influenced by factors such as oxygen (O2) availability, temperature, pressure and residence time in the combustion unit, whereas the formation of fuel NOx depends on such factors as the nitrogen contents of the fuel, total excess air rates and relative distribution of primary and secondary combustion.
The main technologies for reducing emissions of NOx are low-NOx burners, staged combustion, selective catalytic reduction (SCR) and selective non-catalytic reduction (SNCR) (Han et al., 2003). Even though the
of Chemical
catalytic reduction systems for NOx emission feature high efficiency, there are numerous obstacles to their deployment in existing plants (Tayyeb Javed et al., 2007). Thus, alternative techniques have also been studied to meet the stringent environmental requirements. SNCR, considered in this paper, is only effective over a relatively narrow temperature range, which precludes its use in many applications.
Basically, during an industrial combustion process, there are possibleperiods to mitigate the emission of NOx from stationary sources through the chimneys: before firing, during the conversion process and after the generation of combustion products (post-combustion)(Tayyeb Javed et al., 2007)urea and cyanuric acid for the explanation of various observations. Computational fluid dynamics (CFD. SCR and SNCR are the two major NOx reduction technologies for post-combustion treatment of flue gas from industrial boilers(Chen, 2006)part of it was injected from the SNCR inlet and part from the SCR inlet, to react with NO in the flue gas. The experiment resulted in the significant reduction of NO. The effects of the operational conditions such as the SNCR reaction temperature, the SCR reaction temperature, and the initial concentration ratio of NH to NO were also investigated. Under the initial NO concentration of 300 ppm (dry, 6% 2O .
For each of the events mentioned above, there are methods for controlling the emission of NOx, which, with their theoretical bases, originate different technologies to meet emission reduction expectations. Each method and technology, in turn, presents their efficiencies and costs that,
after being carefully evaluated, define the attractiveness (or unfeasibility) technical and economical solution (Oliveira, 2014).
The fundamental principle of NOx reduction, which occurs in SNCR, is defined by the following chemical reaction (Blejchař and Dolníčková, 2013):
2 2 2
NH
+
NO
→
N
+
H O
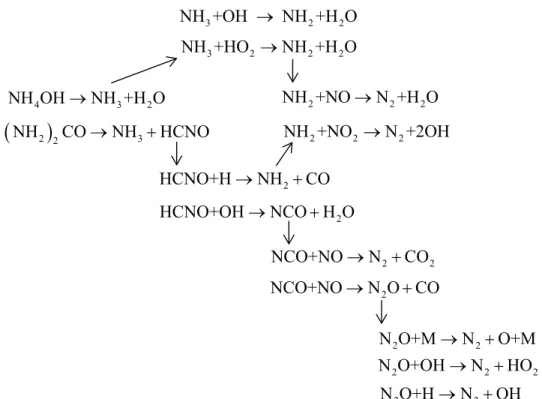
In most full-scale applications, the reagents of choice are either NH3 or urea. In certain laboratory and pilot scale experiments, cyanuric acid has also been investigated as a potential reagent. These three materials can be the source of the reagent to reduce the NO, as summarized in Equation 1. The reaction scheme, shown in Figure 1, illustrates a simplified kinetic mechanism that can take place in a SNCR process.
As observed in Figure 1, the NO reduction is initiated by the reaction of NH3 with hydroxyl radicals, giving amidogen (NH2). In the absence of water vapour, NH2 can also be formed by the following reaction:
3 2
NH
+ →
O
NH
+
OH
The amidogen radical is highly selective towards NO and causes the reduction even in an oxidizing environment. Besides, the reduction of NOx is dependent on the NH2 formation that also depends on the concentration of OH and O. As observed in Figure 1, the reactions are cyclic, with regeneration of OH and O (Tayyeb Javed et al., 2007). The number of reactions is too high, and consequently a
4 3 2
NH OH
→
NH +H O
3 2 2
NH +OH
→
NH +H O
3 2 2 2
NH +HO
→
NH +H O
2 2 2
NH +NO
→
N +H O
2 2 2
NH +NO
→
N +2OH
(
NH
2)
2CO
→
NH
3+
HCNO
2
HCNO+H
→
NH
+
CO
2
HCNO+OH
→
NCO H O
+
2 2
NCO+NO
→
N
+
CO
2
NCO+NO
→
N O CO
+
2 2
N O+M
→
N
+
O+M
2 2 2
N O+OH
→
N
+
HO
2 2
N O+H
→
N
+
OH
Figure 1. Schematic representation of reactions o SNCR (based on Blejchař and Dolníčková, 2013).
(1)
rigorous kinetic model is hard to be applied in practice. In Han et al. (2003), a sensitivity analysis was performed to evaluate the most important reactions. A mechanism containing 105 reactions and 39 species was established.
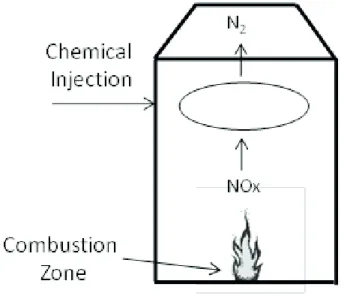
As mentioned, the SNCR is based on the injection of reagents into a furnace to reduce the NOx present. In this technique, in a certain temperature range (generally between 850 °C and 1150 °C), a reagent is injected into the furnace and consequently mixed in a flue gas current containing NOX. Thus, a quick homogeneous reaction occurs in a gas phase such that in spite of the presence of excess oxygen, commonly required in the furnace, the reagent selectively reduces NOx, leaving oxygen untouched during the reaction (Han et al., 2003; Tayyeb Javed et al., 2007). A schematic representation of the SNCR is depicted in Figure 2.
Several studies have firmly established that, among various operating conditions, the temperature is the leading one to determine the output of the SNCR process (Liang et al., 2014). Nevertheless, besides the temperature range, the NOx reduction depends also on the concentration of O2 in the flue gas, the composition of additive (e.g., hydrogen, hydrogen peroxide) and the NH3/NO molar ratio (Blejchař and Dolníčková, 2013).
Variations of velocity and temperature at the reagent injection location can cause operational difficulties due to the sensitivity of the process to these parameters. Furthermore, the physical location of the optimal temperature depends on operating factors such as unit load, fuel type and burner firing strategy (Cremer et al., 2000). Therefore, an accurate representation of the process requires modeling fluid mechanics, heat transfer and chemical kinetic that occur during the burning.
Computational Fluid Dynamics (CFD)
The development of high performance computers has allowed the use of numerical techniques for solving complex problems in engineering and physics. Additionally, numerous studies on the subject of reactive flow, associated with computational advances, have contributed substantially during the last decades to improve the models of computational fluid dynamics (CFD) and the refinement of the simulations, whose numerical answers are gaining increasing acceptance within the industrial community (Maliska, 2004).
The CFD mathematical model is based on the numerical solution of conservation of mass, momentum and energy transport equations (Baltasar et al., 1997). To model a suitable reacting system for obtaining reasonable results, the first step is the linking of the necessary chemical kinetic mechanism with a CFD code. However, to decrease the estimation error in the calculation of species concentration and physical parameters of the fluid, the integration step must be shorter (by at least a factor of 2) than the time
scale of the fastest dynamic change, resultant from the mathematical model. Thus, the grid resolution in the CFD simulation must be fine enough to resolve the fastest chemical reaction.
The process presented in this paper is a classic case of reactive flow, since the flow occurs simultaneously with a set of interdependent and sequential chemical reactions of oxidation and reduction, which converge towards the overall reaction known as combustion. Due to its highly exothermic and extremely fast kinetics characteristics, it can modify the temperature, velocity, composition and density significantly (Oliveira, 2014).
It is worth remarking that the modeling of reactive flows is strongly dependent on the kinetic mechanism chosen for the simulation, which means that the choice of kinetic model is crucial for the quality and accuracy of the results obtained. One of the methods is to apply detailed chemical kinetic mechanisms to CFD code. This is based on post-processing of CFD simulations by a post-processor that links commercial CFD code and a chemical kinetic code that incorporates the detailed chemical kinetic mechanism. The other method is to use a CFD code with reduced or global chemical kinetic mechanism.
LITERATURE REVIEW
(COMPUTATIONAL FLUID DYNAMICS APPLIED DO SOLVE SNCR PROCESS)
To obtain reasonable estimates of SNCR performance, the important physical phenomena that occur inside the furnace, such as heat transfer and kinetic reactions must be considered (Cremer et al., 2000). Variations in velocity and temperature at the reagent injection location can cause operational difficulties over the SNCR process. This fact indicates that transport phenomena play a substantial role in the real SNCR process. Therefore, a proper mixing of additives and NOx in the flue gas, at an optimum reaction temperature, is essential to improve NOx reduction. Mixing, however, is damaged by the high viscosity of flue gas and also by problems in finding available injection points. Thus, CFD modelling is crucial to preview the behaviour of the process (Blejchař and Dolníčková, 2013; Han et al., 2003; Tayyeb Javed et al., 2007).
CFD has been applied to simulate SNCR and furnaces equipment by several authors. Guihua et al. (2011) used CFD tools to simulate and optimize a combustion furnace. The authors investigated flow, combustion, radiative heat transfer and thermal cracking reaction processes in the cracking furnace. Cremer et al. (2000) developed a reduced kinetic mechanism describing SNCR chemistry of a furnace and implemented into a CFD-based turbulent reaction code. Comparisons with detailed chemistry calculations showed that the reduced mechanism can represent the detailed chemistry. Chen (2006) used CFD for simulation of turbulent reacting flow to predict the performance of a SNCR-SCR process. The CFD simulation results indicated a reasonable agreement with the experimental data in the temperature range between 900 and 980°C. In Hill and Douglas Smoot (2000), submodels of nitrogen pollutant formation and destruction were also discussed. Results demonstrated that these models can be useful to predict, at least qualitatively, NOx emissions. Recently, Blejchař and Dolníčková (2013) applied numerical simulation of the SNCR method. The SNCR kinetic model method was described by the governing chemical reaction, according to the National Institute of Standards and Technology (NIST) Chemical database. The proposed chemical kinetic and CFD models were used to simulate two boilers. It was concluded that, if the reagent is better sprayed in the boiler, then the efficiency of SNCR must be increased. In Han et al. (2003) a large number of CFD simulations were done, considering a reduced kinetic model, for pure reburning and hybrid reburn/SNCR in a coal-fired reactor. It was demonstrated, by comparison with experimental data, that the reduced mechanism and the comprehensive modeling gave quite satisfactory results for wide ranges of the parameters.
PROCESS SIMULATION
In our strategy the GRI-Mech 3.0 package compiled by the Gas Research Institute (Smith et al., 2015), was selected to provide the basis for the answers of variations of chemical species involved in processes of formation and destruction of nitrogen oxides during industrial combustion processes.
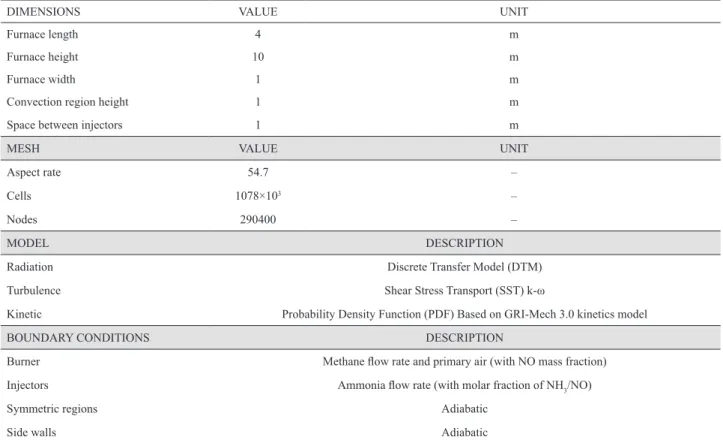
The industrialfurnace studied in this paper is illustred in Figure 3. Such geometry was designed in the software Ansys Design Modeler®. As shown, we have considered
only a symmetric region of the original equipment, with one burner, in order to save the computational effort during the numerical integration. Consequently, an adiabatic symmetric region has been defined. Figure 3 also illustrates the ammonia injection points at different heights of both furnace walls. The domain was then discretized by using the Ansys Meshing® software.The resulting mesh
constructed with tetrahedral and hexahedral elements consists of a minimum orthogonality equal to 1.4·10 -1, aspect ratio equal to 54.7, 1078×103 cells and 290400
nodes. Such a mesh was refined around the burner region. Table 1 summarizes the details of the geometry and mesh statistics.
The mathematical model is based on mass, energy and momentum balances over the control volume represented by the industrial furnace. The FLUENT® software, used in
this research, uses the finite volume method as a numerical strategy. Details of the transport equations and numerical strategy used in such software can be seen in Ansys (2013). For the implementation of the radiation transport a Discrete Transfer Model (DTM) was considered and a Shear Stress Transport (SST) k-ω turbulent model (with corrections of the Reynolds number and curvature) was used for the turbulent flow. Such a model gives highly accurate predictions of the flow separation under adverse pressure gradients. In addition, a Probability Density Function (PDF) technique was considered to model the mean turbulent reaction rate according to the kinetic equations from GRI-Mech 3.0 (Oliveira, 2014). In turbulent combustion computations, FLUENT® usually solves the Navier-Stokes equations for
temperature, velocity, and species concentrations. In order to compute the concentration, a time-averaged formation rate must be computed at each point in the domain using the averaged flow-field information (Ansys, 2013).
Model adjustments were made based on technical documents and operational observations. Sucha procedure was necessary to induce the model to reproduce as closely as possible the behavior of a real scale furnace in relation to the temperature profile and the NOX emission
Figure 3. Furnace geometry.
Table 1. Details of the furnace geometry, mesh, model and boundaries.
DIMENSIONS VALUE UNIT
Furnace length 4 m
Furnace height 10 m
Furnace width 1 m
Convection region height 1 m
Space between injectors 1 m
MESH VALUE UNIT
Aspect rate 54.7 –
Cells 1078×103 –
Nodes 290400 –
MODEL DESCRIPTION
Radiation Discrete Transfer Model (DTM)
Turbulence Shear Stress Transport (SST) k-ω
Kinetic Probability Density Function (PDF) Based on GRI-Mech 3.0 kinetics model
BOUNDARY CONDITIONS DESCRIPTION
Burner Methane flow rate and primary air (with NO mass fraction)
Injectors Ammonia flow rate (with molar fraction of NH3/NO)
Symmetric regions Adiabatic
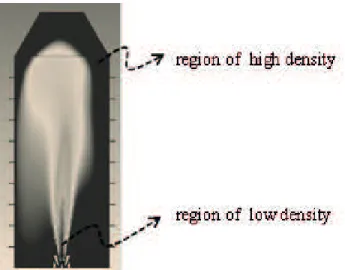
Figure 4. Density profile inside the furnace for heat load relative to 0.04 kg/s fuel flow rate;low density < 0,146 kg/m3; high density> 0,317 kg/m3.
Figure 5. Velocity profile inside the furnace for heat load relative to 0.04 kg/s fuel flow rate; low velocity: < -5 m/s; high velocity: > 5 m/s. and NOX emission levels with the experimental profiles.
After validation, simulations were performed, considering the ammonia injection at different flow rates, heights and initial levels of NOX.
The ammonia injection simulation at different heights (and therefore different temperatures and flue gas velocities) was obtained by the use of three sets of nozzles placed at different heights (5, 7 and 9 m relative to the plan of the floor of the furnace) on both opposite walls of the furnace, totalizing 6 injectors, 3 in each opposite wall. The injections of ammonia were made via two injectors at the same heights at a time.The main boundary conditions are also summarized in Table 1.
The velocity through the nozzles changed from 0.06 m/s for molar ratio NH3/NO = 2 to 0.12 m/s for molar ratio NH3/NO = 4. To simulate different initial concentrations of NOx, a calculated amount of NO (nitric oxide) was injected together with the stream of primary air, emulating the composition of the effluent gas in terms of this pollutant. The details of this study are given in Table 2.
RESULTS
Effect of temperature and injection location
(convective recirculation)
From the analysis of the simulation results, it was possible to identify the occurrence of the phenomenon of recirculation caused by the high temperature gradient observed in the region close to the wall. It occurs due to the heat transfer from the flue gas to the tube wall, which increases the density of the gas in that region and forces a convective recirculation (Oliveira, 2014).
Figure 4 shows the density profile of the flue gas inside the furnace. The gas, in regions close to the wall, evidenced a higher density than the more central regions, close to the flame.
From Figure 5, it is possible to see that a reversed flow near the furnace wall, demonstrated by negative velocity, occurs. This fact will explain and justify some behaviors found in this study, which cannot be represented by experiments involving this type of reactive flow using simplifications such as “plug flow” reactor or CSTR, for example.Additionally, Figure 5evidencesthat there are intermediate zones, where the velocity is close to zero. This means a stagnancy region that provides a higher flue gas residence time than observed in the other zones.
It is important to remark that the low velocity noted at the radiation zone outlet justifies the chemical species concentration increase in that region. Consequently, it is not proper to consider just one residence time, velocity and reaction environment for industrial furnace reactive flow. From these observations, there follows an important aspect: the high concentration of unreacted ammonia on the floor and next to the burner region. The analysis of the
cases demonstrates that the concentration of ammonia in the lower region of the furnace is greater in the case of injection in the plane 5 m and smaller for plane of injection 9 m.
Figure 6 shows the furnace domain illustrating the mass fraction of ammonia (from concentration zero up to 200 mg/kg) (for three injection planes).It was noted in all cases that the concentration of ammonia above the injection plane approaches zero (dark regions). Figure 6 indicates that the recirculation stream drags this species to the lower region of the furnace. This was also an important aspect due to the convective recirculation.
Figure 6. Image of the ammonia concentration in the furnace domain.(a) (left) Injection plane 5 m; (b) (middle) Injection plane 7 m; (c) (right) Injection plane 9 m.
Table 2. Simulated cases.
CASE
methane
flow rate
[kg/s]
injection height
[m]
[NO] mass
fraction
(primary air)
ammonia
flow rate
[kg/s]
molar
fraction
[NH3]/[NO]I
A0 0.040 N/A 0.000408 N/A N/A
A1 0.040 5.08 0.000408 0.000274 1.66
A2 0.040 7.11 0.000408 0.000274 1.66
A3 0.040 9.14 0.000408 0.000274 1.66
A4 0.040 5.08 0.000408 0.000548 3.32
A5 0.040 7.11 0.000408 0.000548 3.32
A6 0.040 9.14 0.000408 0.000548 3.32
B0 0.040 N/A 0.000675 N/A N/A
B1 0.040 5.08 0.000675 0.000441 1.83
B2 0.040 7.11 0.000675 0.000441 1.83
B3 0.040 9.14 0.000675 0.000441 1.83
B4 0.040 5.08 0.000675 0.000882 3.66
B5 0.040 7.11 0.000675 0.000882 3.66
B6 0.040 9.14 0.000675 0.000882 3.66
flow (central vertical plane of the furnace) to the highest part, which is a region of low velocity and reverse flow, which leads the stream with high concentration of NO to descend by regions near the walls. Therefore, temperature values at injection planes 9 and 7 (downward direction) are more appropriate to the reduction of NO. Furthermore, as
shown in Figure 7, the temperature remains constant (about 1050 K) between the planes 6 m and 9 m, with continuous and steep fall from the plane 9 m (downward direction).
that the temperature at plane 5 m is below the optimum temperature for NO destruction, the performance of the case that uses this injection plane has the lowest effi ciency, as shown by the results. It was also possible to identify the low temperature in the region adjacent to the burner, justifi ed by the secondary air stream, which acts as a heat shield.
Based on the association of the aspects mentioned previously, it was concluded that NO present in the region adjacent to the burner, due to the low temperature (below 650 oC) is not signifi cantly attacked by ammonia, which is in high concentration, due to low local velocity. The diff usive mass fl ow drags the gas (rich in ammonia) up to the high temperature region within the fl ame. The high temperature and the high levels of oxygen and ammonia
provide a high rate of formation of NO in these conditions, instead of destroying it.
In all cases studied, it was observed that the highest intensity of destruction of NO by ammonia occurs in two regions: (i) next to the exits of the injectors; (ii) at the interface between the ascending and descending fl ows.
Although the observations of the previous paragraph are valid for all cases, the scenario of application of ammonia in the plane 5 m is that destruction rates are very low, in most of the domain being around 1.25 x 10⁻⁴ mol/(m3.s), while the rate of formation of NO in the fl ame region is around 10-3 mol/(m3.s).
For the injection plane 5 m, the low rates of consumption of NH3 in the zone close to the ammonia injectors can be explained by the relatively low temperature (Figure 9) in
NO concentration [mg/kg]
Figure 7. Temperature and NO concentration along the injection planes.
Figure 8. Reaction rate of ammonia inside the furnace domain: inverse consumption<- 5 x 10⁻³ mol/(cm3.s). (a) (left) Injection plane 5 m; (b)
Figure 9. Temperature profi le in the furnace domain (range 800 to 1300 K). high temperature:> 1300 K; low temperature: <800 K.(a) (left)
Injection plane 5 m; (b) (middle) Injection plane 7 m; (c) (right) Injection plane 9 m.
this part of the domain, which leads to a slow conversion of NH3 to N2 by reaction with NO and leads to no oxidation of NH3 to NO, which occurs only at higher temperature
The high rate of NO formation by the fl ame (up to the plane 3 m) is justifi ed by the low speed in the domain from the fl oor up to the plane 2 m observed in this case (injection in plane 5 m), which causes an accumulation of ammonia in this region and the dragging of the species existing here to the region of high temperature in the combustion zone.
The high temperature in the fl ame region causes a decrease of the selectivity of ammonia to NO. Thus, the NH3 begins to reduce the oxygen due to the NOXconsumption and an intense production of additional NO occurs.
In the case of injection plane 7 m, a signifi cant change in behavior can be observed relative to the plane 5m. Increasing the concentration of NO in the higher areas of the furnace, resultant from the convective fl ows and more suitable temperatures, allows higher conversion rates of
NH3 in N2 near the injection plane 7m. For this plane, ammonia concentrations, relatively lower in the near-burner region, also keep the rate of formation of NO low in the region of high temperature near the fl ame.
The greater the distance between the injection plane and the burner plane, the greater the possible contact time of the ammonia contained in the downward fl ow. For these reasons, the convective recirculation favors the SNCR performance with non-intrusive injectors of ammonia in the highest positions of the furnace. This explains the better performance of NOx reduction by the use of injection plane 9 m.
Initial NOXeff ect
Table 3 shows the eff ect of initial NOX on the SNCR performance. The study considered two values for initial NOx at the radiation zone: 351.7 and 515.0 mg/kg. The
Table 3. Initial NOX eff ect on the SNCR performance.
injector height [m] [NH3]/[NO]I NOI [mg/kg] NOF [mg/kg] reduction %
5 2:1 351.7 333,1 5,3
5 2:1 515.0 361.1 29.9
5 4:1 351.7 303.1 13.8
5 4:1 515.0 353.5 31.4
7 2:1 351.7 264.8 24.7
7 2:1 515.0 300.0 41.7
7 4:1 351.7 253.9 27.8
7 4:1 515.0 284.3 44.8
9 2:1 351.7 232.2 34.0
9 2:1 515.0 284.5 44.8
9 4:1 351.7 222.7 36.7
Figure 10. Molar ratio [NH3]/[NOx] effect – NOx= 351.7 mg/kg.
Figure 11. Molar ratio [NH3]/[NOx] effect – NOI= 515.0 mg/kg. table also summarizes the final values of NOx, NOF.
It is possible to note that, for the same injector plane(injector height) and molar ratio [NH3]/[NO]I, the highest initial NOX value is associated with the highest NO reduction. For example, ammonia injection in 4:1 at 515 mg/kg of NOX causes a decrease of 45.8% while ammonia injection in 4:1 at 351.7 mg/kg of NOX causes a reduction of 36.7%, which is 9.1% smaller.
Notice that all the cases evidence the same behavior, but the initial NO effect seems to decrease as the injection plane increases. This behavior can be associated with
the convective recirculation, which changes the relevant aspects of the reactions of NO formation and destruction (as previously discussed). Thus, it seems that, in cases of ammonia injection in lower planes, the kinetics are governed mostly by NO concentration.
Effect of molar ratio [NH3]/[NO]i
Based on Figure 10, it can be established that, in the range studied, for low initial NO levels, the injector closer to floor level is more sensitive to molar ratio [NH3]/[NO]I effect for NOI = 351.7 mg/kg. This statement is evidenced by a slight positive slope of the curve of the injector 5 when the initial NOX is 351.7 mg/kg. As seen, the slope for the planes 7 and 9 is smaller for this initial NOI.
The slopes shown in Figure 11 indicate that, for higher NOI, in the range studied, the increment of efficiency due to the molar ratio [NH3]/[NO]Iincrease is less significant, even for lower injectors.
CONCLUSIONS
The main conclusions to be drawn from this work are the following:
The model reproduces the behavior of a real furnace with satisfying fidelity reproducing mass and kinetic phenomena that occur inside the furnace.
The existence of convective recirculation within the furnace and its influence on the performance of SNCR were analyzed. The simulations showed that the convective recirculation of flue gases assumes the role of vital importance for performance analysis of existing plants. Moreover, the results evidenced that this occurrence must be taken into account during the design phase due to the potential NOx reduction, principally because the location of ammonia injection can influence the recirculation effect considerably. In this particular case, the plane of injection 9 m was identified as the most suitable.
REFERENCES
Ansys, inc. Ansys Fluent theory guide: manual de orientação. Canonsburg, EUA, 2013.
Adams, B.., Harding, N..: Reburning using biomass for NOx control. Fuel Process. Technol. 54, 249–263 (1998).
Ballester, J.M., Dopazo, C., Fueyo, N., Hernández, M., Vidal, P.J.: Investigation of low-NOx strategies for natural gas combustion. Fuel. 76, 435–446 (1997).
Baltasar, J., Carvalho, M.G., Coelho, P., Costa, M.: Flue gas
recirculation in a gas-fired laboratory furnace: measurements
and modelling. Fuel. 76, 919–929 (1997).
Blejchař, T., Dolníčková, D.: Numerical Simulation of SNCR Technology with Simplified Chemical Kinetics Model. In:
EPJ Web of Conferences. pp. 1–5 (2013).
Chen, L.: Improvement on Hybrid SNCR-SCR Process for NO Control : a Bench Scale Experiment. Chen, Aerosol Air Qual. Res. 6, 30–42 (2006).
Cremer, M.A., Montgomery, C.J., Wang, D.H., Heap, M.P., Chen, J.-Y.: Development and implementation of reduced
chemistry for computional fluid dynamics modeling of
selective non-catalytic reduction. Proc. Combust. Inst. 28, 2427–2434 (2000).
Guihua, H., Honggang, W., Feng, Q.: Numerical simulation
on flow, combustion and heat transfer of ethylene cracking
furnaces. Chem. Eng. Sci. 66, 1600–1611 (2011).
Han, X., Wei, X., Schnell, U., Hein, K.R.G.: Detailed modeling of hybrid reburn/SNCR processes for NOX reduction in
coal-fired furnaces. Combust. Flame. 132, 374–386 (2003).
Hill, S.., Douglas Smoot, L.: Modeling of nitrogen oxides formation and destruction in combustion systems. Prog. Energy Combust. Sci. 26, 417–458 (2000).
Lee, C.Y., Baek, S.W.: /Co Reduction and Thermal Characteristics in Oxygen-Enriched Lpg Flame. Combust. Sci. Technol. 179, 1649–1666 (2007).
Liang, L., Hui, S., Pan, S., Shang, T., Liu, C., Wang, D.: Influence
of mixing, oxygen and residence time on the SNCR process. Fuel. 120, 38–45 (2014).
Mahmoudi, S., Baeyens, J., Seville, J.P.K.: NOx formation and
selective non-catalytic reduction (SNCR) in a fluidized bed
combustor of biomass. Biomass and Bioenergy. 34, 1393– 1409 (2010).
Oliveira, F.C.L., Análise de parâmetros obtidos por simulação
fluidodinâmica para determinação do ponto de injeção
de amônia visando à redução seletiva não catalítica de óxido nítrico; Master Dissertation, Univesidade Federal Fluminense, Brazil, (2014).
Pershing, D.W., Wendt, J.O.L.: Pulverized coal combustion:
The influence of flame temperature and coal composition on
thermal and fuel NOx. Symp. Combust. 16, 389–399 (1977).
Smith, G.P., Golden, D.M., Frenklach, M., Moriarty, N.W., Eiteneer, B., Goldenberg, M., Bowman, C.T., Hanson, R.K., Song, S., Gardiner Jr., W.C., Lissianski, V.V., Qin, Z.. GRI-Mech 3.0, acessed in http://www.me.berkeley.edu/gri_mech, 2015.


![Figure 10. Molar ratio [NH3]/[NOx] effect – NOx= 351.7 mg/kg.](https://thumb-eu.123doks.com/thumbv2/123dok_br/16318136.718992/10.918.212.695.328.625/figure-molar-ratio-nh-nox-effect-nox-mg.webp)
