Structural stability of adenylate kinase from the sulfate-reducing
bacteria
Desulfovibrio gigas
$Olga Yu. Gavel
a,b, Sergey A. Bursakov
a,b, David G. Pina
c, Galina G. Zhadan
c,
Jose´ J.G. Moura
a, Isabel Moura
a, Valery L. Shnyrov
c,*
aDepartamento de Quı´mica, Centro de Quı´mica Fina e Biotecnologia, Faculdade de Cieˆncias e Tecnologia,
Universidade Nova de Lisboa, 2829-516 Caparica, Portugal
b
A.N.Bach Institute of Biochemistry, RAS, Leninsky 33, 117071, Moscow, Russia
c
Departamento de Bioquı´mica y Biologı´a Molecular, Facultad de Biologı´a, Universidad de Salamanca, pza Doctores de la Reina, sn, 37007 Salamanca, Spain
Received 1 December 2003; received in revised form 21 January 2004; accepted 22 January 2004 Available online 23 April 2004
Abstract
A novel adenylate kinase (AK) has recently been purified from Desulfovibrio gigasand characterized as a Co2+/Zn2+ -containing enzyme: this is an unusual characteristic for AKs from Gram-negative bacteria, in which these enzymes are normally devoid of metals. Here, we studied the conformational stability of holo- and apo-AK as a function of temperature by differential scanning calorimetry (DSC), circular dichroism (CD), and intrinsic fluorescence spectroscopy. The thermal unfolding of AK is a cooperative two-state process, and is sufficiently reversible in the 9 – 11 pH range, that can be correctly interpreted in terms of a simple two-state thermodynamic model. The spectral parameters as monitored by ellipticity changes in the CD spectra of the enzyme as well as the decrease in tryptophan intensity emission upon heating were seen to be good complements to the highly sensitive but integral DSC-method.
D2004 Elsevier B.V. All rights reserved.
Keywords:Protein stability; Differential scanning calorimetry; Circular dichroism; Intrinsic fluorescence; Adenylate kinase;Desulfovibrio gigas
1. Introduction
Adenylate kinases (AKs, EC 2.7.4.3) are abundant and ubiquitous enzymes involved in the reversible transfer of the terminal phosphate group from ATP to
AMP. They contribute to maintaining a constant level of cellular adenine nucleotides, which are necessary for energetic metabolism and nucleic acid synthesis. The three-dimensional structures of many AKs from different organisms have already been resolved (see, for example[1]). AKs belong to thea/hclass (with a five-stranded h-sheet surrounded by several a -heli-ces), characteristic of many nucleotide-binding pro-teins [2]. In addition to this protein core, bacterial AKs generally contain two smaller domains that are involved in substrate binding. One of these domains—
0301-4622/$ - see front matterD2004 Elsevier B.V. All rights reserved.
doi:10.1016/j.bpc.2004.01.006
$Olga Yu. Gavel and Sergey A. Bursakov contributed equally
to this work.
* Corresponding author. Tel.: 294465; fax: +34-923-294579.
E-mail address:[email protected] (V.L. Shnyrov).
called LID (the domain closing over ATP)—is well exposed to the solvent and undergoes a large shift during catalysis[3 – 5].
As a rule, AKs from Gram-positive bacteria con-tain a zinc atom, due to the presence of 3 or 4 cysteine residues in the LID domain, whereas AKs from Gram-negative bacteria are usually devoid of metal since their Cys residues are substituted by another four highly conserved amino acids; namely, His, Ser, Asp, and Thr[6]. However, cobalt- and zinc-contain-ing AKs have recently been purified for the first time from two mesophilic Gram-negative sulfate reducing bacteria of genus Desulfovibrio [7]. Preliminary EXAFS data reveal that the metals in these enzymes have a mixed metal – sulfur and metal – oxygen/nitro-gen environment. The presence of metal in the AK of the Gram-negative bacteriaD. gigasis a distinguish-able feature of this enzyme and therefore seems to be an attractive model for studying the structural stability of AKs. The availability of fully metal-replaced (Co2+- and Zn2+-forms) AK as well as the apo-form is of general interest for the determination of the effects of metals on thermal stability.
Here we describe the thermal denaturation of holo-and apo-AK as studied by the DSC method, circular dichroism and intrinsic fluorescence spectroscopy. The results clearly show that the heat-induced unfold-ing is a highly cooperative, two-state sufficiently reversible process for both the apo- and holo-forms ofD. gigas AK, and that removal of metal ion from holo-AK does not significantly perturb the network of hydrogen bonding and Van der Waals interactions in the protein that contribute positively to the enthalpy of stabilization.
2. Experimental
Blue Sepharose, Superdex 75, aprotinin and reagents for electrophoresis were from Bio-Rad Lab-oratories (Richmond, CA, USA). Sodium citrate, tris(hydroxymethyl)aminomethane (Tris), the sodium salt of ethylenediamine-N,N,NV,NV-tetraacetic acid (Na-EDTA), NaCl, cytochromec, carbonic anhydrase, ovalbumin, and bovine serum albumin (BSA) were purchased from Sigma (St. Louis, MO, USA). Bicin-chonic acid protein assay reagent was purchased from Pierce Chemical Co. (Rockford, Ill, USA). All
chem-icals were of the highest purity available. Double-distilled water was used throughout.
D. gigas cells were grown under anaerobic con-ditions in basal medium, as described by LeGall et al. [8], using a lactate/sulfate medium. 500 g cells were harvested at the beginning of the stationary phase, re-suspended in 10 mM Tris – HCl buffer at a ratio of 1:1 (w/v) at pH 7.6, and passed through a Manton – Gaulin press at 9000 psi. The extract was centrifuged at 15 000g for 65 min, after which the pellet was discarded; the supernatant thus obtained was termed the crude extract. This was subjected to further centrifugation at 180 000g for 75 min in order to eliminate the membrane fraction. A clear supernatant containing the soluble fraction was then used for the purification of AK, which was pro-cessed immediately.
All purification procedures were performed at 4jC, and specific activity was determined at each step along the purification process. Phenylmethylsulfonyl fluo-ride (PMSF) at 1 mM concentration was used as an inhibitor of proteases along the purification. The AK fromD. gigaswas purified as described previously[9]
by a two-step procedure involving chromatography performed by FPLC (Pharmacia) on Blue Sepharose fast flow, with specific elution by a mixture of ATP and AMP (1 mM each) and a Superdex-75 gel filtra-tion column (2.655 cm) equilibrated with 50 mM Tris/HCl buffer, pH 7.6, in the presence of 250 mM NaCl, eluting in the same buffer at a flow rate of 2 ml/ min. The bacterial extract ofD. gigaswas loaded onto a Blue Sepharose column equilibrated with 20 mM Tris/HCl, pH 7.6, at 10 ml/h. Fractions containing substrate-free AK ofD. gigaswere collected after the last step of purification, concentrated, and stored at
80jC.
The molecular weight of the AK (24.7 kDa) was determined by gel filtration, using a Superdex 75 column (130 cm) (Pharmacia) at a flow rate of 0.5 ml/min and 200Al of protein or standard was injected. The elution buffer was 50 mM Tris/HCl, pH 7.6, with 250 mM NaCl. The standards used were aprotinin (6.5 kDa), cytochrome c (12.4 kDa), carbonic anhydrase (29 kDa), ovalbumin (43 kDa) and bovine serum albumin (66 kDa).
Gels were prefixed and stained using the method of Merril et al.[11].
The protein concentration was determined by the bicinchonic acid method [12], with bovine serum albumin as standard, and photometrically, using e280=14700 M1 cm1 derived from the sequence
[13].
Quantification of cobalt and zinc was performed by inductively coupled plasma emission analysis.
All metal replacement experiments were carried out in 50 mM Tris/HCl, pH 7.6, with 100 mM NaCl at 4 jC, except where specifically mentioned. All sol-utions were maintained oxygen- (argon-aerated) and metal-free (passed through Chelex 100). The protein concentration was approximately 15AM. The proce-dure included five steps:
1. Modification of cysteines with 800AM p -hydrox-ymercuriphenylsulfonic acid monosodium salt (PMPS) and 0.25 mM Na-EDTA at 20 jC for 1 h to ensure that the reaction was complete or until the total disappearance of spectral bands at 607, 647 and 688 nm, assignable to the d – d electronic transition characteristic of the tetrahedral or dis-torted tetrahedral coordination geometry of Co2+
[14].
2. Removal of PMPS by dialysis (3 h) against buffer with 0.25 mM Na – EDTA.
3. A reduction of mixed disulfides by dialysis (33 h) against buffer containing 0.25 mM Na – EDTA, 1.0 mM Tris(2-carboxyethyl)phosphine (TCEP). 4. Reconstitution of the enzyme with metal ion during
dialysis for 14 h against buffer with 0.1 mM Na – EDTA, 0.8 mM TCEP, 0.025 mM dithiothreitol, and 1.1 mM of the metal for replacement (ZnSO4, CoCl2).
5. Removal of loose metal ions by dialysis for 12 h against buffer.
In the case of apo-protein production, steps 4 and 5 were replaced by extensive dialysis against 25 mM MES, pH 6.0, for 12 h.
Calorimetric experiments were performed on a MicroCal MC-2D differential scanning microcalorim-eter (MicroCal Inc., Northampton, MA) with cell volumes of 1.22 ml, as described previously[15,16]. The calorimetric unit was interfaced with an IBM-compatible computer for automatic data collection and
analysis. The sample and the reference solutions were suitably degassed in an evacuated chamber at room temperature and carefully loaded into the calorimeter to eliminate bubbling effects. An overpressure of 2 atm of dry nitrogen was kept over the liquids in the cells to prevent any degassing during heating. A scanning rate of 60 K/h was employed throughout, since no significant scan rate effect was observable. The baseline was obtained with buffer in both the reference and sample cells. To test the ability of the protein to become renatured, the sample was cooled at the end of the first scan, allowed to re-equilibrate to the starting temperature, and then scanned again. The percentage of renaturation is expressed as the calori-metric enthalpy change (DHcal) of the second scan divided by that of the first one. The excess heat capacity function was analyzed after normalization (M=24700 g/mol) and baseline subtraction, using the ORIGIN software package supplied by MicroCal.
The CD spectra of AK were recorded on a Jasco-715 spectropolarimeter, using a spectral band-pass of 2 nm and a cell pathlengths of 1 mm in the far-ultraviolet range (195 – 250 nm), and of 10 mm in the near-ultraviolet range (250 – 320 nm). Protein concen-trations off0.1 andf0.5 mg/ml, respectively, were
used in these measurements. Four spectra were scanned for each sample at a scan rate of 50 nm/ min and were then averaged. All spectra were back-ground-corrected, smoothed, and converted to mean residue ellipticity [Q]=10MresQobsl1p1, where Mres is the mean residue molar mass (protein molecular mass divided by the number of amino acid residues);Qobsis the ellipticity (degrees) measured at wavelength k; l is the optical path-length of the cell (dm), and p is the protein concentration (mg/ml). Secondary structure analysis of the CD spectra was performed using the SELCON3 software package
[17]. To study the dependence of ellipticity on tem-perature, the samples were heated from 25 to 60jC at a constant heating rate (f1 K/min), using a Neslab
RT-11 programmable water bath.
of residues other than tryptophan. The monochromator slit width was kept at 5 nm in the excitation and emission channels. Fluorescence was measured in the 300 – 400 nm range. Fluorescence measurements of the enzyme were carried out in protein solutions with an optical density of less than 0.2 at 297 nm in order to avoid the inner filter effect. The emission spectra were corrected for instrumental spectral sensi-tivity. The position of the middle of a chord drawn at the 80% level of maximum intensity (kmax) was taken as the position of the spectrum. The temperature dependence of the emission fluorescence spectra was investigated using thermostatically-controlled water circulating in a hollow brass cell-holder. Sample tem-perature was monitored with a thermocouple im-mersed in the cell under observation. The heating rate was between 0.8 and 1.2 K/min, and spectra were collected at the desired temperatures over the entire temperature range. The fluorescence spectra were analyzed on the basis of the model of discrete states of tryptophan in proteins[18,19].
3. Results and discussion
The thermal stability of AK was studied using high-sensitivity differential scanning calorimetry.
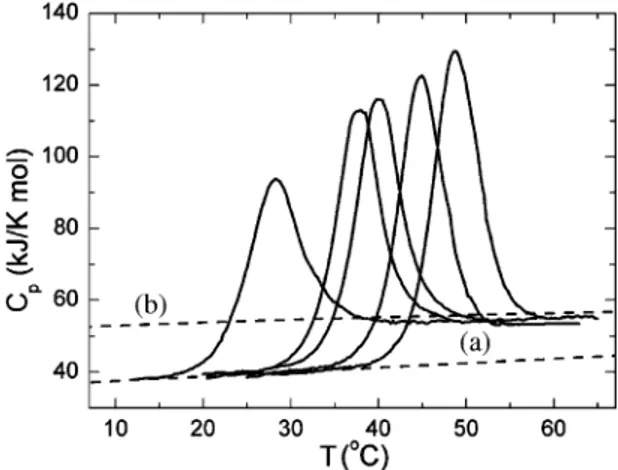
Fig. 1 shows the temperature dependence of the partial molar heat capacity of holo-AK at different pH values. One requirement for a correct thermody-namic description of any process is that it should be reversible. Therefore, a logical first step is to show that after unfolding the native structure can be regained. AK exhibits maximum reversibility between pH 9.0 and 11.0, whereas its ability to become renatured upon cooling is dramatically reduced below and above these pH values. Accordingly, a detailed investigation of the thermal stability of AK was carried out at pH 10.0. The extent of reversibility, measured by relative area recovery, seen on the second scan of AK depended on the temperature at which the first scan was terminated before cooling the samples in preparation for the second scan. When the first scan was allowed to proceed up to a temperature at which the transition was 50% complete, the repeat-ed scans revealrepeat-ed more than 90% reversibility. How-ever, heating up to temperatures at which the transition was 90% complete reduced reversibility
by up to 70%. When the first scan progressed up to higher temperatures, the transition fell to 20% of its initial enthalpy value. From additional experiments with a change in the intensity of scattered light at 365 nm with temperature (data not shown) we concluded that the main reason for the loss of reversibility inD. gigasAK is aggregation, as reflected in the increase in scattered light intensity at temperatures higher then those at which the thermally induced transitions were complete. It may therefore be concluded that this aggregation does not distort the parameters of DSC transitions for AK.
Under the conditions of this experiment (protein concentration of 33 AM, 100 mM sodium carbonate buffer, pH 10.0), the thermal denaturation transition of holo-AK occurred at 45jC and was characterized by an enthalpy change of 510 kJ/mol and a change in the partial heat capacity associated with denaturation, DCp, of approximately 8.4 kJ/(K mol). At 25 jC, the partial specific heat capacity (Cp) of the native state was 38.5 kJ/(K mol) or 1.55 J/(K g) and was independent of changes in pH providing the protein was in the native state; these values are close to those of other compact globular proteins with a native tertiary structure [20,21]. Because this Cp value is characteristic of a compact protein structure, it may be
Fig. 1. Partial molar heat capacity of holo-AK as a function of temperature in order from left to right for pH 10.9, 10.5, 10.3, 10.0 and 9.5 (100 mM NaHCO3/NaOH buffer). Dashed line (a) shows
inferred that at pH 10.0 holo-AK has a globular structure with a developed hydrophobic core. Upon heating, holo-AK denatured with extensive heat ab-sorption and an increased heat capacity, reaching values slightly lower than those expected for com-pletely unfolded holo-AK (Fig. 1, curve b), calculated from its amino acid composition according to [22]. The lower values suggest that the polypeptide chain retains its residual structure and is probably not fully hydrated after thermal denaturation.
We also found that the DSC scans measured for AK were practically independent of the scan rate. Experiments performed at scanning rates of 30, 60 and 90 K/h gave similar denaturation profiles that differed in the transition temperatures (Tm) by less than 0.3 K, indicating the absence of any kinetic effects under our experimental conditions. All this suggests that the data could be analyzed using ther-modynamic models[15,23 – 25].
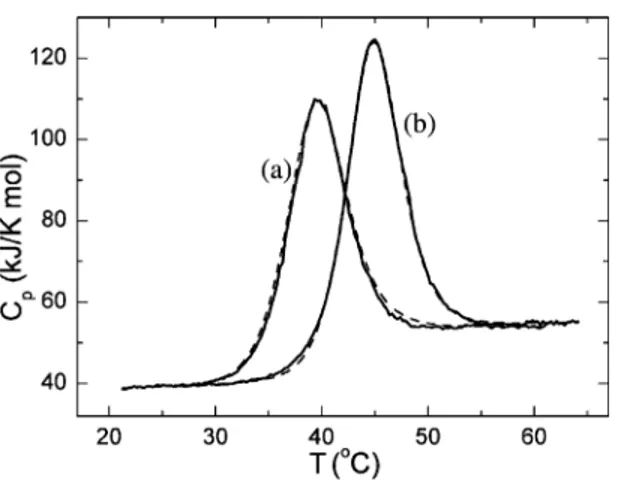
The removal of metal ions from holo-AK to generate the apo-form only slightly destabilized the protein (Fig. 2). The compact ordered structure of apo-AK unfolded cooperatively, with extensive heat absorption and a significant increase in heat capacity that was comparable to that of holo-AK. The heat capacity of native apo-AK was the same as its holo-counterpart; namely, 38.4 kJ/(K mol) at 25jC. This suggests that removal of metal ions does not result in any appreciable decomposition of the structure of
AK or any significant exposure of non-polar groups to water. The calorimetric enthalpy values obtained for the denaturation of AK at different temperatures were comparable to the van’t Hoff enthalpy values, the latter calculated assuming that the transition fits a simple two-state denaturation model. In the pH region where thermal transitions of AK are substan-tially reversible, the changes in calorimetric enthalpy were linearly related to Tm. Fig. 3 shows the dena-turation enthalpies calculated from the heat absorp-tion profiles of apo- and holo-AK as a funcabsorp-tion of Tm measured at different pH values. The change in heat capacity upon unfolding determined from the slope of the straight line was DCp=8.3F0.2 kJ/(K
mol). Although the metal-free form of AK is char-acterized by lower stability, the enthalpy effect associated with disruption of its tertiary structure was similar to that of the holo-form. This suggests that removal of metal ion from holo-AK does not significantly perturb the network of hydrogen bond-ing and Van der Waals interactions in the protein that contribute positively to the enthalpy of stabilization. The thermodynamic characteristics of apo- and holo-AK thermal denaturation are shown in Table 1. It can be seen from the data offered in this Table that both the holo- and apo-forms of AK have a temper-ature of maximum stability, Ts, close to12 jC.
The far – UV CD spectra of the native holo- and apo-AK (Fig. 4a) are characterized by double minima
Fig. 2. Partial molar heat capacity of holo-AK (b) and apo-AK (a) as a function of temperature at pH 10.0. The dashed lines represent the results of non-linear least squares fittings of the experimental data (solid lines) to the two-state unfolding model as implemented in the Origin software package. The protein concentration wasf30AM.
at 208 and 222 nm, indicative of ana-helical struc-ture. Since until now there are no any other data about structure ofD. gigasAK, we estimated the secondary structure contents of both the apo- and metal-bound states of AK following the SELCON3 self-consistent method[17]. The contents in thea-helix (f45%),h
-strand (f10%), andh-turn (f15%) for holo-AK are
in reasonably good agreement with the data obtained by CD spectroscopy for Escherichia coli wild-type AK[26]as well as with those reported for the spatial structure ofE. coli and pig muscle AK, which show the presence of nearly 55% ofa-helices, 15% of h -strands, and 10% of h-turns [27,28]. Removal of metal ion from holo-AK caused a reduction in the a-helical content up tof30% and an increase in the
h-strands andh-turns of up tof20%.
The CD spectra of holo- and apo-AK in the near – UV region are shown in Fig. 4b. Both the holo- and apo-forms of AK only show the contribution of tyrosine in this region of spectrum. The near – UV CD spectrum of apo-AK revealed that the tyrosine band seen in the apo-protein was substantially de-creased, its amplitude being approximately one-third that of the holo-AK. This suggests an important increase in the motility of the tyrosine side chains after removal of metal ion, probably related to a loss of thea-helical structure in the backbone.
Additional evidence for some conformational change and for the decreased stability of apo-AK in comparison with holo-AK was provided by melting
curves, shown in Fig. 4a (insert, symbols). The process of thermal denaturation of AK at pH 10.0 was monitored by changes in molar ellipticity at 220 nm, since at this wavelength both the pre-transitional and post-transitional baselines show only a weak temperature-dependence. By fitting these data to the van’t Hoff equation (see, for example[29]):
RT lnðQNQTÞ=ðQTQDÞ ¼DHvHðT=Tm1Þ ð1Þ
where QN, QD and QT are the mean molar elliptic-ities at 220 nm for the native protein, the denatured protein and the protein at the current temperature, T, for the enthalpy of the denaturation and transition temperatures for the holo- and apo-forms of AK we found values ofDHvH
holo¼485F15 kJ=mol, DHapovH ¼
456F12 kcal=mol , Tm , h o l o= 4 5 . 2F1. 2 jC an d Tm,apo=40.0F1.1 jC, which are in good agreement with the calorimetric results (see Table 1). The reversibility of the thermal denaturation of this enzyme was verified by superimposing the transition curves recorded at different heating rates from 0.6 to 2 K/min, and by restoring the CD spectra upon heating to 60 jC, followed by re-equilibration at 20 jC. The result of this verification was similar to the results obtained in the calorimetric investigations, demonstrating approximately 80% reversibility.
In the thermally denatured state at 60jC, the far – UV CD spectra of AKs are weakly negative and
Table 1
Thermodynamic parameters ofD. gigasAK denaturation determined by DSCa
Protein pH Tm DHcal DHvH R DGo(5jC) Ts DGo(Ts)
(jC) (kJ/mol) (kJ/mol) (kJ/mol) (jC) (kJ/mol)
holo-AK 9.5 48.8 548 519 1.06 33.0 10.7 52.4
10.0 45.0 510 498 1.02 26.7 10.9 46.2
10.3 39.9 473 477 0.99 19.5 12.0 40.4
10.5 37.6 448 481 0.93 16 11.8 36.6
10.9 27.9 368 377 0.98 3.6 13.1 25.8
apo-AK 10.0 39.7 473 469 1.01 19.3 12.8 40.4
10.4 33.7 414 423 0.98 10.7 12.8 31.8
10.6 29.3 393 402 0.98 5.4 14.4 29.2
a
Tmis defined as the temperature at the midpoint of the unfolding transition (S.D. isF0.2 K);DH(Tm) is the calorimetric enthalpy
determined by the area under the heat capacity curve with a S.D. ofF3%;DHvHis the van’t Hoff enthalpy calculated with the equation
DHvH
=4RTm(DCp/DHcal); the free energy changes,DGo, were calculated with the modified Gibbs – Helmholtz equation:DGo(T)=DH(Tm)(1T/Tm)
+DCp[(TTm) –Tln(T/Tm)], whereDCpis the difference between the heat capacities of the intact and denatured states obtained from the slope of the
graph of the temperature-dependence ofDH(Tm) by pH variation ofTmwith S.D. ofF0.4 kJ/(K mol) (Fig. 3); the temperature of maximum stability,
almost devoid of features in the 205 – 230 nm region. Nevertheless, analysis of the CD spectra of denatured AKs revealed that some of the secondary structure elements of this enzyme persisted even in this state. Thermal denaturation led to an almost complete disappearance of a-helices and an increase of up to
f60% in unordered structure, while the content inh
-strand structures remained practically unchanged. Environmental changes in aromatic side chains resulting from conformational changes in the tertiary structure of AKs were measured by intrinsic fluores-cence spectroscopy.Fig. 5(symbols) shows the emis-sion spectra of intact and thermally denatured AK in the holo- and apo-forms at pH 10.0. Upon exitation at 297 nm, native AK showed a broad emission band,
with spectral positions of 332.3 and 333.8 nm for the holo- and apo-forms, respectively. In the thermally denatured state at 60 jC, a loss of f80% of the
intensity was observed, along with a red shift in the tryptophan fluorescence spectrum position to 349.5 nm, in case of holo-AK, and to 344.6 nm in case of apo-AK. These changes are consistent with the pro-cess of protein unfolding and the exposure of buried tryptophan residues to the solvent with solvent quenching [30]. Analysis of the spectra of native AK in terms of the model of discrete states of tryptophan residues in proteins [18,19] revealed that the tryptophan residues of only form I (internal tryptophan residues forming a 2:1 exciplex with neighboring polar groups of the protein) provided the contribution to the emission of holo-AK (Fig. 5a, continuous line), while for apo-AK (Fig. 5c, interrupted lines), apart from this form (form I) (f75%), there was nearly 25% of contribution of
form II (indole chromophores at the protein surface in contact with bound water molecules). As noted above,
Fig. 4. Far – UV CD (a) and near – UV CD (b) of holo-AK (solid lines) and apo-AK (dashed lines) at pH 10.0. Thick lines are used for the presentation of AK in the native state at 20jC while thin lines are used for the presentation of the AK in the denatured state at 60jC. The insert illustrates the change in mean residual molar elliptisity at 220 nm as a function of temperature for holo-AK (triangles) and apo-AK (circles) at pH 10.0. The solid lines are the result of fitting the data assuming a two-state unfolding model (Eq. (1)).
the thermal denaturation of AK resulted in a pro-nounced red shift of the tryptophan fluorescence spectrum (Fig. 5b,d). The tryptophan residues of form III (external tryptophan residues in contact with free water molecules) provided the main contribution to the emission in this state. Nevertheless, even in this state some of the tryptophan residues were not com-pletely hydrated, especially in case of apo-AK, where nearly 25% of them remained in the denatured state in form I.
Fig. 6depicts the denaturation process for holo- and apo-AK, monitored by the temperature dependence of normalized fluorescence intensity (symbols). These transitions are qualitatively similar to the CD-moni-tored transitions, with a single sharp transition and with no intermediate conformations. A non-linear least-squares fitting of the experimental data to the same two-state model as in the CD experiments (lines across symbols) yielded results (DHvH
holo¼519F21kJ=mol,D HapovH¼481F20kcal=mol , Tm,holo=45.1F1.0 jC and
Tm,apo=40.2F1.1jC) consistent with those determined
by CD and DSC. Thus, all the independent experimen-tal approaches used in this work support the idea that the thermal denaturation of AK can be interpreted in terms of the simple two-state model.
Finally, it is interesting to compare the thermal stability of holo-AK fromD. gigas with that of AK obtained from the apo-form of this enzyme by
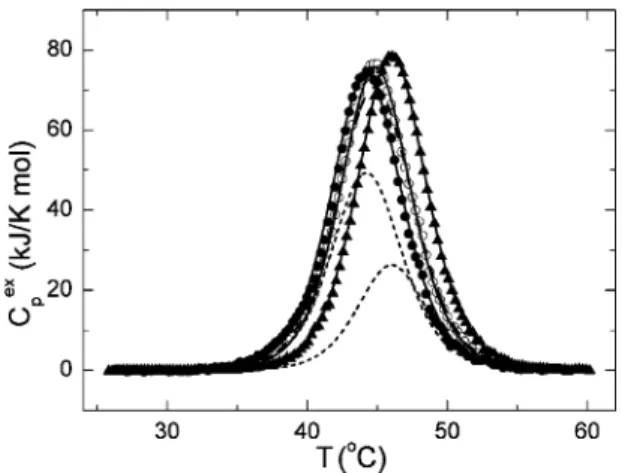
recon-struction of the pure Co2+-form or pure Zn2+-form through the addition of an excess of the corresponding metal. Fig. 7 (symbols) shows the molar excess heat capacity functions for the holo-, Co2+- and Zn2+-forms ofD. gigasAK at pH 10.0 obtained after correction of the experimental traces for the instrumental baseline and the chemical baseline in accordance with [31]. The excess heat capacity functions obtained for these forms of AK were analyzed by fitting the data to the two-state unfolding model (continuous lines through the experimental points). The means of the enthalpy of the denaturation and transition temperatures for these AK forms are DHz i n c=498F8 kJ/mol,
DHcobalt=519F6 kJ/mol (see Table 1 for holo-AK),
Tm, zinc=44.3F0.2oC andTm, cobalt=46.1F0.2jC, in
good agreement with the two-state unfolding model, and the parameters of these transitions correspond to the linear relationship between DHcalandTmfor AK shown inFig. 3. It is interesting that the DSC profile for holo-AK can be simulated (dashed line inFig. 7) by a simple summing up 2/3 of the thermal capacity function of the Zn2+-form AK and 1/3 of the thermal capacity function of the Co2+-form AK (short-dashed lines inFig. 7). On the assumption of a constant mean of the enthalpy value per amino acid residue, this permits us to estimate the Zn2+: Co2+ correlation as
Fig. 7. Temperature-dependence of the excess molar heat capacity of holo-AK (open circles), the Zn2+-form of AK (closed circles) and
the Co2+-form of AK (closed triangles) at pH 10.0. Solid lines
represent the results of non-linear least-square fitting of the experimental curves to the two-state denaturation model. Short dashed lines represent in order from left to right 2/3Cp
ex
of the Zn2+ -form of AK and 1/3Cp
ex
of the Co2+-form of AK, while the dashed line is the sum of these contours.
roughly 2:1 forD. gigasAK. Taking into account that AKs have only one metal-binding site per molecule of protein, it is possible to assume that the wild-typeD. gigas AK consists of a mixture of Zn2+- and Co2+ -forms at a proportion of 2:1.
Acknowledgements
This work was supported in part by the Fundacßa˜o para a Cieˆncia e a Tecnologia, Portugal, fellowships BD/13775/97 to OYG, BPD/3518/00 to SAB, SFRH/BD/1067/2000 to DGP, and NATO Scientific Programme Fellowships for Spain, call 2002 to GGZ. We thank Dr F. Gavilanes from the Uni-versidad Complutense de Madrid, Spain, for CD experimental facilities and Dr Z.S. Zhou from the University of Michigan for the prototype of the metal substitution method.
References
[1] S. Cheek, H. Zhang, N.V. Grishin, Sequence and structure classification of kinases, J. Mol. Biol. 320 (2002) 855 – 881. [2] G.E. Schulz, Binding of nucleotides by proteins, Curr. Opin.
Struct. Biol. 2 (1992) 61 – 67.
[3] G.E. Schulz, E. Schiltz, A.G. Tomasselli, R. Franck, M. Brune, A. Wittinghofer, et al., Structural relationships in the adenylate kinase family, Eur. J. Biochem. 161 (1986) 127 – 132. [4] G.E. Schulz, C.W. Mu¨ller, K. Diederichs, Induced-fit
move-ments in adenylate kinases, J. Mol. Biol. 213 (1990) 627 – 630. [5] C. Vonrhein, G.J. Schlauderer, G.E. Schulz, Movie of the structural changes during a catalytic cycle of nucleoside monophosphate kinases, Structure 3 (1995) 483 – 490. [6] V. Perrier, S. Burlacu-Miron, S. Bourgeois, W.K. Surewicz,
A-M. Gilles, Genetically engineered zinc-chelating adenylate ki-nase fromEscherichia coliwith enhanced thermal stability, J. Biol. Chem. 273 (1998) 19 097 – 19 101.
[7] S.A. Bursakov, O.Yu. Gavel, G.Di. Rocco, J. Lampreia, V.L. Shnyrov, G.N. George, et al., Cobalt/zinc as structural ele-ments of bacterial adenylate kinase, J. Inorg. Biochem. 86 (2001) 163.
[8] J. LeGall, G. Mazza, N. Dragoni, Cytochrome c3 of Desulfo-brio gigas, Biochim. Biophys. Acta 99 (1965) 385 – 387. [9] O. Barzu, S. Michelson, Simple and fast purification of
Escherichia coliadenylate kinase, FEBS Lett. 153 (1983) 280 – 284.
[10] U.K. Laemmli, Cleavage of structural proteins during the as-sembly of the head of bacteriophage T4, Nature 227 (1970) 680 – 685.
[11] C.R. Merril, D. Goldman, S.A. Sedman, M.H. Ebert,
Ultra-sensitive stain for proteins in polyacrylamide gels shows re-gional variation in cerebrospinal fluid proteins, Science 211 (1981) 1437 – 1438.
[12] P.K. Smith, R.I. Krohn, G.T. Hermanson, A.K. Mallia, F.H. Gartner, M.D. Provenzano, et al., Measurement of protein using bicinchonic acid, Anal. Biochem. 150 (1985) 76 – 85. [13] S.C. Gill, P.H. von Hippel, Calculation of protein extinction coefficients from amino acid sequence data, Anal. Biochem. 182 (1989) 319 – 326.
[14] D.R. Garmer, M. Kraus, Ab initio quantum chemical study of the cobalt d – d spectroscopy of several substituted zinc enzymes, J. Am. Chem. Soc. 115 (1993) 10 247 – 10 257. [15] D.G. Pina, C.S. Oliveira, A.C. Sarmento, M. Barros, E. Pires,
G.G. Zhadan, et al., Thermostability of cardosin A from Cyn-ara cardunculusL, Thermochim. Acta 402 (2003) 123 – 134. [16] D.G. Pina, J. Go´mez, E. Villar, L. Johannes, V.L. Shnyrov,
Thermodynamic analysis of the structural stability of the shiga toxin B-subunit, Biochemistry 42 (2003) 9498 – 9506. [17] N. Sreerama, S.Yu. Venyaminov, R.W. Woody, Estimation of
the number of alpha-helical and beta-strand segments in pro-teins using circular dichroism spectroscopy, Protein Sci. 8 (1999) 370 – 380.
[18] E.A. Burstein, N.S. Vedenkina, M.N. Ivkova, Fluorescence and the location of tryptophan residues in protein molecules, Photochem. Photobiol. 18 (1973) 263 – 279.
[19] Y.K. Reshetnyak, E.A. Burstein, Decomposition of protein tryptophan fluorescence spectra into log-normal components. II. The statistical proof of discreteness of tryptophan classes in proteins, Biophys. J. 81 (2001) 1710 – 1734.
[20] P.L. Privalov, Stability of proteins: small globular proteins, Adv. Protein Chem. 33 (1979) 167 – 241.
[21] J. Go´mez, J.V. Hilser, D. Xie, E. Freire, The heat capacity of proteins, Proteins Struct. Funct. Genet. 22 (1995) 404 – 412. [22] G.I. Makhatadze, P.L. Privalov, Heat capacity of proteins. I.
Partial molar heat capacity of individual amino acid residues in aqueous solution: hydration effect, J. Mol. Biol. 213 (1990) 375 – 384.
[23] L.-N. Lin, A.B. Mason, R.C. Woodworth, J.F. Brandts, Calo-rimetric studies of serum transferrin and ovotransferrin. Esti-mates of domain interactions, and study of the kinetic complexities of ferric ion binding, Biochemistry 33 (1994) 1881 – 1888.
[24] A. Ruiz-Arribas, G.G. Zhadan, V.P. Kutyshenko, R.I. Santa-marı´a, M. Cortijo, E. Villar, et al., Thermodynamic stability of two variants of xylanase (Xys1) fromStreptomyces halstedii
JM8, Eur. J. Biochem. 253 (1998) 462 – 468.
[25] D.E. Kamen, Y. Griko, R.W. Woody, The stability, structural organization, and denaturation of pectate lyase C, a parallel beta-helix protein, Biochemistry 39 (2000) 15 932 – 15 943. [26] M. Monnot, A.-M. Gilles, I. Saint Girons, S. Michelson, O.
Baˆrzu, S. Fermandjian, Circular dichroism investigation of
Escherichia coli adenylate kinase, J. Biol. Chem. 262 (1987) 2502 – 2506.
[28] G.E. Schulz, M. Elzinga, F. Marx, R.N. Schirmer, Three di-mensional structure of adenylate kinase, Nature 250 (1974) 120 – 123.
[29] M.H. Hecht, J.M. Sturtevant, R.T. Sauer, Effect of single ami-no acid replacements on the thermal stability of the NH2-terminal domain of phage lambda repressor, Proc. Natl. Acad. Sci. USA 81 (1984) 5685 – 5689.
[30] Y. Chen, M.D. Barkley, Toward understanding tryptophan fluorescence in proteins, Biochemistry 37 (1998) 9976 – 9982. [31] K. Takahashi, J.M. Sturtevant, Thermal denaturation of strep-tomyces subtilisin inhibitor, subtilisin BPN’, and the inhibi-tor – subtilisin complex, Biochemistry 20 (1981) 6185 – 6190. [32] W.J. Becktel, J.A. Schellman, Protein stability curves,