Original article
RBAFSSOCIEDADE BRASILEIRA DE ATIVIDADE FÍSICA E SAÚDE
Brazilian Journal of Physical Activity and Health
RBAFS
Revista Brasileira de Atividade Física & Saúde
SOCIEDADE BRASILEIRA DE ATIVIDADE FÍSICA E SAÚDE
Brazilian Journal of Physical Activity and Health
RBAFS
Revista Brasileira de Atividade Física & Saúde SOCIEDADE BRASILEIRA DE ATIVIDADE FÍSICA E SAÚDE
Brazilian Journal of Physical Activity and Health Rev Bras Ativ Fis Saúde p. 273-285 DOI:
http://dx.doi.org/10.12820/rbafs.v.18n3p273
1 Universidade Federal do Pampa (UNIPAMPA).
2 Universidade Luterana do Brasil campus São Jerônimo (ULBRA/SJ).
3 Universidade Federal de Pelotas (UFPel). 4 Universidade Federal do Rio Grande do Sul (UFRGS).
Proposals of cardiorespiratory fitness
classification in children and adolescents:
literature review
Propostas de classificação da aptidão
cardiorrespiratória de crianças e
adolescentes: revisão de literatura
Gabriel Gustavo Bergmann1
Mauren Lúcia de Araújo Bergmann1
Rodrigo Baptista Moreira2
Eraldo dos Santos Pinheiro1
Alexandre Carriconde Marques3
Pedro Curi Hallal3
Adroaldo Gaya4
Abstract
The aim of this study was to evaluate the procedures for the creation of cardiorespiratory fit-ness (CRF) cutoff points for children and adolescents. A search in Medline/Pubmed, Web of Science, Scopus, Lilacs, Scielo, and Google Scholar electronics database was performed. The keywords were used in English and Portuguese language. Inclusion criteria were: a) have been published as a full paper; b) have been published until December 2011; c) have as an aim to propose a cutoff point for cardiorespiratory fitness of children and/or adolescent or to present the procedure used by institutions to propose these cutoff points proposed; and d) the proposed cutoff points should be specific for healthy children and/or adolescent. The electronic search resulted in 10 documents. Two documents presented the procedures of institutions to propose cutoff points and eight presented originals proposals. Among the originals proposals, seven used the ROC curve as methodological procedure. For laboratory measures of CRF, methodological-ly consistent propositions of cutoff points were found. For the field tests, methodologicalmethodological-ly con-sistent cutoff points are available for the 9 minutes run/walk (9-min) test and 20 meters shuttle run test (20-m) for children and adolescents aged 07 to 12 and 10 to 18 years old respectively. In summary, laboratory measurements as well as some field tests have cutoff points elaborated with adequate methodological approaches for the assessment of the CRF of children and adolescents. Keywords
Physical fitness; Reference standards; Child; Adolescent; Health.
Resumo
O objetivo deste estudo de revisão foi avaliar os procedimentos metodológicos para a elaboração dos pontos de corte para a aptidão cardiorrespiratória (ApC) de crianças e adolescentes. Foi realizada uma busca nas bases de dados eletrônicas Medline/Pubmed, Web of Science, Scopus, Lilacs, Scielo, e Google Acadêmico. Os termos foram utilizados em português e inglês para a busca. Para serem incluídos, os documentos deve-riam: a) ter sido publicados na íntegra; b) ter sido publicados até dezembro de 2011 c) ter como objetivo propor pontos de corte para a aptidão cardiorrespiratória de crianças e/ou adolescentes ou apresentar os procedimentos utilizados por instituições para esta proposição; e d) os pontos de corte propostos deveriam ser específicos para crianças e/ou adolescentes saudáveis. Foram encontrados 10 documentos. Dois docu-mentos apresentaram os procedidocu-mentos adotados por instituições para a proposição de pontos de corte e oito apresentaram propostas originais. Dentre as propostas originais, sete utilizaram a curva ROC como procedimento metodológico. Para medidas laboratoriais da ApC existem pontos de corte propostos de for-ma metodologicamente consistente. Para os testes de campo, pontos de corte estão disponíveis para os testes de corrida/caminhada de 9 minutos (9-min) e corrida de vai e vem de 20 metros (20-m) para crianças e adolescentes de 07 a 12 anos e de 10 a 18 respectivamente. Em conclusão, tanto medidas laboratoriais quanto alguns testes de campo apresentam pontos de corte elaborados de forma metodologicamente ade-quada para a avaliação de ApC crianças e adolescentes.
Palavras-chave
IntRoductIon
Cardiorespiratory fitness (CRF) is a major variable in physical fitness. (1) There is a body of evidence showing its remarkable ability to protect against a number of chronic degenerative conditions especially cardiovascular diseases. (2-4) Low levels of CRF in adults have been associated with cardiovascular diseases (CVD) and their risk factors. (2-4) The same seems to be true in children and adoles-cents. (5-7) In addition to short-term benefits, evidence suggests that physically active young individuals with high CRF may also enjoy long-term benefits. (8) Research studies on this subject have gained in importance in the light of evidence suggesting that atherosclerotic plaque formation in the coronary arteries begins during childhood calling for prevention at an early stage of life. (9, 10)
Bearing in mind that CVD risk factors begin early in childhood and adoles-cence (9, 10), that CRF has been inversely associated with these risk factors (5-8) and that CVD is the leading cause of death in developed countries and most developing countries, (11, 12) it is crucial to measure, assess and monitor CRF during childhood and adolescence. Despite a great deal of data supporting CRF measurement and monitoring in children and adolescents, there is still lack of consensus among scientific experts on some issues including the best approach for CRF assessment and classification. (13, 14)
Since CRF is associated to the prevention of CVD and their risk factors, it is key to measure it so that to identify individuals who are most likely to develop these diseases. But how to identify these individuals? What would be an optimal CRF level to reduce CVD risk factors in children?
To address these questions and ensure that CRF is a valid protective measure against CVD and a useful tool for screening children and adolescents with great-er likelihood of having CVD risk factors, it is necessary to identify those young individuals with suboptimal CRF levels. It is thus essential to develop criteria for CRF classification (cutoffs) based on scores that can indicate a significant increase in the likelihood of CVD risk factors. (13, 14)
The aim of this study was to review approaches for determining CRF cutoffs in children and adolescents.
Methods
We conducted a search in Medline/Pubmed, Web of Science, Scopus, LILACS, SciELO, and Google Scholar databases. Two researchers conducted a search with the following keywords or terms in both English and Portuguese: (“cardiorespi-ratory fitness” OR “cardiorespi(“cardiorespi-ratory endurance” OR “cardiorespi(“cardiorespi-ratory ability”
OR “aerobic fitness” OR “aerobic endurance” OR “aerobic ability” OR “maximal
oxygen uptake” OR “VO2 max”) AND (“cutoffs” OR “evaluation criteria” OR “clas-sification” OR “evaluation”) AND (“children” OR “adolescent” OR “school” OR “youth”). The search was restricted to publications written in either English or Portuguese. To help ensuring that we have not missed any relevant papers in our search, we reviewed all references of the papers selected.
We applied the following inclusion criteria: full-text articles; date of publi-cation until December 2011 (no restrictions for older publipubli-cations); the paper’s purpose was to propose CRF cutoffs in children and/or adolescent or to describe approaches used for determining these cutoffs; and the proposed cutoffs should be
specific for healthy children and/or adolescent. We excluded all published papers that did not meet these criteria.
Results
We selected 10 papers that either proposed CRF cutoffs in children and/or ad-olescent or described approaches for determining these cutoffs. (15-24) Nine of them (15, 17-24) were retrieved from the electronic databases. Cureton and War-ren study (15) was not available as full-text online so we first reviewed its title and abstract and, given its importance to our study purposes, we reviewed the printed full-text version available from the Universidade Federal do Rio Grande do Sul School of Physical Education library collection. One paper included in our review (16) was not found directly from the online databases but rather from other pa-pers’ references.
With regard to type of study, eight were original studies, (16-24) one was a review study, (15) and one a book chapter. (16) Of the original papers, three pro-posed CRF cutoffs under field test conditions (17-19) and five propro-posed cutoffs based on stress tests on a treadmill or cycle ergometer where VO2 max was esti-mated using equations (20-23) or directly measured with gas analysis. (24)
Of the eight original articles, seven used the receiver operating characteris-tic (ROC) curve analysis with CVD risk (dichotomous) variables for proposing CRF cutoffs. (17-23) The independent (test) variable varied among studies. Five of them used estimated oxygen consumption (17, 20-23) and two used data of field tests (18, 19) (distance in the 9-minute run/walk test or time in the one-mile run/walk test). Rodrigues et al. study (24) proposed a classification for CRF based on direct measures of VO2 max by gender divided into quintiles.
The review study (15) detailed the approaches for determining CRF cutoffs based on the one-mile run/walk test according to the Physical Best (25) and orig-inal Fitnessgram classifications. (26) The book chapter found (16) described the approaches to determine the cutoffs for the one-mile run/walk test, the 20-meter shuttle run test, and the one-mile walk test used by the Fitnessgram classification until 2010. Table 1 shows the general characteristics of the 10 papers selected.
table 1 – Methodological characteristics and main findings of the eight papers reviewed.
Study Objective Sample CRF test Procedure Results
Cureton and Warren (15)
To describe the approach to propose CRF cutoffs for the Physical Best25 and Fitnessgram26
classi-fications
- One-mile run/walk test
Theoretical approach based on the one-mile run/walk test given that: a) VO2 max in adults is associated with reduced chances of death and chronic diseases; b) movement economy development; c) VO2
max development during childhood and adoles-cence
Cutoffs (maximum time in minutes and seconds) Females (age) 5=17:00 6=16:00 7=15:00 8=14:00 9=13:00 10=12:00 11=12:00 12=11:30 13=11:30 14=10:30 15=10:30 16=10:30 17=10:30 Males (age) 5=16:00 6=15:00 7=14:00 8=13:00 9=12:00 10=11:00 11=11:00 12=10:00 13=09:30 14=08:30 15=08:30 16=08:30 17=08:30
Study Objective Sample CRF test Procedure Results
Cureton and Plowman (16)
To describe the approach to propose CRF cutoffs for the Fitnessgram clas-sification used until 2010
-One-mile run/walk test; 20-meter shuttle test;
one-mile walk test
Equations were proposed to estimate VO2 max with data of three tests: the one-mile run/walk test, 20-meter shuttle run test and one-mile walk test
vO2 max (mL/kg/min) Males of all ages: 42 Females of age ≤9 years – 40 10 years – 39 11 years – 38 12 years – 37 13 years – 36 ≥14 years – 35 Moreira et al. (17)* To propose CRF cutoffs in adolescents aged 10–18 years 450 children in northern Portugal
Five equations to predict VO2 max with data of
the 20-meter run/walk test
ROC curve with data of metabolic risk z-scores (≥1 SD z-score = risk). VO2 max (mL/kg/min) Males 41.8, 42.6 and 47.1 Females 39.5 and 46.4 Bergmann et al.(18) To propose CRF cutoffs in schoolchildren aged 7–12 years 1,413 school-children in the city of Caxias do Sul, RS, Brazil
9-minute run/walk test
ROC curve with data of a composite score of 3 dichotomized CVD risk factors
Cutoffs (minimum dis-tance covered in meters) Females (age) 7=1.090 8=1.101 9=1.103 10 =1.157 11 =1.179 12 =1.210 Males (age) 7=1.157 8=1.157 9=1.174 10=1.208 11=1.384 12=1.425 Guedes et al.(19) To propose CRF cutoffs in adolescents aged 15–18 years 281 students in the city of Londrina, PR, Brazil.
One-mile run/walk test
ROC curve with data of a score based on the sum of scores of 8 CVD risk factors divided into quintiles.
Cutoffs (maximum time in minutes and seconds) Males 7:50 Females 9:50 Lobelo et al. (20) To proposed CRF cutoffs in adolescents aged 12–18 years 1,247 adoles-cents partici-pating in the National Health and Nutrition Examination Survey (1999– 2002), US
Stress test on a treadmill combined with estimates
of VO2 max
ROC curve with data of CVD risk factor z-score (≥ 1 SD z-score = risk). vO2 (mL(kg/min) Males age 12 to 15 44.1 Males age 16 to 19 40.3 Females age 12 to 15 36 Females age 16 to 19 35.5 Ruiz et al. (21) To propose CRF cutoffs in children aged 9–10 years
873 children from two
coun-tries participat-ing in the Eu-ropean Youth
Heart Study
Stress test on a cycle er-gometer with estimates
of VO2 max
ROC curve with data of a CVD risk factor z-score (<P75 z-score = risk).
vO2 max (mL/kg/min) Males 42
dIscussIon
The aim of this study was to conduct a literature review on the methodological approaches for proposing criteria for the classification of CRF in children and adolescents. Children and young individuals with high CRF are less likely to have CVD risk factors (5-7) and may enjoy other long-term health benefits (8) so it is key to identify the optimal CRF level that can may have a protective role. We conducted a search in the literature and selected 10 papers relevant to our research, eight original articles and two describing approaches to determine CRF cutoffs in children and/or adolescents. We mentioned before in general the approaches and results found in the papers reviewed but their strengths and limitations deserve special consideration.
The first paper reviewed (15) described the approaches used in the Physical
Best (25) and the original Fitnessgram CRF classification. (26) The field test of
choice to determine the cutoffs was the one-mile run/walk test. The same ap-proach was used in both classifications, but they set different VO2 max values by gender and age. The Fitnessgram study (26) used VO2 max values as proposed
Study Objective Sample CRF test Procedure Results
Adegboye et al. (22) To propose CRF cutoffs in children aged 9 to 15 years. 4,500 students from four Euro-pean countries (Portugal, Den-mark, Estonia and Norway)
Stress test with direct measurement of VO2 max and stress test on a cycle
ergometer with es-timates of VO2 max
ROC curve with data of a CVD risk factor score (z-score) (≥ 1 SD z-score = risk). vO2 max (mL/(kg/min) Males age 9 - 43,6 age 15 - 46.0
Females (vO2 max)
age 9 - 37.4 age 15 - 33.0 Welk et al. (23) Proposed CRF cutoffs in adolescents aged 10–18 years suggesting risk and healthy fitness zones (CRF z-score). 1,240 adoles-cents partici-pating in the National Health and Nutrition Examination Survey (1999– 2002), US
Stress test on a treadmill with estimates of VO2
max
ROC curve with data of metabolic syndrome with a test variable (VO2 max) adjusted by the LMS method and then standardized (z-score) vO2 max (mL(kg/min) Females age 10–18** (Risk) 35.3 to 37.3 (CRF z-score) 38.6 to 40.2 Males age 10–18** (Risk) 37.3 to 41.2 (CRF z-score) 40.2 to 44.3 Rodrigues et al. (24) To propose CRF cutoffs in students aged 10–14 years 380 students in the city of Vitória, Brazil Cardiorespiratory fitness classification in children and adolescents Stratification V O2 max value by genders into quintiles (very poor, poor, fair, good and excellent)
vO2 max (mL/kg/min) Females Very poor <33.0 Poor 33.0–36.4 Fair 36.5–38.7 Good 38.8–42.4 Excellent ≥42.5 Males Very poor <38.7 Poor 38.7–43.3 Fair 43.4–47.9 Good 48.0–52.2 Excellent ≥52.3
* Of the five equations analyzed by Moreira et al.,17 three for males (Matsuzaka et al ,34 Barnett et al.,35 and Ruiz et al.36 ) and two for females
(Matsuzaka et al.,34 and Barnett et al.35 ) were significantly capable of identifying low/high metabolic risk. ** VO
2 max values in the categories of
risk and CRF z-score vary with age (10–18 years). For an age- and gender-specific value see reference 23. CRF = cardiorespiratory fitness; VO2
by Cooper (27), i.e., 42 mL/kg/min for males and 35 mL/kg/min for females, while the Physical Best study (25) used values 8 mL/kg/min greater taking into ac-count that VO2 max decreases with age and higher values are thus expected during childhood and adolescence. Therefore, the cutoffs proposed by the Physical Best study (25) are more stringent than those proposed by the Fitnessgram group. (26)
After setting VO2 max values taking into account consumption changes, me-chanical efficiency, and performance in the one-mile run/walk test during the childhood and adolescence years the researchers performed several theoretical adjustments and proposed age- and gender-specific cutoffs for the one-mile run/ walk test. Table 2 summarizes the data on which was based the determination of cutoffs for one-mile run/walk test. Details of this approach can be found in the Cureton and Warren study. (15)
table 2 – Use of the Fitnessgram classification26 for establishing the criteria for the one-mile run/walk test. Males
Age (years) 5 6 7 8 9 10 11 12 13 14 15 16 17
VO2 max (mL/kg/min) criterion 42 42 42 42 42 42 42 42 42 42 42 42 42
% VO2 max consumed 80 80 85 85 85 90 90 95 98 100 100 100 100
Running VO2 max (mL/kg/min) 34 34 36 36 36 38 38 38 40 41 42 42 42 Average running speed (km/h) 6 6 8 8 8.8 8.8 8.8 9.7 10 10.8 10.8 10.8 10.8 Time (min) to complete the mile 16.1 16.1 12.1 12.1 12.1 11 11 10 9.7 8.7 8.7 8.7 8.7 Test criterion (min/sec) 16 15 14 13 12 11 11 10 9:30 8:30 8:30 8:30 8:30
Females
Age (years) 5 6 7 8 9 10 11 12 13 14 15 16 17
VO2 max (mL/kg/min) criterion 40 40 40 40 40 39 38 37 36 35 35 35 35
% VO2 max consumed 80 80 85 85 85 90 90 95 98 100 100 100 100
Running VO2 max (mL/kg/min) 32 32 34 34 34 35 34 35 35 35 35 35 35 Average running speed (km/h) 5.5 5.5 7.5 7.5 7.5 8.4 8.2 8.4 8.4 9.2 9.2 9.3 9.3 Time (min) to complete the mile 17.6 17.6 12.9 12.9 12.9 11.5 11.8 11.8 11.6 10.4 10.4 10.3 10.3 Test criterion (min/sec) 17 16 15 14 13 12 12 12 11:30 11:30 10:30 10:30 10:30 Adapted from Cureton and Warren15. vO
2 max = maximum oxygen consumption.
The main strengths of the Physical Best (25) and Fitnessgram (26) classifications include the use of a widely used field test; the use of test data to determine the cut-offs (maximum time to cover the test distance) without suing an equation to es-timate VO2 max; and the fact that they proposed age- and gender-specific cutoffs taking into account that test performance is affected by these two variables. (28,
29) However, most important, they provided (25, 26) alternative criteria for the
classification of CRF (and other health-related components of physical fitness). The limitations of the proposed cutoffs lie on the fact that, despite supported by sound theoretical arguments, they derived from extrapolated VO2 max values that in adults are associated with the prevention of cardiovascular conditions and their risk factors and have not undergone empirical validation. Therefore, the proposed
Physical Best (25) and Fitnessgram (26) classifications should be used with caution
in children and adolescents.
The second paper reviewed (16) bears some similarities with the previously discussed paper. The proposed cutoffs were based on the original Fitnessgram clas-sification used until 2010 and applied the same procedures for selecting refer-ence VO2 max values and determining cutoffs. However, rather than using VO2 max values as proposed by Cooper, (29) the authors used the values proposed by
Blair et al. (30) Another important difference is that, in addition to the one-mile run/walk test, they also suggested that the 2-meter shuttle run test and the one-mile walk test are alternative tests to measure CRF. For the classification of the results from these three tests, the Fitnessgram group proposed the use of equations to estimate VO2 max (Cureton et al. equation (31) for the one-mile run/walk test; Léger et al. (32) for the 20-meter shuttle run test; and Kline et al. (33) for the one-mile walk test) and subsequent comparison against reference values. They also claimed that the classification of results of the one-mile run/walk test and the 20-meter shuttle run test can be made using cutoffs in minutes and seconds (time to cover one mile in the one-mile run/walk test) and in number of shuttles (the 20-meter shuttle run test), thus not requiring the use of equations to estimate VO2 max.
In addition to the above discussed strengths of the Physical Best (25) and the original Fitnessgram (26) classifications, the main strengths of the
proposed Fit-nessgram classification in Cureton and Plowman paper (16) include the use of
three field tests (two of them—the one-mile run/walk test and the 20-meter shuttle run test— have been widely used in other studies), and the use of equa-tions to estimate VO2 max with comparisons against reference values. The main limitation of this approach is similar to that seen in the Physical Best (25) and
Fitnessgram (26) classification, i.e., the fact that the proposed cutoffs derived from
extrapolated VO2 max values that in adults are associated to the prevention of cardiovascular conditions and their risk factors and have not undergone empirical validation.
Two other limitations should be considered. One is the use of equations to estimate VO2 max values. Although it reflects an improvement to the original
Fitnessgram (26) classification, it should be interpreted and used with caution
because the coefficients of determination (R2)) were 0.518, 0.504 and 0.774 for
the equations proposed by Cureton et al. (31), Léger et al. (32) and Kline et al. (33), respectively. The second limitation is the use of the one-mile walk test and the equation proposed by Kline et al. (33). Although R2 in the equation to
predict VO2 max was high (0.774), it should be stressed that the study sample consisted of adults aged 30 to 60 years rather than children and adolescents. Giv-en these strGiv-engths and limitations, the cutoffs for the one-mile run/walk test and the 20-meter shuttle run test should be used with caution. In addition, the cutoffs for the one-mile walk test should not be used because the equation to estimate VO2 max is adequate for adults, but not for children and adolescents.
Considering all the above discussed regarding the use with caution of VO2 max values obtained from equations with data of CRF field tests, we chose to review Moreira et al. study (17) as the third paper. They conducted a ROC curve analysis to investigate the fitness of five equations with data from the 20-meter shuttle run test to estimate VO2 max and screen children at metabolic risk. The area under the ROC curve, sensitivity and specificity (Table 3) showed that three equations (34-36) were able to predict metabolic risk in males and only two equa-tions (34, 35) were able to predict it in females.
Two main strengths of the classification proposed by Moreira et al. (17) should be noted. First, and possibly most important, it evidenced that equations to esti-mate VO2 max with data from the 20-meter shuttle run test (34-36) were able to screen children at metabolic risk. Second, it showed that the equations that were able to screen children at metabolic risk had high R2 (0.80 in the Matsuzaka et al.
study (34) and 0.672 in the Barnett et al. study (35)) and small differences between estimates and measured VO2 max values, (36) thus removing—at least for the 20-meter shuttle run test— the limitations of the classification proposed by Cure-ton and Plowman (16) associated to moderate R2 in equations to estimate VO
2 max. Despite its strengths, Moreira et al. (17) classification has some limita-tions. First, the use of equations to predict VO2 max values. Although Matsuzaka et al. (34), Barnett et al., (35) and Ruiz et al. (36) equations showed high R2 and
low prediction errors, estimation errors can occur. A second limitation is that the sample used comprised students aged 10 to 18 years, and none of the three equa-tions that were able to screen individuals at metabolic risk covers all ages. More-over, the analysis should have included the results of the test (number of shuttles) and proposed age- and gender-specific minimum number of shuttle cutoffs for metabolic risk prevention. Finally, it is important to note that even though the 20-meter shuttle run test is widely applied, subjects should be familiar with the test procedure for its successful application. Despite these limitations, the cut-offs proposed by Moreira et al. (17) to estimate VO2 max using Matsuzaka et al., (34) Barnett et al., (35) and Ruiz et al. (36) equations are adequate for assess-ing CRF in children and adolescents usassess-ing the 20-meter shuttle run test.
The strengths of the fourth paper reviewed (18) included the use of a widely used field test (the 9-minute run/walk test); empirical validation using the ROC curve analysis through association with CVD risk factors and adequate measures of the area under the ROC curve with a good balance between sensitivity and specificity (Table 3); the use of test results to propose cutoffs (distance in meters covered within nine minutes) without using an equation to estimate VO2 max; and the determination of age- and gender- specific cutoffs taking into account that test performance is affected by these two variables. (37, 38)
Another important aspect of Bergmann et al. (18) classification is that these authors pointed out that when the Physical Best (25) and the original
Fitness-gram classifications (26) were used for the classification of CRF measured by the
9-minute run/walk test they showed inadequate balance between true positives and true negatives associated to CVD risk factors and thus are not appropriate alternatives. It is a major finding since many studies (39-44) have used the 9-min-ute run/walk test to assess CRF in children and adolescents. Since there were no cutoffs available for this test, these studies (39-44) were based on the Physical
Best (25) or the Fitnessgram classifications. (26) They adjusted the cutoffs for the
one-mile run/walk test expressed in time (minutes and seconds) to distance (me-ters) so that they could be used in the 9-minute run/walk test.
The proposed Bergmann et al. classification (18) seems a suitable tool for CRF assessment in children and adolescents using the 9-minute run/walk test as it allows to screening individuals at increased CVD risk. However, it has a major limitation as it fails to provide cutoffs for adolescents over 13. Because of that and the fact that the study evidenced that adjustment of the Physical Best (25) or the Fitnessgram (26) cutoffs is not an appropriate strategy, there are no CRF cut-offs available to study adolescents over 13 using the 9-minute run/walk test.
The fifth paper (19) proposed CRF cutoffs that were similar to those proposed by Bergmann et al. (18). Many of the strengths are the same as mentioned before including adequate measures of the area under the ROC curve and good sensitiv-ity and specificsensitiv-ity (Table 3). The main differences between these two studies in-clude different tests applied (the 9-minute run/walk test in Bergmann et al. study
(18) and the one-mile run/walk test in Guedes et al. study (19)) and subject age.
The former studied individuals aged 7 to 12 years and proposed age- and gen-der-specific cutoffs. On the other hand, Guedes et al. (19) investigated individuals aged 15 to 18 years and proposed only gender-specific cutoffs applying the same classification criteria for individuals aged 15 to 18 years. This is the main limita-tion of Guedes et al. approach (19) because age is a factor that affects test perfor-mance (one-mile run/walk test), and older individuals show better results. (28,
29) Therefore, the cutoffs proposed by Guedes et al. (19) for the one-mile run/
walk test should be used with caution.
The sixth, (20) seventh, (21) eighth, (19) and ninth (19) papers reviewed are discussed together because of their similar methods and results. Lobelo et al., (20) Ruiz et al., (21) Adegboye et al., (22) and Welk et al. studies (23) deter-mined CRF cutoffs through the ROC curve analysis of VO2 max estimates and pooled CVD risk factors. All four studies found similar cutoffs ranging be-tween 37.6 and 46.0 mL/kg/min for males and 33.0 and 40.1 mL/kg/min for females. They all found adequate measures of the area under the ROC curve, sensitivity and specificity (Table 3) indicating that CRF assessed by VO2 max (measured in stress tests on a treadmill and cycle ergometer) is able to identify children and adolescents with increased chance of developing CVD risk factors. These strengths make these approaches adequate for the classification of CRF.
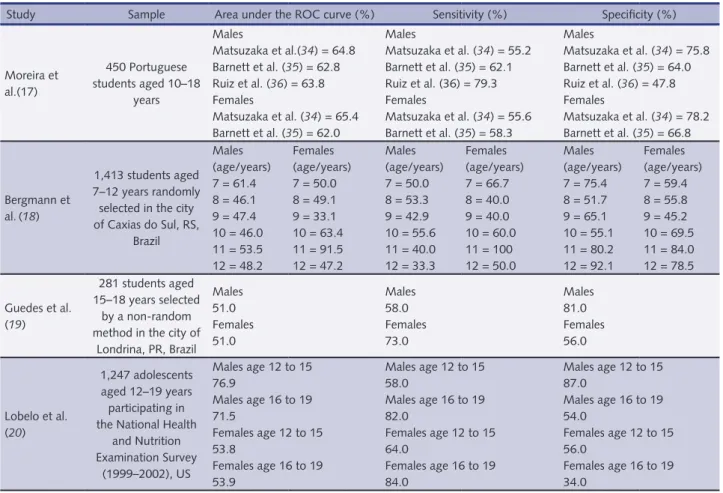
table 3 – Results of the ROC curve analysis in seven studies17-23 that used this approach to propose cardiorespiratory fitness cutoffs. Study Sample Area under the ROC curve (%) Sensitivity (%) Specificity (%)
Moreira et al.(17) 450 Portuguese students aged 10–18 years Males Matsuzaka et al.(34) = 64.8 Barnett et al. (35) = 62.8 Ruiz et al. (36) = 63.8 Females Matsuzaka et al. (34) = 65.4 Barnett et al. (35) = 62.0 Males Matsuzaka et al. (34) = 55.2 Barnett et al. (35) = 62.1 Ruiz et al. (36) = 79.3 Females Matsuzaka et al. (34) = 55.6 Barnett et al. (35) = 58.3 Males Matsuzaka et al. (34) = 75.8 Barnett et al. (35) = 64.0 Ruiz et al. (36) = 47.8 Females Matsuzaka et al. (34) = 78.2 Barnett et al. (35) = 66.8 Bergmann et al.(18) 1,413 students aged 7–12 years randomly selected in the city of Caxias do Sul, RS, Brazil Males (age/years) 7 = 61.4 8 = 46.1 9 = 47.4 10 = 46.0 11 = 53.5 12 = 48.2 Females (age/years) 7 = 50.0 8 = 49.1 9 = 33.1 10 = 63.4 11 = 91.5 12 = 47.2 Males (age/years) 7 = 50.0 8 = 53.3 9 = 42.9 10 = 55.6 11 = 40.0 12 = 33.3 Females (age/years) 7 = 66.7 8 = 40.0 9 = 40.0 10 = 60.0 11 = 100 12 = 50.0 Males (age/years) 7 = 75.4 8 = 51.7 9 = 65.1 10 = 55.1 11 = 80.2 12 = 92.1 Females (age/years) 7 = 59.4 8 = 55.8 9 = 45.2 10 = 69.5 11 = 84.0 12 = 78.5 Guedes et al. (19) 281 students aged 15–18 years selected by a non-random method in the city of
Londrina, PR, Brazil Males 51.0 Females 51.0 Males 58.0 Females 73.0 Males 81.0 Females 56.0 Lobelo et al. (20) 1,247 adolescents aged 12–19 years participating in the National Health and Nutrition Examination Survey (1999–2002), US Males age 12 to 15 76.9 Males age 16 to 19 71.5 Females age 12 to 15 53.8 Females age 16 to 19 53.9 Males age 12 to 15 58.0 Males age 16 to 19 82.0 Females age 12 to 15 64.0 Females age 16 to 19 84.0 Males age 12 to 15 87.0 Males age 16 to 19 54.0 Females age 12 to 15 56.0 Females age 16 to 19 34.0
Besides the above discussed characteristics, it should be stressed that the pro-posed strategy by Welk et al. (23) included methodological procedures that were more robust than those described in the other studies reviewed. They performed the ROC curve analysis and adjusted VO2 max values using the LMS method— where the parameter L is converted to minimize the sum of squared deviations of the variable; the M parameter is the median within each stratum, and the S parameter is the coefficient of variation of each stratum—and by age and gender (z-scores). This strategy was designed to reduce the impact of physical growth and maturation on CRF during childhood and adolescence. Welk et al. group (23) also proposed two age- and gender-specific cutoffs: one is a value below which individ-uals fall within a risk zone and the second one is a value above which individindivid-uals fall within a healthy fitness zone. They first identified among optimal balance be-tween sensitivity and specificity scenarios cutoffs with the highest sensitivity and specificity. Then they fixed the cutoff with the lowest VO2 max as the risk zone cutoff and the one with the highest VO2 max as the healthy fitness zone cut-off. The classification proposed by Welk et al.(23) has been adopted as the current
Fitnessgram CRF cutoffs.
Although appropriate methodology was used, the cutoffs proposed by Lobelo et al. (20), Ruiz et al. (21), Adegboye et al. (22) and Welk et al. (23) have at least two limitations. One limitation is the use of VO2 max estimated using equations with data from stress tests on a treadmill and cycle ergometer rather than data from stress tests combined with ergospirometry. The second limitation closely associated with that and is lack of convenience of using stress tests on a treadmill and cycle ergometer in population-based studies because testing procedure is rela-tively time-consuming and requires a laboratory setting with qualified staff.
The last paper reviewed (24) was the single study to propose a classification for CRF in children and adolescents using a direct measure of VO2 max, which was its main strength. Another strength of this study is that it provided a national
Study Sample Area under the ROC curve (%) Sensitivity (%) Specificity (%)
Ruiz et al. (21)
873 children aged 9–10 years from two countries participating in the European Youth Heart Study Males 67.0 Females 68.0 Males 65.0 Females 65.0 Males 61.0 Females 67.0 Adegboye et al. (22) 4,500 children aged 9–15 years from four European countries (Portugal, Denmark, Estonia and Norway)
Males age 9 67.0 Males age 15 69.0 Females age 9 68.0 Females age 15 55.0 Males age 9 55.4 Males age 15 55.6 Females age 9 49.7 Females age 15 29.7 Males age 9 79.3 Males age 15 86.4 Females age 9 85.9 Females age 15 79.9 Welk et al. (23) 1,240 adolescents participating in the National Health and Nutrition Examination Survey (1999–2002), US Males 83.1 Females 77.2
Males within the risk zone 59.0
Males within the healthy fitness zone
85.0
Females within the risk zone 50.9
Females within the healthy fitness zone
72.2
Males within the risk zone 92.3
Males within the healthy fitness zone
59.0
Females within the risk zone 92.8
Females within the healthy fitness zone
reference for VO2 max in individuals aged 10 to 14 years. However, because this approach was not based on an analysis of the risk, we believe that Rodrigues et al. (24) classification is the weakest one among the proposed classifications here reviewed. They proposed an arbitrary classification for CRF by gender divided into quintiles (very poor; poor; fair; good; and excellent).
Measurement, assessment and monitoring of CRF in children and adolescents should be encouraged as there is consistent evidence suggesting its association with cardiovascular risk at early stages of life. CRF classification should be based on the most adequate criterion of the approach to measurement. When CRF is measured using laboratory stress testing, there are available methodologically adequate cutoffs. When it is measured using field testing, the use of specific cut-offs proposed based on the analysis of risk is recommended. Moreover, caution is advised when using equations to predict VO2 max from field test data.
RefeRences
1. American College of Sports Medicine. Guidelines for exercise testing and prescription. 4thed. Philadelphia: Lea e Febiger; 1991.
2. Blair SN, Kohl HW Iii, Paffenbarger RS Jr, Clark DG, Cooper KH, Gibbons LW. Physi-cal fitness and all-cause mortality: a prospective study of healthy men and women. JAMA 1989;262(17):2395–2401.
3. Lamonte MJ, Barlow CE, Jurca R, Kampert JB, Church TS, Blair SN. Cardiorespiratory Fit-ness Is Inversely Associated With the Incidence of Metabolic Syndrome: A Prospective Study of Men and Women. Circulation 2005;12(4):505-512.
4. Lee CD, Blair SN, Jackson AS. Cardiorespiratory fitness, body composition, and all-cause and cardiovascular disease mortality in men. Am J Clin Nutr 1999;96(3):373-380.
5. Janssen I, Cramp WC. Cardiorespiratory Fitness Is Strongly Related to the Metabolic Syn-drome in Adolescents. Diabetes Care 2007;30(8):2143-2144.
6. Ruiz JR, Ortega FB, Rizzo NS, Villa I, Hurtig-Wennlöf A, Oja L, et al. High cardiovascular fitness is associated with low metabolic risk score in children: the European Youth Heart Study. Pediatr Res 2007;61(3):350–355.
7. Brage S, Weddrkopp N, Ekelund U, Franks PW, Wareham NJ, Andersen LB, Froberg K. Euro-pean Youth Heart Study (EYHS) Features of the metabolic syndrome are associated with ob-jectively measured physical activity and fitness in Danish children: the European Youth Heart Study (EYHS). Diabetes Care 2004;27(9):2141–2148.
8. Hallal PC, Victora CG, Azevedo MR, Wells JCK. Adolescent Physical Activity and Helth. Sports Med 2006;36(12)1019-1030.
9. Berenson GS, Srinivasan SR, Bao W, Newman III WP, Tracy RE, Wattigney WA. Association between multiple cardiovascular risk factors and atherosclerosis in children and young adults. The Bogalusa Heart Study. N Engl J Med 1998;38(23):1650–1656.
10. Mcgill HC Jr, Mcmahan CA, Zieske AW, Malcom GT, Tracy RE, Strong JP. Effects of non-lipid risk factors on atherosclerosis in youth with a favorable lipoprotein profile. Circulation 2001;103(11):1546–1550.
11. Lopez AD, Mathers CD, Ezzati M, Jamison DT, Murray CJL. Global and regional bur-den of disease and risk factors, 2001: systematic analysis of population health data. Lancet 2006;367(9524):1747-1757.
12. WHO. World Health Organization. The Global Burden of Disease: 2004 UpDate. Geneva: WHO Press; 2008.
13. Harris J, Cale L. A review of children’s fitness testing. Eur Phys Educ Rev 2006;12(2):201–225. 14. Zhu W, Mahar MT, Welk GJ, Going SB, Cureton KJ. Approches for development of
criterion-referenced standards in health-related youth fitness tests. Am J Prev Med 2011;41(4S2):S68-S76.
15. Cureton KJ, Warren GL. Criterion-Referenced Standards for Youth Health-Related Fitness Test: A Tutorial. Res Q Exerc Sport 1990;61(1):07-19.
16. Cureton KJ, Plowman SA. Aerobic fitness assessment. In: Welk GJ, Meredith MD. Fitness-gram / ActivityFitness-gram Reference Guide. 3th. Ed. Dallas, TX: The Cooper Institute, 2008. Avail-able from: <http://www.cooperinstitute.org> [2011 jan 10].
17. Moreira C, Santos R, Ruiz JR, Vale S, Sores-Miranda L, Marques AI, Mota J. Comparison of different VO2max equations in the ability to discriminate the metabolic risk in Portuguese adolescents. J Sci Med Sport 2011;14(1):79-84.
18. Bergmann GG, Gaya ACA, Halpern R, Bergmann MLA, Rech RR, Constanzi CB et al. Pontos de corte para a aptidão cardiorrespiratória e a triagem de fatores de risco para doenças cardiovasculares na infância. Rev Bras Med Esporte 2010;16(5): 339-343.
19. Guedes DP, Guedes JERP, Barbosa DS, Oliveira JA. Aptidão física relacionada à saúde e fa-tores de risco predisponentes às doenças cardiovasculares em adolescentes. Rev Port Cien Desp 2002;2(5):31-46.
20. Lobelo F, Pate RR, Dowda M, Liese AD, Ruiz JR. Validity of cardiorespiratory fitness criteri-on-referenced standards for adolescents. Med Sci Sports Exerc 2009;41(6):1222-1229. 21. Ruiz JR, Ortega FB, Rizzo NC, Villa I, Hurtig-Wennlof FA, Oja L, Sjostron M. High
Car-diovascular Fitness Is Associated with Low MetabolicRisk Score in Children: The European Youth Heart Study. Pediatr Res. 2007;61(3):350-355.
22. Adegboye ARA, Andersen SA, Froberg K, Sardinha LB, Heitmann BL, Steene-Johannsen, Kolle E, Andersen LB. Recommended aerobic fitness level for metabolic health in children and adolescents: a study of diagnostic accuracy. Br J Sports Med 2010;44(9):256-262.
23. Welk GJ, Laurson KR, Eisenmann JC, Cureton KJ. Development of youth aerobic-capacity stan-dards using receiver operating characteristic curves. Am J Prev Med 2011;41(4S2):S111-S116. 24. Rodrigues AN, Perez AJ, Carletti L, Bissoli NS, Abreu GR. Valores de consume máximo de
oxigênio determinados pelo teste cardiopulnar em adolescentes: uma proposta de classificação. J Pediatr 2006;82(6):426-430.
25. AAHPERD. Physical Best. Virginia: American Alliance for Health, Physical Education and Recreation and Dance; 1988.
26. Institute for Aerobic Research. Fitnessgram User’s Manual. Texas: Institute for aerobics Re-search; 1987.
27. Cooper KH. Aerobics. New York: Bantam Books; 1968.
28. Beets MW, Pitetti KH. One-Mile Run/Walk and Body Mass Index fron Ethnically Diverse Sample of Youth. Med Sci Sports Exerc 2004;36(10): 1796–1803.
29. Glaner MF. Aptidão física relacionada à saúde de adolescentes rurais e urbanos em relação a critérios de referência. Rev Bras Educ Fís Esp 2005;19(1):13-24.
30. Blair SN, Kohl HW III, Paffenbarger RS Jr, Clark DG, Cooper KH, Gibbons LW. Phys-ical fitness and all-cause mortality: a prospective study of healthy men and women. JAMA 1989;262():2395–2401.
31. Cureton KJ, Sloniger MA, O´Bannon JP, Black DM, McCormack WP. A generalized equa-tion for predicequa-tion of VO2peak from 1-mile run/walk performance. Med Sci Sports Exerc 1995;27(3):445-51.
32. Leger, L.A., Mercier, D., Gadoury, C., & Lambert, J. (1988). The multistage 20 metre shuttle run test for aerobic fitness. J Sports Sci 1988;6(2):93-101.
33. Kline GM, Porcari JP, Hintermeister R, Freedson PS, Ward A, McCaron RF, Ross J, Rippe JM. Estimation of VO2max from one-mile track walk, gender, age, and body weight. Med Sci Sports Exerc 1987;19(3);253-259.
34. Matsuzaka A, Takahashi Y, Yamazoe M, Kumakura N, Akiko I, Wilk B, Bar-Or O. Validity of the multistage 20-m shuttle-run test for Japanese children, adolescents, and adults. Pediat Exerc Sci 2004;16(2):113-125.
35. Barnett A, Chan L, Bruce I. A preliminary study of the 20-m multistage shuttle run as a prectictor of peak VO2 in Hong Kong Chinese students. Pediat Exerc Sci 1993;5(1):42-50. 36. Ruiz JR, Ramirez-Lechuga J, Ortega F, Castro-Piñero J, Arouzo-Azofra A, Sanchez C,
Sjöström M, Castillo MJ, Gutierrez A, Zabala M. Artificial neural network-based equa-tion for estimating VO2max from the 20 m shuttle run test in adolescents. Artif Intell Med 2008;44(3):233-245.
37. Andreasi V, Michelin E, Rinaldi AEM, Burini RC. Aptidão física associada às medidas antro-pométricas de escolares do ensino fundamental. J Pediatr 2010;86(6):497-502.
Corresponding author Gabriel Gustavo Bergmann1 Universidade Federal do Pampa - Cam-pus Uruguaiana (UNIPAMPA) BR 472 - Km 592 - Caixa Postal 118 - Uruguaiana - RS - CEP: 97500-970. E-mail: gabrielgbergmann@gmail.com Fone: 55-91993926 Received 06/01/2013 Revised 08/20/2013 09/18/2013 11/13/2013 Approved 03/12/2013
38. Dumith SC, Azevedo Júnior MR, Rombaldi AJ. Aptidão física relacionada à saúde de alunos do ensino fundamental do município de Rio Grande, RS, Brasil. Rev Bras Med Esporte 2008;14(5):454-459.
39. Bergmann GG, Araújo MLB, Lorenzi T, Garlipp D, Gaya A. Alteração Anual no Crescimento e na Aptidão Física Relacionada à Saúde de Escolares. Rev Bras Cineantropom Desempenho Hum 2005;7(2):55-61.
40. Serassuelo Junior H, Rodrigues AR, Cyrino ES, Ronque EV, Oliveira SRS, Simões AC. Ap-tidão física relacionada à saúde em escolares de baixo nível socioeconômico do município de Cambé/PR. R da Educação Física/EUM 2005;16(1):5-11.
41. Ronque ERV, Cyrino ES, Dorea VR, Serassuelo Jr H, Galdi EHG, Arruda M. Diagnostico da aptidão física em escolares de alto nível socioeconômico: avaliação referenciada por critérios de saúde. Rev Bras Med Esporte 2006;13(2):71-76.
42. Dórea V, Ronque ERV, Cyrino ES, Serassuelo JH, Gobbo LA, Carvalho FO et al. Aptidão físi-ca relacionada à saúde em escolares de Jequié, BA, Brasil. Rev Bras Med Esporte 2008;14(6): 494-499.
43. Pelegrini A, Silva DAS, Petroski EL Glaner MF. Aptidão física relacionada à saúde de esco-lares brasileiros: Dados do Projeto Esporte Brasil. Rev Bras Med Esporte 2011;17(2):92-96. 44. Coleman KJ, Heath EM, Alcalá IS. Overweight and aerobic fitness in children in the United