COMPUTATIONAL TOOL TO FOSTER SYSTEMATIC THINKING AND SUSTAINABLE ENVIRONMENTAL CONSCIENCE IN THE SELECTION OF ENERGY SOURCES SYSTEMS IN
AGRIFOOD COMPANIES
R. Zocca1, T.M. Lima2,5*, P.D. Gaspar3,5 and F. Charrua-Santos4,5
1,2,3,4 Department of Electromechanical Engineering, University of Beira Interior, Covilhã,
Portugal
5 C-MAST - Centre for Mechanical and Aerospace Science and Technologies, Covilhã, Portugal [email protected]; [email protected]2; [email protected]3; [email protected]4
ABSTRACT
The agrifood sector is mainly composed by small and medium enterprises (SMEs). The large majority of these companies does not have the resources, either financial or human, to develop or use with tailored computational systems aimed to improve the organizational management of the company. There are undeniable advantages of the extended use of real-time software systems like Enterprise Resources Management (ERP) or Customer Relationship Management (CRM) devoted to practices, strategies and technologies in the integrated management and interaction between all sectors of companies. However, these SMEs have limited resources to implement and use the abovementioned solutions, which in turns may reflect on the competitiveness.
This paper describes an easy and expedite computational tool to help the decision-making concerning the selection of energy sources systems in agrifood companies. The tool provides an overview of types of energy sources used in specific agrifood sectors, as well as their major sources of pollution. Several scenarios (balance between energy costs and greenhouse gas emissions) are predicted to help decision-making on these topics. These scenarios results are compared with the average results of the specific agrifood sector. The results are also provided graphically to help an easy and expedite analysis. The use of this tool aims to foster systematic thinking and sustainable environmental conscience, promoting the energy efficiency and consequently improving the competitiveness by reducing one of today’s largest fixed costs of companies: energy consumption. Additionally, this tool also provides a prediction of the greenhouse gas emissions, to help a more sustainable and responsible commitment with the environment. The main goal of this tool is to provide the opportunity to perform individualized analysis of scenarios of energy-sources mix leading to the improvement of the performance of companies, and implementing a new thinking of continuous improvement, in order to increase competitiveness.
Keywords: Multi-Criteria Decision Making; Decision Analysis; System Simulation; Forecasting; Energy Efficiency; Greenhouse gas emissions
1 INTRODUCTION
Small and medium-sized enterprises (SME) are the backbone of the Portuguese economy, since they represent 99.9% of the total of national business and they employ 78.8% of the active population [1, 2]. Most of these industries are included in the agrifood sector. The agrifood industry is the industrial sector that contributes most to the Portuguese economy (€ 14 billion), accounting for twice the volume of the second industrial sector, the metallurgical sector. It is also the sector that invests more in Portugal and in the second industrial sector that generates more employment (about 16%) [3]. This sector is crucial to the country's growth strategy, with a direct contribution to the increase in exports. This sector has the capacity to guarantee food self-sufficiency and continues to be one of the greatest growth potential of production levels and turnover compared to its European counterparts [4]. Thus, taking into account that the agrifood sector is a strategic and millenarian sector, the development of computational tools directed to this sector is vital to increase its productivity and efficiency. Currently, the agrifood industry represents approximately 20% of the Portuguese processing industry [5]. Following Portugal's accession to the European Union, the construction of the single market in 1993 forced the agrifood industry to work towards the harmonization of rules on handling, manufacturing and presentation, including labelling, hygiene, safety and additives. The relationship between industry and production and between industry and universities has driven the development of a more competitive international industry.
The SME contribute significantly for the gross domestic product (GDP) and consequently for the country’s growth and development. However, the level of entrepreneurial culture in what concerns energy efficiency aspects in most of it is low [6]. Nevertheless, Portugal must comply with the European Energy Efficiency Directive (Directive 2012/27/EU) and for that it has to reduce energy consumption by 20% by 2020. To improve industrial energy efficiency, Article 8 of this Directive requires Member States to promote and ensure the use of high quality, cost effective energy audits and energy management systems [7]. Energy-Efficiency helps not only in enhancing competitiveness through cost reduction, but also in minimizing environmental degradation [8]. However, the difficulty of these small enterprises in modernizing themselves and applying new tools is one of the main obstacles to technological innovation. SMEs, in particular family businesses, are very resistant to change and the high initial investment that some management tools entail is discouraging for some of them [9]. Besides, barriers in introducing energy management in the SME are lack of initiation, information availability and expertise of the entrepreneurs [10, 11]. Energy management is a dynamic process where new ideas and knowledge are generated, which, in turn, produces additional energy efficiency gains [10, 11]. This process can be aided by the use of computational tools, which are already an everyday reality in large companies. Nowadays, it is unthinkable to compile data and create predictive scenarios that seek to improve a company's energy efficiency without the use of computational tools that can support the decisions of managers in large production chains. However, this is not the reality of the vast majority of small business owners. It is necessary to give business managers more information to support decision making by developing computer support tools that meet these characteristics.
This paper presents a computational tool to support decision making in the management of energy sources, to promote the improvement of the energy efficiency in Small and Medium Enterprises (SME). This study is part of the activities of project +AGRO (Organizational, energetic and occupational safety and health qualifications of the agrifood industry), Project 04/SIAC/2015 – SIAC 16159 (http://maisagro.pt/en/homepage/) developed specifically for the agrifood subsectors of meat, horticultural, dairy and bakery products [12]. The project +AGRO aimed to qualify SMEs in the agrifood sector for the adoption of innovative strategies, using Information Technologies, Communication & Electronics (ICT&E), which will enable them to increase their productivity and efficiency in the prevention of occupational safety
and health (OSH) risks, energy efficiency and optimization of production processes [12]. 60 agrifood companies distributed by several regions of Portugal (North, Center and Alentejo regions) participated in the project. The objectives of the project were:
• Characterization of the productive process of agrifood companies: (1) Description of the general productive processes and the activities carried out by workers in the agrifood companies of the subsectors under study; (2) Creation of a database with the productive processes and activities to foster the knowledge transfer and the possibility of inter-help among companies.
• Analysis of occupational safety and health (OSH) conditions in agrifood companies: (1) identify and characterize the occupational risks and hazards; (2) Measurement of environmental agents: occupational noise, illuminance, thermal environment, gases and vapors; (3) Creation of a database with risks and hazards to help the awareness of the importance of OSH; (4) Creation of a risk assessment tool, that includes the identification of successful practices and easy-to-implement solutions to prevent occupational risks; (5) Training of SMEs to implement innovative practices in the management of the OSH system.
• Energy qualification of agrifood companies: (1) Raise awareness for the reduction of large energy consumption (processes, equipment); (2) Creation of a tool to identify good energy efficiency practices and enable agrifood companies to use them; (3) Clarify entrepreneurs and employees on energy efficiency issues associated with cooling systems and heating systems; (4) To enable SMEs to implement innovative energy efficiency practices applied to the production system.
• Creation of tools for the application of technological, organizational and management systems of production systems in agrifood companies: (1) Raise awareness to the relevance of issues related to the correct planning, monitoring and management of production, of maintenance and of company resources (equipment, materials and human), hygiene and safety, times and methods, logistics among other functions; (2) Development of an innovative production management tool for the application of the technological, organizational and management systems of the productive systems; (3) Enable SMEs to implement innovative production management practices by applying the management tools developed within the project activities.
In this article, only the development of the tool to identify good energy efficiency practices will be addressed. The free software tool proposed and demonstrated along this paper provides decision support capabilities to this type of organizations, taking into account its intrinsic limitations. This tool can applied worldwide since over than 99% of the food companies in the European Union (EU-28) belong to SME that generate almost half of the industry’s food and drink turnover [13]. The fact that the computational tool use does not require an investment is intended to be a driver for the adoption of more efficient energy management practices by SMEs, expecting that the importance of its adoption is demonstrated and the gains that may result therefrom.
2 ENERGY AND ITS MANAGEMENT CONTEXT
Man has always been dependent on the resources that nature provides him. The growing demand for raw materials, coupled with economic and social changes that have taken place at ever faster rates, has led to an increase in the production system and, consequently, an increase in the consumption of raw materials. Inherent in this growth, the idea that nature would always be able to keep up with this growth and meet this ever-increasing demand for raw materials, that nature was an inexhaustible source of energy and raw material, to absorb the multiple forms of pollution that have arisen with the growth of productive activities [14]. Since the 1992 United Nations Earth Summit, the pursuit of sustainable development has been the common goal of nations around the world. The partnership relationship of the industry-environment has been declared clearly to be the goal of the
sustainable development supported by balancing growth in economic development with environmental protection [15]. In order to meet this objective, it is fundamental to develop environmental management programs and the legislation on these issues has already proliferated and is being updated in order to correct situations that were not foreseen or to adjust to new environmental targets. Nevertheless, business leaders and industry professionals must accept their responsibility towards environmental degradation and society expects a leading role from them in addressing environmental crises. The business alone possesses the resources, capabilities, power, expertise and access required to reverse global environmental problems. After-all everything cannot be left to Government regulatory bodies, international agencies, citizen advocacy groups, nongovernmental organizations (NGOs) and others [16].
It is important to define new management strategies that include more measures aimed at improving the environmental performance of production processes, because more than a strategy of differentiation and market positioning, it is a question of survival of the face of an increasingly competitive market. Increasingly, the globalized market requires the use of computational resources for data processing, whether qualitative or quantitative. The corporate market demands agility and precision in the handling of data and information. Data processing capacity and accuracy in analyzes is limited when this task is performed by the human being. Modern computers have excellent accuracy and are much faster than humans in processing large volumes of information and creating predictive scenarios [17]. With the development of graphical interfaces, visual programming gained more weight. New tools emerged that combined visual programming with modeling capabilities. In this type of system, computer models are designed visually through the connection of processing blocks. This type of tool best fits the type of user who usually needs ready-made templates that are usually integrated into the decision support tools [18]. As such, it was inevitable to develop computational tools aimed at solving the most varied problems and creating scenarios in order to find the best solution in a wide range of fields, such as: economic, administrative, engineering, industrial, environmental, among others. The first computer tools applied to environmental monitoring and management focused mainly on wastewater treatment and waste destination. Nowadays, the use of these systems tends to make more and more comprehensive the environmental management of organizations of different productive segments [19]. The contribution to the optimization of the most varied processes occurred in a very significant way. One of the resources commonly used in data processing is the Excel spreadsheet from Microsoft [17].
The great capacity of data analysis, besides a simple and well-known interface, makes an Excel spreadsheet an excellent decision support tool. Currently there is a tendency, in addition to a visual programming (interface), of the systems developed to integrate models, databases and other mechanisms of decision support and environmental management [14]. The problems that are posed to Environmental Management are, for the most part, problems with a high degree of complexity and uncertainties. Therefore, facilitating the use of computational tools for the second type of user is fundamental.
The use of mathematical models has become more frequent in the simulation of real or virtual scenarios, whose objective is to evaluate the aggravation or the improvement of the environmental performance, due to a certain decision with implications in the productive process [19]. Creating computational tools that meet the needs of managers in Portuguese industries is a great challenge. Large companies are earmarked for investments in energy management and organizational management programs, but this is not the Portuguese reality as the size of the company decreases.
Energy efficiency is fundamental to ensure the economic and social development of a country. The industrial sector is one of the most energy dependent sectors and one of the
most consuming sectors. The industry in Portugal accounts for 32.5% of total energy consumption, and only 35.7% exceeded transportation [20]. Thus, it is important to develop and apply technology to control the energy consumption and the respective emissions of gases. The energy management is characterized by addressing a wide range of good practices, including the use of support tools, which aim to facilitate and support the manager through monthly monitoring of consumption. According to the Portuguese Energy Agency (ADENE), for energy saving efforts to be successful, technological developments that can be put into practice are needed, as well as policy measures regulating energy consumption and greenhouse gas emissions and at the same time stimulate the overall economic competitiveness of Portuguese companies [21]. In order to achieve any objective in terms of energy efficiency, it is essential to develop tools to facilitate the accounting of consumption and its correlation with production. These tools should support decision-making, enabling them to become energy-saving progress measures, reducing energy consumption, which could lead to increased competitiveness between industries. However, there is a lack of support tools that fulfill the objective of helping the manager to reduce energy consumption, without compromising the company's production and adjusting to the reality and needs of the Portuguese industry [6]. There are several power management support programs that count energy consumption. However, most of them are restricted to residential installations or directed to energy intensive consumer industries. This situation does not facilitate the implementation of energy management systems in Portuguese SMEs. 3 COMPUTATIONAL TOOL
The computational tool to support energy management in the agrifood industries aims to introduce the concept and the advantages of the energy efficiency programs to the SME managers. This tool that can be downloaded in https://maisagro.pt/energ/en/energy-sources/. To facilitate the use of the tool among agrifood SME managers, and taking into account their average age, scholarship qualification, ease and knowledge of informatics and computer tools, the tool was implemented in Microsoft Excel, a spreadsheet developed by Microsoft, that can has versions for different operating systems such as Windows, macOS, Android and iOS. Besides featuring calculation, graphing tools, pivot tables, it macros can be programmed with Visual Basic. Although Excel is widely used, it requires the SME to invest in Microsoft Office. Thus, since the computational tool has unlocked macros, the code can be implemented in open source codes such as LibreOffice or programmed using other free programming languages like Python or R to widespread its use. Microsoft Excel was used because all the companies participating in the +AGRO project usually used this software. This computational tool was developed to incorporate the following sectors:
• Meat – Slaughterhouse • Meats - Hams and Sausages • Distribution
• Horticulture - import-export • Horticulture - products retail • Dairy Products
• Fish • Wine
A database was used by the computational tool. This database is one of the results of the InovEnergy project - Energy Efficiency in the Agroindustrial Sector, 01/SIAC/2011, Ref.: 18642 [22]. This database was built with the results of energy audits performed in 252 agrifood companies. The data was collected in two phases. In the first phase, each company was visited for the purpose of filling in an inquiry with a set of pre-defined questions. In the second phase, industries were visited for measuring relevant parameters for the characterization of it energy consumption. The data were processed and formatted to facilitate interpretation. The statistical analysis of data was performed using the SPSS
program. For the development of correlations, the points that do not satisfied the Chauvenet's criterion were excluded from the sample [23]. Additional details can be found in [24]. The computational tool has focused on SMEs, so it presents a wide range of sizes of industries.
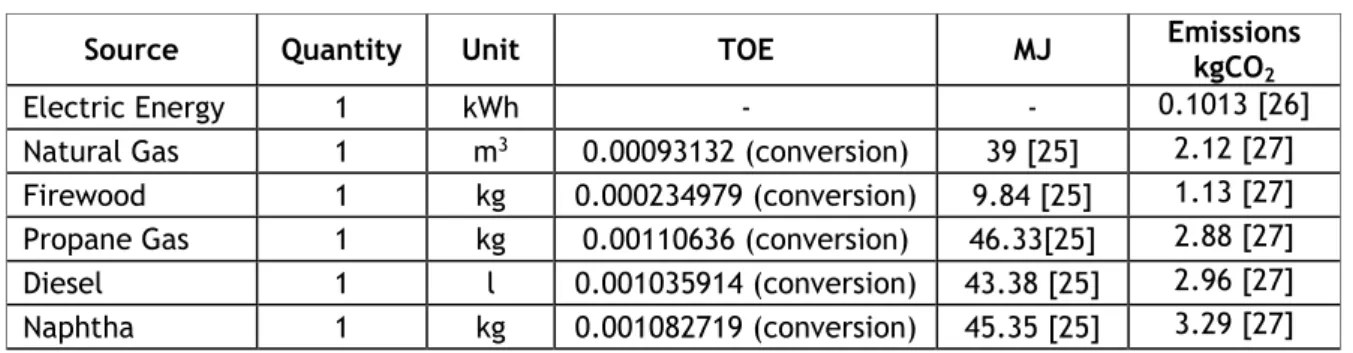
One of the main challenges in running spreadsheets is the different types of thermal energy used with different units. For example, natural gas, usually marketed in m³, propane gas in kg and diesel in liters. To compare two different power sources, it was necessary to convert them to the same unit. For this, the energy unit in MJ was used. The choice of the use of the types of energy in its commercial unit is due to the need to promote a greater capacity of the user to update the prices. The price update by the user is of extreme importance, because only then can a realistic scenario be achieved. To facilitate the interpretation of the data was created Table 1, which contains the summary of all unit conversions, as well as their bibliographic references.
Table 1: Unit Conversion used in tool calculations
Source Quantity Unit TOE MJ Emissions kgCO
2
Electric Energy 1 kWh - - 0.1013 [26]
Natural Gas 1 m3 0.00093132 (conversion) 39 [25] 2.12 [27] Firewood 1 kg 0.000234979 (conversion) 9.84 [25] 1.13 [27] Propane Gas 1 kg 0.00110636 (conversion) 46.33[25] 2.88 [27] Diesel 1 l 0.001035914 (conversion) 43.38 [25] 2.96 [27] Naphtha 1 kg 0.001082719 (conversion) 45.35 [25] 3.29 [27]
A company from this database is used to exemplify the use of the tool. Although the following discussion about the spreadsheets results is this specific for this case study, it can be transposed for all cases testes with the tool. The company A is a slaughterhouse with 12 years of activity with 13 workers. It is classified as a micro-enterprise according to Portuguese legislation. It is dedicated to the meat production. This company processes annually 1473 tons of raw materials, particularly pork and beef meat. There are nine cold rooms with a total volume of 638 m3. The facilities have a total covered area of 1117 m2.
Some cold rooms are built in sandwich panels and others in masonry insulated by polyurethane. The cold rooms have fluorescent lighting and the refrigeration tubing is insulated by neoprene. The four Bitzer (direct central-circuit) refrigeration compressors have a total rated nominal power of 43 kW. This power is distributed evenly by the four compressors. The company annual energy consumption is around 1192 MWh. A capacitors bank was installed for power factor correction to 0.97. This company also has air-conditioned corridors to avoid losses when accessing the cold rooms. Additionally, it has a heat recovery unit and a diesel and propane gas boilers. The annual consumption of propane gas is 150125 kg while the annual diesel consumption is 5002 liters.
The tool was developed in three horizontally oriented A4 sheets, where the user interacts only with the first and second sheets. The third sheet include the display of results.
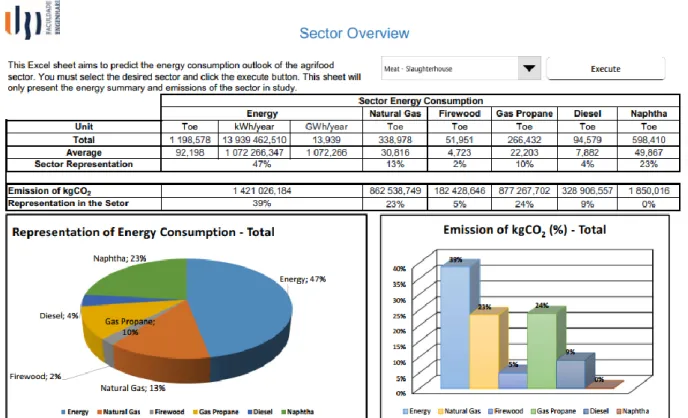
• Sector Overview: This worksheet (see Figure 1) shows an overview of the energy consumption (total consumption of electric energy and thermal energy) of the selected agrifood sector. This worksheet also shows two graphics that summarize the data, allowing the user to interpret visually, the relation of carbon dioxide emissions with the type and amount of energy used. Therefore, this is a general result for the specific agrifood sector. It allows informing the user about the energy consumption of
the sector and the energy sources distribution. It also provides the distribution of the CO2 emissions for the different energy sources used in the specific agrifood sector.
The presented data changes as the agrifood sector is selected in the dropdown box and the “Execute” button is pressed, located at the upper right side of the worksheet.
Figure 1: Sector Overview Worksheet
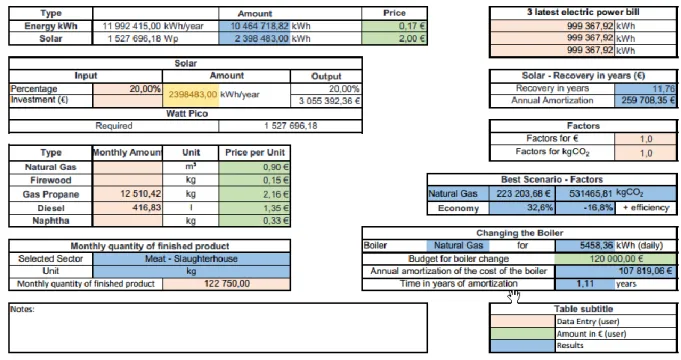
• Energy Analysis - Individual: This worksheet is the core of the tool, because it includes the prediction scenarios results. In this worksheet (see Figure 2), the user can enter the company data (blue cells) and update the unit prices of the energy sources (green cells). The data included in Figure 2 is related with the specific case study of company A described above. It must be taken into account that the tool requires the energy values per month and not per year. Thus, the annual values of the energy sources consumption presented above are assumed to be evenly distributed along the year. Thus, the monthly energy consumption value is equal to the annual value divided by 12. In this worksheet it is considered to install solar panels to generate 20% of total energy consumed. Nonetheless, it is considered an equal proportion between the energy cost and emissions.
By changing the fuel type to generate thermal energy, from propane and diesel to natural gas, the company could save approximately 33% of monthly expenses, and reduce the CO2
emissions by approximately 17%. An additional improvement scenario to reduce energy consumption and greenhouse gases emissions considered the implementation of photovoltaic solar panels. The improvement prediction was obtained by the substitution of 30% of the actual electrical energy consumption by the energy generated through the solar panels. The return on investment is predicted to be achieved in less than 12 years, which is a very small time slot for recovering the financial investment. This individual energy analysis is tailored to this case study, but similar conclusions can be stated for other simulations.
Figure 2: Energy Expenditure Analysis (Case Study)
• Graphical Reports: In this worksheet (see Figure 3), a graphical report is displayed according to the data entered in the previous worksheet. It is important to note that the charts update automatically.
The tool predicts that this company will be 93% more efficient than the SME average in the same sector, if replaces the energy sources, that is, substituting the gas propane and diesel boilers by a natural gas boiler.
With these data, the manager can assess the impact on company’s productivity by replacing energy sources as well as the company's environmental footprint. It should be noted that the tool, besides comparing energy efficiency with the industries average, also presents the costs associated with the change of energy sources, as well as the cost relative to monthly consumption. These predictive scenarios, although obtained for a specific case study, provide a simple and quick way to help the company manager with regard to energy sources and their emissions. These features are advantages of the tool.
4 CONCLUSION
The importance of SMEs in the national economy is indisputable, so the process of helping SMEs in their modernization is relevant to ensuring a more sustainable and environmentally responsible future. The Energy Management tool shows an overview of the agro-industrial sector in relation to the company that uses the tool. The industry overview is a summary of all industry information such as the main types of energy used and the major sources of pollution. In the Analysis of Individual Expenses, the company introduces the data to find a better scenario, both in the greenhouse gas emissions and in the cost associated with the acquisition of energy sources, and it can perform numerous predictive scenarios to find the one that satisfies the manager. In the graphic summaries, the company can obtain a visual forecast of its energy efficiency compared to the average of the same sector SMEs.
This tool was developed with the purpose of implementing concepts widely accepted in large industries, applying them to the reality of Portuguese SMEs that are taking the first steps towards modernization, systematic thinking and environmentally more sustainable. It aims to sensitize SME managers to environmental issues and demonstrate them that energy savings achievable through an efficient energy management program can be significant. Additionally, taking into account the number of similar processes in the same sector, most of the saving opportunities can be replicated from one production site to the others [28]. In the national market, knowing the position of a company in relation to its competitors in terms of energy efficiency reveals highly relevant and strategic information. Currently, this type of information is extremely restricted, being available to a small number of managers. Comparison with companies in the same industry allows managers to identify their positioning vis-à-vis their competitors.
Providing the opportunity for each manager to perform an individualized analysis, finding ways to improve their performance, and implementing a new thinking of continuous improvement for companies is the main goal of the tools developed, supporting and developing the national industry.
5 ACKNOWLEGMENT
This study is framed in the activities of the project "+AGRO - Organizational qualification, energy and health and safety in the work of the agrifood industry", reference ID 16159. The study was funded by Portugal 2020, Competir 2020 - Operational Program for Competitiveness and Internationalization (POCI) - System of Support to Collective Actions (SIAC: 04 / SIAC / 2015, Ref: 16159). The authors were funded in part by Fundação para a Ciência e Tecnologia (FCT), under project UID/EMS/00151/2013 C-MAST, with reference POCI-01-0145-FEDER-007718.
6 REFERENCES
[1] PORDATA. 2017. PORDATA: Base de Dados Portugal Contemporâneo. Personnel
employed in enterprises: total and by size
https://www.pordata.pt/en/Portugal/Enterprises+total+and+by+size-2857 (Accessed 7/8/2018)
[2] PORDATA. 2017. PORDATA: Base de Dados Portugal Contemporâneo. Personnel
employed in small and medium-sized enterprises.
https://www.pordata.pt/en/Portugal/Small+and+medium+sized+enterprises+total+a nd+by+size-2927 (Accessed 7/8/2018)
[3] FISA. 2018. Dados macroeconómicos da Federação das Indústrias Portuguesas Agro-Alimentares. https://www.fipa.pt/estatisticas/dados-macroeconomicos-industria-alimentar (Accessed 10/8/2018)
[4] Gaspar, P.D., Silva, P.D., Nunes, J. Andrade, L.P. 2014. Characterization of the specific electrical energy consumption of agrifood industries in the central region of Portugal. Applied Mechanics and Materials. Trans Tech Publications, pp 878-882. [5] PORDATA. 2017. PORDATA: Base de Dados Portugal Contemporâneo. Enterprises:
total and by sector of economic activity
https://www.pordata.pt/en/Portugal/Enterprises+total+and+by+sector+of+economic +activity-2856 (Accessed 7/8/2018)
[6] Catarino, J., Henriques, J., Egreja, F. 2015. Portuguese SME toward energy efficiency improvement, Energy Efficiency 8:995–1013.
[7] Fresner, J., Morea, F., Krenn, C., Uson, J.A., Tomasi, F. 2017. Energy efficiency in small and medium enterprises: Lessons learned from 280 energy audits across Europe.
Journal of Cleaner Production, 142, 1650-1660.
[8] Narasimha, C., Nagesha, N. 2012. Energy Efficiency in Sustainable Development of Small and Medium Enterprises: An Empirical Study. 7th International Conference on Intelligent Systems and Control (ISCO), Coimbatore, pp. 487-491.
[9] Martins, A.M.D. 2012. Caracterização de Ferramentas de Apoio à Gestão de Energia na Indústria. In: Caracterização de Ferramentas de Apoio à Gestão de Energia na
Indústria, Coimbra.
[10] The European observatory for SMEs. 1999. Fifth Annual Report-1997 (3rd ed.). European Network for SME Research and EMI Small Business Research and Consultancy, The Netherlands, October.
[11] Kannan, R., Boie, W. 2003. Energy management practices in SME–case study of a bakery in Germany. Energy Conversion and Management, 44, pp 945–959.
[12] +AGRO. 2018. Projeto +Agro – Qualificação organizacional, energética e de segurança e saúde no trabalho da indústria agroalimentar. http://maisagro.pt/en/homepage/ [13] FoodDrinkEurope. 2017. Data & trends of the European Food and Drink Industry
2017.
https://www.fooddrinkeurope.eu/uploads/publications_documents/DataandTrends_ Report_2017.pdf (Accessed 7/8/2018)
[14] Martins, L.F.A. 2012. Concepção de uma aplicação informática para implementação de uma ferramenta de gestão ambiental. Dissertação de Mestrado em Engenhria Química. Faculdade de Engenharia da Universidade do Porto, Porto.
[15] Tsai, D.H.A. 2018. The effects of dynamic industrial transition on sustainable development. Structural Change and Economic Dynamics, 44, pp 46–54.
[16] Seth, D., M.A.A., Rehman, Shrivastava, R.L. 2018. Green manufacturing drivers and their relationships for small and medium (SME) and large industries, Journal of
Cleaner Production, 198, pp 1381-1405.
[17] Aguiar, G.F., Aguiar, B.C.X.C., Wilhelm, V.E. 2006. Obtenção de Indíces de Eficiência para a Metodologia Data Envelopment Analysis Utilizando a Planilha Eletrônica Microsoft Excel. Revista da Vinci, Curitiba, 3.1: pp 157-169.
[18] Rizzoli, A.E.,Young, W.J. 1997. Delivering environmental decision support systems: software tools and techniques. Environmental Modelling & Software, 12.2-3: pp 237-249.
[19] Xavier, L.H., Cardoso, R., Xavier, V.A. 2006. Sistemas informatizados como ferramenta para o monitoramento e a gestão ambiental. XXVI ENEGEP - Fortaleza, CE, Brasil, 9 a 11 de Outubro de 2006.
[20] DGEG. 2017. Direção Geral de Energia e Geologia – Caracterização Energética Nacional, http://www.dgeg.pt (Accessed 3/8/2018)
[21] ADENE. 2015. Energy Efficiency trends and policies in Portugal. ADENE-Agência para a Energia. http://www.odyssee-mure.eu/publications/national-reports/energy-efficiency-portugal.pdf (Accessed 23/7/2018).
[22] Projeto InovEnergy. 2014. “Eficiência Energética no Sector Agroindustrial” Quadro de Referência Estratégico Nacional (QREN 2007-2013) – COMPETE/POFC (Programa Operacional Fatores de Competitividade), September 2014.
[23] ASHRAE. 1986. Engineering Analysis of Experimental Data. ASHRAE Guideline 2. American Society of Heating, Refrigerating and Air-Conditioning Engineers (ASHRAE). Atlanta.
[24] Nunes, J., Silva, P.D., Andrade, L.P., Gaspar, P.D. 2016. Key points on the energy sustainable development of sausages industry – The Portuguese case study.
Renewable & Sustainable Energy Reviews, 57, 393-411.
[25] Mandil, C. 2005. Energy Statistics–Manual. International Energy Agency, Paris, France, pp 1-196.
[26] EDP. 2017. EDP – Origem da Energia. https://energia.edp.pt/particulares/apoio-cliente/origem-energia/ (Acessed 30/7/2018)
[27] Meinshausen, M., Meinshausen, N., Hare, W., Raper, S.C.B., Frieler, K., Knutti, R., Frame, D.J., Allen, M.R. 2009. Greenhouse-gas emission targets for limiting global warming to 2˚C. Nature, 458.7242, pp 1158-1162.
[28] Muller, D.C.A., Marechal, F.M.A., Wolewinski, T., Roux, P.J. 2007. An energy management method for the food industry. Applied Thermal Engineering, 27, pp 2677–2686.