Living
Resources
Age and growth of the bigeye thresher shark,
Alopias superciliosus, from the pelagic longline fisheries
in the tropical northeastern Atlantic Ocean, determined
by vertebral band counts
Joana Fernandez-Carvalho
1,a, Rui Coelho
1,2, Karim Erzini
2and Miguel Neves Santos
1 1Instituto Nacional dos Recursos Biológicos IP/ IPIMAR, Av. 5 Outubro s/n, 8700-305 Olhão, Portugal2Centro de Ciências do Mar (CCMAR), Universidade do Algarve, Portugal
Received 31 January 2011; Accepted 5 September 2011
Abstract –The bigeye thresher, Alopias supercilious, is commonly caught as bycatch in pelagic longline fisheries tar-geting swordfish. Little information is yet available on the biology of this species, however. As part of an ongoing study, observers sent aboard fishing vessels have been collecting set of information that includes samples of vertebrae, with the aim of investigating age and growth of A. supercilious. A total of 117 specimens were sampled between Sep-tember 2008 and October 2009 in the tropical northeastern Atlantic, with specimens ranging from 101 to 242 cm fork length (FL) (176 to 407 cm total length). The A. supercilious vertebrae were generally difficult to read, mainly because they were poorly calcified, which is typical of Lamniformes sharks. Preliminary trials were carried out to determine the most efficient band enhancement technique for this species, in which crystal violet section staining was found to be the best methodology. Estimated ages in this sample ranged from 2 to 22 years for females and 1 to 17 years for males. A version of the von Bertalanffy growth model (VBGF) re-parameterised to estimate L0, and a modified VBGF using a fixed L0were fitted to the data. The Akaike information criterion (AIC) was used to compare these models. The VBGF produced the best results, with the following parameters: Linf= 293 cm FL, k = 0.06 y–1and L0 = 111 cm FL for females; Linf= 206 cm FL, k = 0.18 y–1and L0= 93 cm FL for males. The estimated growth coefficients confirm that A. supercilious is a slow-growing species, highlighting its vulnerability to fishing pressure. It is therefore urgent to carry out more biological research to inform fishery managers more adequately and address conservation issues.
Key words:Age and growth / Vertebrae / Pelagic longline fisheries / Bycatch / shark / Lamniformes / Alopiidae / NE Atlantic Ocean
1 Introduction
Even though elasmobranch fishes have never traditionally had a high value, they have become important fisheries resources in recent years (Barker and Schluessel2005). In fact, these species are currently exploited both by directly targeted fisheries and as bycatch of fisheries targeting other species (Shotton 1999; Stevens et al. 2000). This increase has not been mirrored by any increase in information on species biology or in management regulations, however (Stevens et al.2000). Due to their highly migratory nature, oceanic pelagic sharks pose particular difficulties for fisheries management and conservation issues. In the Atlantic Ocean, pelagic sharks are
a common bycatch species of pelagic longline fisheries (Buencuerpo et al. 1998) and some populations may have already declined by 80% over recent decades (Simpfendorfer et al.2002). In general, elasmobranch species have K-strategy life cycles, characterized by slow growth rates (e.g. Coelho and Erzini2002) and reduced reproductive potential (e.g., Coelho and Erzini 2006). These characteristics make these fishes extremely vulnerable to fishing pressure, with overexploitation occurring even at relatively low levels of fishing mortality (Smith et al.1998).
The bigeye thresher shark, Alopias superciliosus Lowe 1841, occurs in tropical and temperate seas of the world, ranging in habitat from oceanic epipelagic to coastal waters (Stillwell and Casey1976; Compagno2001; Nakano et al.2003; Weng and Block2004; Cao et al.2011).
© EDP Sciences, IFREMER, IRD 2011 DOI:10.1051/alr/2011046
www.alr-journal.org
a Corresponding author: jcarvalho@ipimar.pt
Diel behaviour has been described for this species, which generally resides shallower depths at night (<100 m) and deeper waters (between 400 to 600 m) during the day (Nakano et al.
2003; Weng and Block2004; Stevens et al.2010). It is known to be an intrauterine oophagous aplacental viviparous species, usually bearing only two embryos per litter – one per uterus (although cases of up to four embryos may occur), resulting in an extremely low fecundity (Moreno and Morón1992; Gilmore
1993; Chen et al.1997; Compagno2001). Even though this species is commonly caught as bycatch in pelagic longline fisheries (Moreno and Morón1992; Buencuerpo et al.1998; Megalofonou et al.2005), where it is usually discarded, not much is known about its biology, especially in the Atlantic Ocean. Some reproductive parameters have been reported for the Pacific and Atlantic Oceans (Gruber and Compagno1981; Moreno and Morón1992; Gilmore1993; Chen et al.1997), but the age and growth of the species has only been the focus of a very limited number of studies. Gruber and Compagno (1981) explored this issue based on a limited dataset of mostly museum specimens, but the only extensive study found on the age and growth for this species was carried out in Taiwanese waters by Liu et al. (1998). Thus, A. superciliosus is one of the pelagic shark species in most need of improved biological data, especially for the Atlantic area (IUCN2009; Cortés et al.2010). The IUCN Shark Specialist Group considered all members of the genus Alopias as “Vulnerable in global terms” (according to the IUCN Red List Criteria), due to their declining popula-tions (IUCN 2009). Chen and Yuan (2006) determined that
A. superciliosus had one of the lowest intrinsic rates of
popu-lation increase amongst the elasmobranchs. Likewise, Cortés et al. (2010) considered the species as highly vulnerable to the effects of pelagic longline fisheries, mostly due to its limited productivity, and ranked the species as having the highest risk of overexploitation in an ecological risk assessment of 11 pelagic shark species caught in Atlantic pelagic longline fisheries. Furthermore, the International Commission for the Conservation of Atlantic Tunas (ICCAT) recently recom-mended the release of live bigeye thresher sharks caught in the fisheries it manages, and that both incidental catches and live releases should be recorded in accordance with ICCAT data reporting requirements (ICCAT2008).
Age and growth studies are fundamental in fisheries research as they are the baseline for estimating important biological variables such as growth rates, natural mortality and longevity of a species; they are therefore crucial for successful fisheries management (Campana2001; Goldman2004). Age determination in fishes is typically conducted by counting periodic growth increments present in several calcified structures. While in teleost fishes most age and growth studies use otoliths or scales, elasmobranch fishes lack these structures, so vertebrae and dorsal spines are the most widely used structures for age determination (Campana 2001; Goldman
2004). However, considerable variability exists in the pattern of calcification within and among taxonomic groups of elasmobranch fishes, often making the success of each
technique species-specific, and slight differences between methodologies may make one better for obtaining accurate results in a particular species (Goldman2004).
Several techniques have been used for growth band enhance-ment in elasmobranch vertebrae. Some examples are: X-radiography (e.g., Natanson and Cailliet1990; Cailliet et al.
1983), X-ray spectrometry (Jones and Green1977), cedarwood oil immersion (Neer and Cailliet2001), alizarin red (LaMarca
1966), silver nitrate (e.g., Neer and Cailliet2001), crystal violet (e.g. Johnson 1979), graphite microtopography (Neer and Cailliet2001) and the use of copper-, lead- and iron-based salts (e.g., Gelsleichter et al.1998). In Lamniformes, several studies have used X-radiography on whole vertebrae (e.g., Cailliet and Bedford1983; Liu et al. 1998), while others were based on counting growth bands using digital images of vertebral sections (e.g. Natanson et al.2002; Ardizzone et al.2006).
Due to the urgent need for biological data and the current lack of information on this species, the main objective of the present study was to provide information on the age and growth of A. superciliosus caught in the tropical northeastern Atlantic Ocean. A secondary objective was to compare several proce-dures used for growth band enhancement in elasmobranchs, in order to determine the best technique for ageing A. superciliosus from vertebrae.
2 Materials and methods
2.1 Sampling
All A. superciliosus samples were obtained by INRB, IP/ IPIMAR observers on board Portuguese commercial longline vessels targeting swordfish in the Atlantic Ocean. Sharks are usually caught as bycatch in this fishery, with the most com-monly captured species being the blue shark (Prionace glauca). Other less common sharks captured include the shortfin mako (Isurus oxyrinchus), hammerheads (Sphyrna spp.), oceanic whitetip (Carcharhinus longimanus), silky shark
(Carcharhi-nus falciformis) and crocodile shark (Pseudocarcharias kamoharai). Vertebral samples of A. superciliosus were taken
from specimens that were retrieved dead from the longline as part of the SELECT-PAL project (PROMAR Proj. 31-03-05-FEP-1) and the EU Data Collection Framework. Vertebra col-lection started in September 2008, with a total of 117
A. superciliosus sampled over a period lasting until October
2009. Samples were collected in the tropical northeastern Atlan-tic Ocean, more specifically between latitudes 18 ºN and 5 ºN (Fig.1).
All specimens were measured on board for fork length (FL), in a straight line, and the sex was determined. A section of 4 to 8 vertebrae was extracted from the region below the anterior part of the first dorsal fin. All samples were kept frozen while on the vessels and during transportation to the laboratory.
In the laboratory, the organic tissue of the vertebrae was first removed manually with scalpels, and then by soaking the
vertebrae in 4–6% sodium hypochlorite (commercial bleach) for 10 to 20 min, depending on size. Once cleaned, the vertebrae were stored in 70% ethanol, then air-dried for 24 h before mounting in a microscope slide using thermoplastic cement. Once mounted, the vertebrae were sectioned sagittally with a Buehler low-speed saw, using two blades spaced approximately 500 µm apart. The resulting section included the focus of the vertebra and the two halves (one on each side of the focus), in a form typically called a “bow-tie”.
Contrary to carcharhinid sharks, which are characterized by having relatively hard vertebrae with solid centra, the vertebrae of lamnoid sharks are typically poorly calcified, with fewer radials and large interstitial spaces in the intermedialia, resulting in a softer and fragile centra (Goldman2004). Since this poor calcification of the A. superciliosus vertebrae was verified and confirmed in our specimens, special attention had to be taken when sectioning the vertebra so that the final section included the calcified radials of the intermedialia. Thus, when positioning the double saw against the vertebrae, it was confirmed that radials would be included between the two blades.
2.2 Band enhancement techniques
Several growth band enhancement methods used in elasmo-branchs were tested to determine which was most appropriate for the vertebrae of this species. Vertebrae from 30 randomly selected specimens were prepared following four methodolo-gies: no staining, staining with crystal violet (Johnson1979), staining with alizarin red (LaMarca 1966) and X-raying of whole vertebrae (Cailliet et al.1983).
The alizarin red staining procedure involved soaking the dried vertebral sections for 10 to 20 min, depending on the size of the vertebra. For crystal violet, the procedure was similar but the soaking time was shorter, ranging from 5 to 15 min. Once the staining was completed, the vertebral sections were main-tained between two microscope slides (wrapped in folded paper to absorb the extra dye) to apply pressure for at least 24 h in order
Fig 1. Location of the catches of A. superciliosus used for this study.
Grey circles represent females (F) and black circles males (M).
to prevent curling and bending of the corners of the vertebral sections during drying. A. superciliosus, like other Lamni-formes sharks, seems liable to this problem due to the above-mentioned low calcification of the vertebral intermedialia. Once dried, the sections were mounted onto microscope slides using Cytoseal 60. Growth bands were examined under a dissecting microscope using transmitted white light. A preliminary trial was conducted to test compare X-rays of sectioned and whole vertebrae. As the latter showed better results, whole vertebra were X-rayed using digital film with an exposure of 5 s at 40 V. To test the different band enhancement techniques, the 30 vertebra (multiplied by 4 techniques) were read three times by one reader. In order to compare the ageing precision of each technique, both the coefficient of variation (CV) (Chang1982) and the average percent error (APE) (Beamish and Fournier
1981) were calculated and compared. Bias plots were used to graphically assess the ageing accuracy of the techniques (Campana 2001), using the median value from the three readings as, excluding the crystal violet stained sections, which presented at least two identical readings for all vertebrae, several vertebrae presented different estimations for the three readings. Furthermore, a Bowker’s test for symmetry (Hoening et al.
1995) was used to test for systematic bias in the determination of age using the different techniques. In addition, the percentage of agreement (and percentage of agreement within one growth band) among the techniques was also calculated.
Once crystal violet staining had been chosen as the most appropriate band enhancement technique, all the remaining vertebrae were prepared following this protocol. Prior to the ageing assessment, a preliminary first reading (which was not used in the analysis) was made of all the vertebrae by two different readers to enable them to adjust to the banding pattern of the vertebrae of this species. All the vertebrae were then read independently three times by each of the two readers. Only those vertebrae whose band counts were the same for at least two of the three readings (for each reader) and equal between these two readers were accepted for the ageing analysis.
2.3 Age and growth estimation
The vertebral sections of all specimens were micro-photo-graphed, and the centrum radius (CR) was measured digitally using Image J software (Abramoff et al.2004) (Fig.2). A linear regression was calculated between the centrum radius and the specimen FL. The significance of the regression was tested with an ANOVA, testing H0: slope parameter of the regression (β1) = 0. The coefficient of determination (R2) of the linear regression was determined and used to assess the quality of the fit.
In order to verify the temporal periodicity of band formation in the vertebral centra, a marginal increment analysis was initially attempted. However, due to the narrowness and faintness of the bands at the margin of the vertebrae, it was impossible to objectively determine and measure the marginal growth. Thus, a centrum edge analysis was conducted by identifying whether the last band in each of the vertebrae was
opaque or hyaline (translucent). The proportion of vertebrae with either opaque or hyaline bands as the last band was calculated by month, and the proportions compared between months. Since samples were not available for all months, the available months were grouped in two categories: (a) June and July, corresponding to a summer period; and (b) October to January, corresponding to a winter period. A χ2 test of proportions was carried out to examine whether the proportions of opaque and hyaline edge bands between those two seasonal groups were significantly different.
Two growth models were used and compared to describe the growth of this species. The von Bertalanffy growth function (VBGF) re-parameterised in order to estimate L0(size at birth) instead of t0(theoretical length at age 0), as suggested by Calliet et al. (2006), and a modified VBGF using a known and fixed size at birth (L0):
The von Bertalanffy growth model (VBGF) derived to estimate the size at birth (L0) is:
.
The modified VBGF with a fixed size at birth (fixed L0) is: .
Where
Lt = mean fork length at age t;
Linf= asymptotic maximum fork length for the model of average fork length-at-age;
k = growth coefficient; L0= fork length at birth.
For the latter model, a L0value of 84 cm FL was used. This value was chosen following the size at birth estimate of 135 to 140 cm TL made for this species by Chen et al. (1997). The mean
Fig 2. Vertebral section from an A. superciliosus female of 186 cm FL,
with 9 visible growth bands. b = birth mark CR = centrum radius (white line).
Lt = Linf–(Linf –L0)e–kt
Lt = Linf(1 be– –kt)
b = (Linf–L0) L⁄ inf
value of this range was converted to FL (84 cm FL) using the equation:
FL = 0.58 TL + 4.83
(n = 390; R2= 0.92; SE intercept = 2.41; SE slope = 0.01; regression ANOVA: F = 4675; p-value < 0.01) (INRB, IP/ IPIMAR, unpublished data).
All growth models were fitted using non linear least squares (nls) in R (R Development Core Team2010). For each model, the parameters were estimated, as were the corresponding SE and the limits of the 95% confidence intervals. Furthermore, to assess model adequacy to the data, the Akaike information criterion value (AIC) was calculated for each model, and results for the models compared. A likelihood ratio test, as defined by Kimura (1980) and recommended by Cerrato (1990), was used to test the null hypotheses that there was no difference in growth parameters between males and females.
3 Results
3.1 Sample
Of the 117 A. superciliosus sampled, 73 were female (64%), 42 male (37%) and the sex of two specimens was not determined.
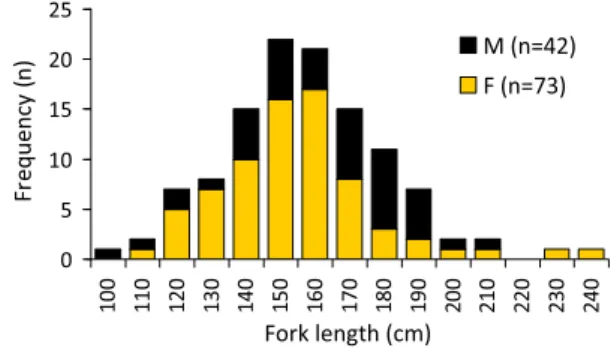
The size of the specimens used for this study ranged from 101 to 242 cm FL, with the largest specimens of each sex caught being a 210 cm FL male and a 242 cm FL female. Even though almost all size classes were represented in both sexes, 150 cm
FL was the class with the greatest occurrence (mode). Thus, in
the overall sample, the frequency of occurrence of specimens tended to be higher in the medium size classes, with very few specimens in the smallest and largest size classes (Fig.3).
3.2 Band enhancement techniques
Before calculating precision indices, it was clear that some techniques enhanced the growth bands better than others. It was difficult to differentiate growth bands and to differentiate the
0 5 10 15 20 25 10 0 11 0 12 0 13 0 14 0 15 0 16 0 17 0 18 0 19 0 20 0 21 0 22 0 23 0 24 0 Fork length (cm) Fr equency ( n) M (n=42)F (n=73)
Fig 3. Length-frequency distribution of the sample of A. superciliosus
used in this study. Size classes were grouped into 10-cm fork length classes. The two specimens for which the sex was not determined are not represented in the figure.
growth bands from the “false checks” or “split bands”, as also observed by Goldman (2004), in the unstained vertebrae compared with stained ones (both with alizarin red and crystal violet). In the X-rays, growth bands could be identified near the centrum, but the level of differentiation decreased towards the edges due to a shadow effect covering these areas. It was therefore particularly difficult to obtain valid readings with the X-ray technique, especially in the larger vertebrae.
Staining with crystal violet led to the best precision indices, with 5.7% CV and 6.6% APE, followed by the alizarin red stain, with 9.3% CV and 10.4% APE. Unstained sections and X-raying resulted in much poorer band discrimination and consequently much worse precision indexes (15.3% CV, 16.7% APE and 14.2% CV, 15.9% APE, respectively). The same pattern was observed in the percentage of accepted readings, with crystal violet being the methodology with the most vertebrae (100%) acceptable for use in the models (accepted: agreement achieved in at least two of the three readings), followed by alizarin red staining (83%), no staining (57%) and X-raying (53%).
Age-bias plots were calculated to assess the accuracy of the readings in each technique. Since crystal violet was the methodology with the highest precision index and percentage of accepted readings, the remaining techniques were plotted against it (Fig. 4). Bowker’s test for symmetry showed no systematic bias when comparing readings of the crystal violet treatment with those of alizarin red (χ2= 19.0, df = 18, p > 0.05), no staining (χ2= 19.0, df = 21, p > 0.05) and X-rays of whole vertebrae (χ2= 24.0, df = 23, p > 0.05), suggesting that the differences in the readings of each technique were caused by random error. When analyzing the percentage agreement between the techniques, it was clear that alizarin red staining showed readings most similar to the crystal violet treatment, with 30% agreement overall and 73% to within one growth band. Unstained sections had only 13% readings consistent with the crystal violet readings and 43% to within one growth band. The X-ray readings showed by far the highest discrepancy with crystal violet values, with only 7% agreement and 3% to within one growth band.
3.3 Age and growth estimation
Although vertebrae were considered hard to read compared with those of Carcharhinidae sharks, the difficulty was higher in some vertebrae than others and one specimen was discarded from the analysis.
Estimated ages of the analyzed specimens ranged from 2 to 22 years for females and from 1 to 17 years for males. A significant linear relationship was established between FL (cm) and the vertebrae centrum radius (CR, mm), suggesting that there is a direct linear relationship between specimen growth and growth of the vertebrae (Fig.5):
FL = 9.88 CR + 48.88
(R2= 0.73; regression ANOVA: F = 308.9; p < 0.01). Though the sample was not equally distributed though the year, the centrum edge analysis suggested a seasonal pattern of
band formation. A higher proportion of vertebrae with opaque last bands were observed during the winter period, from October to January (62% to 68%), compared with the summer period, of June and July (15 to 25%). The difference in the proportions between those two periods was statistically significant (χ2= 13.4, df = 1, p < 0.01).
The estimated Linf values were lower and the growth coefficients (k values) higher when using the VBGF with a fixed
Fig 4. Age-bias plots of the growth band enhancement techniques
tes-ted in this study for A. superciliosus vertebrae: Crystal violet, Alizarin red, unstained vertebrae and X-rays of whole vertebrae.
Fig 5. Relationship between fork length (cm) and vertebrae centrum
L0of 84 cm FL than when using the regular VBGF equation (Fig.6; Table1), although the estimated k was always relatively low (<0.22 y–1) regardless of the equation used. The estimated
L0obtained with the VBGF was slightly larger than the known value for the species (84 cm FL): 106 cm FL for both sexes combined, 93 cm FL for males and 111 cm FL for females. When comparing goodness of model fit between the VBGF and the VBGF with fixed L0, the VBGF produced lower values of
AIC, both for the sexes combined and for the females,
suggesting a better fit to the data than the VBGF with fixed L0. For the males, the AIC values were similar between the two growth models, with the AIC value for the VBGF with fixed L0 slightly lower than that for the VBGF. Thus, the VBGF was chosen to explain the growth for both females and males. Linf was considerably higher in females than in males, while the estimated k was lower in females (0.06 y–1) than in males (0.18 y–1), suggesting that the latter had faster growth. Significant differences were found between sexes in all the estimated VBGF growth parameters (Linflikelihood-ratio test (lrt),χ2= 7.4, df = 1, p < 0.01; k lrt,χ2= 7.3, df = 1, p < 0.01; L0lrt,χ2= 5.7, df = 1, p < 0.05; combined parameters lrt,χ2= 8.3, df = 3, p < 0.05). (a) (c) (b)
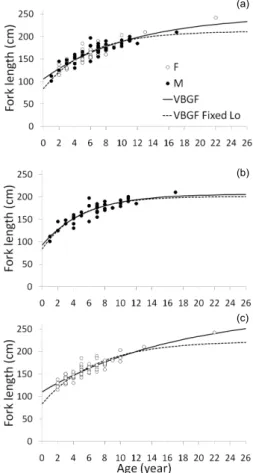
Fig 6. Estimated ages and growth models for A. superciliosus caught
in the tropical northeastern Atlantic Ocean. Data are presented (a) for sexes combined and for (b) males and (c) females separately. The growth models plotted are VBGF and VBGF with fixed L0, with L0= 84 cm FL.
4 Discussion
The vertebrae of A. superciliosus are very poorly calcified and are therefore difficult to read compared with other sharks such as the Carcharhiniformes. The only extensive study found on the age and growth of A. superciliosus (Liu et al.1998) used X-rays of whole vertebrae. Cailliet and Bedford (1983) also used X-rays for ageing of the common thresher Alopias
vulpinus. In our study, however, the X-ray technique never
produced satisfactory results, either in terms of the readings or the costs and logistics. After testing four different techniques, we recommend staining vertebra sections of approximately 500μm thickness with crystal violet as the best enhancing technique for reading growth bands and estimating ages in this species.
The fact that age precision is highly influenced by species and the nature of the structure being read, makes it difficult to establish target levels of precision indexes such as the CV and
APE. Campana (2001) suggested 7.6% as a reference level for
CV and 5.5% for APE, but mentioned that most studies reporting
shark ages based on vertebrae did so with CV values exceeding 10%. The technique chosen in this study had a CV of 5.7% and an APE of 6.6%, proving its adequacy for this species. From the 117 vertebrae initially processed, it was possible to achieve agreement in at least two out of the three readings for 116 (99% accepted readings), with only one vertebra rejected from the analysis due to very poor band discrimination. Although the pre-cision indices clearly showed differences between the four staining techniques, neither bias plots nor a test of symmetry gave an indication that the differences between the methodol-ogies were systematic rather than due to random error. One explanation might be that a worse visualization of growth bands can lead to a lower reading. on one hand, but on the other hand, with worse clarity it is harder to identify “split bands”, which can also lead to higher counts. Our results suggest that alizarin red staining produces the closest results to crystal violet staining out of the techniques tested, thus we recommend this method-ology as a second choice if crystal violet staining is not possible. Gruber and Compagno (1981) mentioned that the “maxi-mum accurately measured Alopias superciliosus” in their study was 461 cm TL (270 cm FL, estimated from our conversion equation) and that the largest male was a 378 cm TL specimen (estimated 222 cm FL) caught off of California. Liu et al. (1998) found maximum sizes of 357 cm TL (estimated 210 cm FL) for males and 422 cm TL (estimated 247 cm FL) for females off Taiwan. Finally, in the northeast Atlantic, Moreno and Morón (1992) caught a male of 410 cm TL (estimated 240 cm FL) and a female of 461 cm TL (estimated 260 cm FL). These previously published values are relatively similar to our own maximum sizes (210 cm and 242 cm FL for males and females, respec-tively), although larger sizes have been observed in the northeastern Atlantic Ocean.
In Taiwanese waters, Liu et al. (1998) estimated ages of up to 21 years for females and 20 for males, values which are similar to our estimation of up to 22 years for females and
slightly higher than our estimation of up to 17 years for males. Our observed maximum ages may not entirely represent the maximum longevity of the species, as larger sizes than our maximum sizes have been reported elsewhere. The relationship that was established between specimen size and vertebrae size suggests that, as in many other elasmobranch species, vertebrae seem to be adequate structures for estimating the age of specimens.
Due to the morphology of the vertebrae, with narrow and faint bands at the edges, it was not possible to objectively determine marginal growth increments in this study. Preliminary centrum edge analysis, with samples from six months of the year, suggests that there is a seasonal pattern in band formation. Differences between the proportions of opaque and hyaline vertebrae were statistically significant between the two groups of months, with the “October to January” group presenting a higher proportion of vertebrae with opaque last bands than the “June to July” group. Though no age validation was carried out in the present study, Liu et al. (1998) verified a one-band (composed of one opaque ring and one hyaline ring) per year periodicity in both A. supercilious and A. pelagicus (Liu et al. 1999) using marginal increment analysis and length-frequency analysis. Data on other species of Lamniformes sharks are available that also validate an annual band deposition. Natanson et al. (2002) proposed that vertebral band pairs are deposited annually by using vertebrae from recaptured
oxytetracycline-injected porbeagle sharks (Lamna nasus). The same periodicity (one band per year) was validated for the shortfin mako (Isurus oxyrinchus) both by bomb carbon chronology and oxytetracycline tagging (Ardizzone et al.2006; Natanson et al.2006). Finally, Wintner and Cliff (1999) stated that even though they could not determine band periodicity using marginal increment analysis in the white shark (Carcharodon carcharias) off the coast of South Africa, one specimen that had been tagged with oxytetracycline and recaptured also suggested annual deposition.
Growth parameters were estimated by the VBGF equation and the VBGF with fixed L0. As suggested by Cailliet et al. (2006), the re-parameterization of the VBGF equation for
estimating L0instead of t0was chosen, since L0has biological meaning and allows a judgment to be made on whether the fitted model has reasonable values. On the other hand, the incorporation of a known and fixed size at birth and derivation of an equation where only the other two parameters (Linfand
k) are estimated might be an advantage, as this value is often
known for elasmobranch fishes. When considering VBGF with a fixed L0, it should be taken into account that different authors give different values for size at birth (e.g., Bass et al.1975; Gilmore1993; Moreno and Morón 1992) and changing this value will influence the estimation of the other parameters. Chen et al. (1997) presented values for the largest near-term fully developed embryos (137 cm TL), and this value is comparable
Table 1. Growth parameters estimated for A. superciliosus (sexes combined and by sex) from the tropical northeastern Atlantic Ocean,
obtained with the von Bertalanffy growth function (VBGF) and the VBGF with fixed size at birth (L0= 84 cm FL). For each model, the parameters are given with their respective standard errors (SE) and 95% confidence intervals (CI). The Akaike information criterion value (AIC) is given for each model-gender group combination.
Sex Model Parameter Estimate SE 95% CI
Lower Upper
Sexes combined VBGF Linf 247 18.0 212 283
k 0.09 0.02 0.05 0.13 AIC = 860.4 L0 106 4.8 96 115 VBGF Fixed L0 Linf 212 5.9 200 224 AIC = 870.7 k 0.17 0.01 0.14 0.20 Males VBGF Linf 206 10.1 186 227 k 0.18 0.05 0.09 0.27 AIC = 322.6 L0 93 9.5 73 112 VBGF Fixed L0 Linf 201 6.4 188 214 AIC = 321.3 k 0.22 0.03 0.16 0.27 Females VBGF Linf 293 42.6 208 378 k 0.06 0.02 0.02 0.10 AIC = 537.2 L0 111 5.3 100 121 VBGF Fixed L0 Linf 223 9.7 204 243 AIC = 550.2 k 0.15 0.02 0.11 0.18
with the smallest free swimming sizes reported to date (130 cm
TL, Bigelow and Shroeder1948; 155 cm TL, Stillwell and Casey
1976; 159 cm TL, Gruber and Compagno1981; 156 cm TL, Moreno and Morón1992).
When comparing the two models used, the VBGF produced lower AIC values than the VBGF with fixed L0in all cases except the males, were the values were almost similar. The differences between the AIC for the sexes combined and for females can be considered high. As suggested by Katsanevakis (2006), when differences in AIC (Δi) between models are larger than 10, the alternative model has very little support and should therefore be discarded. The L0estimated with the VBGF was close to the known size at birth of the species, providing further evidence that the VBGF is probably adequate for modelling the growth of this species. For males, the AIC difference between the two models was low (Δi < 2), and the fact that the known L0value was within the 95% confidence intervals of the estimated L0, confirms that the VBGF model fits the data well. We therefore recommend the use of the VBGF for both sexes. Finally, it was also interesting to note that the differences between the two models for females were much higher than the differences between the two models for males. This is probably because the sample for males contained more small specimens than the female sample, with the single age one specimen found being a male.
The values of Linfobtained with both models were close to the maximum sizes reported in the literature, and the low values of k estimated corroborate that A. superciliosus seems to be a slow growing species. In all equations, females had lower k values than males, contrary to the results presented by Liu et al. (1998), where growth rates were faster for females (0.092 y–1) than for males (0.088 y–1). Nevertheless, the VBGF values presented in the present study (0.18 y–1 for males, 0.06 y–1for females) were relatively close to those presented by these previous authors, especially for the females. Additionally, Cailliet and Bedford (1983) found k values of 0.158 y–1for females and 0.215 y–1 for males of the common thresher (A. vulpinus) off California, and Liu et al. (1999) found k values of 0.085 y–1for females and 0.118 for males in A. pelagicus, suggesting that, as in our study, females had slower growth rates than males.
Growth parameters were statistically different between females and males. Males seemed to grow faster until age 10, after which their growth rate slowed down considerably. Females, on the other hand, showed a straighter growth curve, with a far less acute reduction in the growth rate than males. However, we must take into account that the number of small females available in the sample was lower than the number of small males.
The growth parameters estimated and presented in this study, especially the slow growth rate coefficients, seem to confirm the vulnerability of A. superciliosus to fishing pressure. Future work on this species should be focused on modelling growth in other regions of the Atlantic Ocean, as different populations may have different growth patterns and respond
differently to fishing pressure. The parameters presented can now be incorporated into stock assessment models to allow more informed fishery management decisions and conservation initiatives for this species.
Acknowledgements. Sample and data collection was conducted within the scope of the SELECT-PAL project (PROMAR Proj. 31-03-05-FEP-1), the EU Data Collection Framework and as part of Project THRESHER (FCT Proj. PTDC/MAR/109915/2009). The authors thank the crew of the FV Príncipe das Marés and FV Alma Lusa, and the technicians (S. Amorim, I. Ribeiro, M. Cerqueira and J.R. Táta) for collecting the samples. The authors are grateful to G. Burgess and Dr. A. Piercy (Florida Museum of Natural History) for their recommendations on processing the vertebrae. Thanks are also due to the many student volunteers from the Univ. Florida who helped to clean the vertebrae at the Florida Program for Shark Research laboratory. Joana Fernandez-Carvalho was supported by a grant from FCT, the Portuguese Foundation for Science and Technology (Ref: BD 60624 /2009). Rui Coelho was supported by a grant from FCT (Ref: BDP 40523/2007), co-funded by “POCI-2010, Programa Operacional Ciência e Inovação 2010” and “FSE, Fundo Social Europeu”.
References
Abramoff M.D., Magalhaes P.J., Ram S.J., 2004, Image Processing with Image J. Biophotonics International 11, 36–42.
Ardizzone D., Cailliet G.M., Natanson L.J., Andrews A.H., Kerr L.A., Brown T.A., 2006, Application of bomb radiocarbon chro-nologies to shortfin mako (Isurus oxyrinchus) age validation. Environ. Biol. Fish. 77, 355–366.
Bass A.J., D’Aubrey J.D., Kistnasamy N., 1975, Sharks of the east coast of southern Africa, IV. The families Odontaspididae, Sca-phanorhynchidae, Isuridae, Cetorhinidae, Alopiidae, Orectolobi-dae and RhiniodontiOrectolobi-dae. Oceanogr. Res. Inst. (Durban) Invest. Rep. No. 39.
Barker M.J., Schluessel V., 2005, Managing global shark fisheries: suggestions for prioritizing management strategies. Aquat. Conserv. 15, 325–347.
Bigelow H.R., Shroeder W.C., 1948, Sharks. In: Parr A.E., Olsen Y.H. (Eds.). Fishes of the western North Atlantic, Part l, New Haven, CT, Mere. Sears Found. Mar. Res. Yale Univ., pp. 59– 564.
Buencuerpo V., Rios S., Morón J., 1998, Pelagic sharks associated with the swordfish, Xiphias gladius, fishery in the eastern North Atlantic Ocean and the Strait of Gibraltar. Fish. Bull. 96, 667– 685.
Beamish R.J., Fournier D.A., 1981, A method for comparing the pre-cision of a set of age determinations. Can. J. Fish. Aquat. Sci. 38, 982–983.
Cailliet G.M., Bedford D.W., 1983, The biology of three pelagic sharks from california waters, and their emerging fisheries: a review. CalCOFI Rep. 24, 57–69.
Cailliet G.M., Martin L.K., Kusher D., Wolf P., Welden B.A., 1983, Techniques for enhancing vertebral bands in age estimation of California elasmobranchs. In: Prince E.D., Pulos L.M. (Eds.). Proc. International workshop on age determination of oceanic
pelagic fishes: tunas, billfishes, sharks. NOAA Tech. Rep. NMFS 8, pp. 157–165.
Cailliet G.M., Smith W.D., Mollet H.F., Goldman K.J., 2006, Age and growth studies of chondrichthyan fishes: the need for consis-tency in terminology, verification, validation, and growth func-tion fitting. Environ. Biol. Fish. 77, 211–228.
Campana S.E., 2001, Accuracy, precision, and quality control in age determination, including a review of the use and abuse of age validation methods. J. Fish Biol. 59,197–242.
Cao D.M, Song L.M., Zhang Yu, Lu K.K., Hu Z.X., 2011, Environ-mental preferences of Alopias superciliosus and Alopias vulpinus in waters near Marshall Islands. N. Z. J. Mar. Freshw. 45, 103– 119.
Chang W.Y.B., 1982, A statistical method for evaluating the reprodu-cibility of age determination. Can. J. Fish. Aquat. Sci. 39, 1208– 1210.
Cerrato R. M., 1990, Interpretable statistical tests for growth compa-risons using parameters in the von Bertalanffy equation. Can. J. Fish. Aquat. Sci. 47, 1416–1426.
Chen C.T., Liu K.M., Chang Y.C., 1997, Reproductive biology of the bigeye thresher shark, Alopias superciliosus (Lowe, 1839) (Chondrichthyes: Alopiidae), in the northwestern Pacific. Ich-thyol. Res. 44, 227–235.
Chen P., Yuan W., 2006, Demographic analysis based on the growth parameter of sharks. Fish. Res. 78, 374–379.
Coelho R., Erzini K., 2002, Age and growth of the undulate ray, Raja undulata, in the Algarve (Southern Portugal). J. Mar. Biol. Assoc. UK 82, 987–990.
Coelho R., Erzini K., 2006, Reproductive aspects of the undulate ray, Raja undulata, from the south coast of Portugal. Fish. Res. 81, 80–85.
Compagno L.J.V., 2001, Sharks of the world. An annotated and illus-trated catalogue of shark species known to date: bullhead, mac-kerel and carpet sharks (Heterodontiformes, Lamniformes and Orectolobiformes). Rome, FAO.
Cortés E., Arocha F., Beerkircher L., Carvalho F, Domingo A., Heu-pel M., Holtzhausen H., Santos M.N., Ribera M., Simpfendorfer C., 2010,Ecological risk assessment of pelagic sharks caught in Atlantic pelagic longline fisheries. Aquat. Living Resour. 23, 25– 34.
Gelsleichter J., Piercy A., Musick J.A., 1998, Evaluation of copper, iron, and lead substitution techniques in elasmobranch age deter-mination. J. Fish Biol. 53, 465–470.
Gilmore R.G., 1993, Reproductive biology of lamnoid sharks. Envi-ron. Biol. Fishes 38, 95–114.
Goldman K.J., 2004, Age and growth of elasmobranch fishes. In: Musick J.A., Bonfil R. (Eds.). Elasmobranch Fisheries Manage-ment Techniques, Singapore, APEC Secretariat, pp. 97–132. Gruber S.H., Compagno L.J.V., 1981, Taxonomic status and biology
of the bigeye thresher Alopias superciliosus. US Fish. Bull. 79, 617–40.
Hoening J.M., Morgan M.J., Brown C.A., 1995, Analyzing diffe-rences between two age determination methods by tests of sym-metry. Can. J. Fish. Aquat. Sci. 52, 364–368.
ICCAT, 2008, Recommendation by ICCAT on the conservation of bigeye thresher sharks (Alopias superciliosus) caught in
association with fisheries managed by ICCAT. ICCAT Recom-mendation 2008-07. Online document. http://www.iccat.es/ Documents/Recs/compendiopdf-e/2008-07-e.pdf
IUCN, 2009, IUCN red list of threatened species. Online document. www.iucnredlist.org.
Johnson A.G., 1979, A simple method for staining the centra of teleost vertebrae. NE Gulf Sci. 3, 113–115.
Jones B.C., Green G.H., 1977, Age determination of an elasmo-branch (Squalus acanthias) by x-ray spectrometry. J. Fish. Res. Board Can. 34, 44–48.
Katsanevakis S., 2006, Modelling fish growth: Model selection, multi-model inference and model selection uncertainty. Fish. Res. 81, 229–235.
Kimura D.K., 1980, Likelihood methods for the von Bertalanffy growth curve. Fish. Bull. 77, 765–773.
LaMarca M.S., 1966, A simple technique for demonstrating calcified annuli in the vertebrae of large elasmobranchs. Copeia 1966, 351–352.
Liu K.M., Chiang P.J., Chen C.T, 1998, Age and growth estimates of the bigeye thresher shark, Alopias superciliosus, in northeastern Taiwan waters. Fish. Bull. 96, 482–491.
Liu K.M., Chen C.T., Liao T.H., Joung S.J., 1999, Age, growth, and reproduction of the pelagic thresher shark, Alopias pelagicus in the Northwestern Pacific. Copeia 1999,68-74.
Megalofonou P., Yannopoulos C., Damalas D., De Metrio G., Deflo-rio M., de la Serna J.M., Macias D., 2005, Incidental catch and estimated discards of pelagic sharks from the swordfish and tuna fisheries in the Mediterranean Sea. Fish. Bull. 103, 620–634 Moreno J.A., Morón J., 1992, Reproductive biology of the bigeye
thresher shark, Alopias superciliosus (Lowe, 1839). Aust. J. Mar. Freshw. Res. 43, 77–86.
Nakano H., Matsunaga H., Okamoto H., Okazaki M., 2003, Acoustic tracking of bigeye thresher shark Alopias superciliosus in the eastern Pacific Ocean. Mar. Ecol. Prog. Ser. 265, 255–261. Natanson L.J., Cailliet G.M., 1990, Vertebral growth zone deposition
in angel sharks. Copeia 1990, 1133–1145.
Natanson L.J., Mello J.J., Campana S.E., 2002, Validated age and growth of the porbeagle shark (Lamna nasus) in the western North Atlantic Ocean. Fish. Bull. 100, 266–278.
Natanson L.J., Kohler N.E., Ardizzone D., Cailliet G.M., Wintner S.P., Mollet H.F., 2006, Validated age and growth estimates for the shortfin mako, Isurus oxyrinchus, in the North Atlantic Ocean. Environ. Biol. Fish. 77, 367–383.
Neer J.A., Cailliet G.M., 2001, Aspects of the life history of the Paci-fic electric ray, Torpedo californica (Ayers). Copeia 2001, 842– 847.
R Development Core Team, 2010, R: A language and environment for statistical computing. R Foundation for Statistical Compu-ting, Vienna, Austria. http://www.R-project.org.
Shotton R., 1999, Case studies of the management of elasmobranch fisheries. Rome, FAO.
Simpfendorfer C.A., Hueter R.E., Bergman U., Connett S.M.H., 2002, Results of a fishery-independent survey for pelagic sharks in the Western North Atlantic, 1977–1994. Fish. Res. 55, 175– 192.
Smith S.E., Au D.W., Show C., 1998, Intrinsic rebound potentials of 26 species of Pacific sharks. Mar. Freshw. Res. 49, 663–678. Stevens J.D., Bonfil R., Dulvy N.K., Walker P.A., 2000, The effects
of fishing on sharks, rays, and chimaeras (Chondrichthyans), and the implications for marine ecosystems. ICES J. Mar. Sci. 57, 476–494.
Stevens J.D., Bradford R.W., West G.J., 2010, Satellite tagging of blue sharks (Prionace glauca) and other pelagic sharks off eas-tern Australia: depth behaviour, temperature experience and movements. Mar. Biol. 157, 575–591.
Stillwell C.E., Casey J.G., 1976, Observations on the bigeye thresher shark, Alopias superciliosus, in the western north Atlantic. Fish. Bull. 74, 221–225.
Weng K.C., Block B.A., 2004, Diel vertical migration of the bigeye thresher shark (Alopias superciliosus), a species possessing orbi-tal retia mirabilia. Fish. Bull. 102, 221–229.
Wintner S.P., Cliff G., 1999, Age and growth determination of the white shark, Carcharodon carcharias, from the east coast of South Africa. Fish. Bull. 97, 153–169.