Pharmaceutical Sciences http://dx.doi.org/10.1590/s2175-97902018000217604
Article
*Correspondence: Jun-Song Wang. Center for Molecular Metabolism, School of Environmental and Biological Engineering, Nanjing University of Science and Technology, 200 Xiao Ling Wei Street, Nanjing 210094, PR China. E-mail: wang.junsong@gmail.com.
Marsdenia tenacissima
extract alters crucial metabolites in cancer,
determined by
1H NMR based metabolomics approach
Debmalya Roy
2, Cheng Chen
3, Jun-song Wang
3*, Shengtao Yuan
1*, Li Sun
2*1Jiangsu Key Laboratory of Drug Screening, China Pharmaceutical University, Nanjing, China, 2Jiangsu Center for
Pharmacodynamics Research and Evaluation, China Pharmaceutical University, Nanjing, China, 3Center for Molecular
Metabolism, School of Environmental and Biological Engineering, Nanjing University of Science and Technology, 200 Xiao Ling Wei Street, Nanjing, PR China
Altered metabolites level in the biosystems, is the potential cause of cancer, the primary reason of alteration of metabolism is change in nutrient consumption and waste excretion, as a result genetic mutation leads to cancer initiation and progression. Aberration of specific metabolites such as fumarate, succinate, 2-hydroxyglutarate may alter cell signaling. We collected liver and kidney samples and prepared for 1H
NMR analysis, then executed NMR spectroscopy. We used a set of domestic R scripts to perform an unsupervised principal component analysis (PCA) and a supervised orthogonal signal correction partial least-squares discriminant analysis (OSC-PLS-DA). It signifies class discrimination for getting a clear separation, whereas PCA scores plot signifies the model group kept further away from the control group than drug group on the horizontal axis. In another PCA scores plots, most parts of the control group was overlapping with the drug group but was distant from the model group. Marsdenia tenacissima extract (MTE) (Chines name: Xiao-Ai-Ping, XAP) modulates level of crucial metabolites such as fumarate, lactate, succinate, determined by 1H NMR spectroscopy and their altered level contributes major role
in cancer.
Keywords:Marsdenia tenacissima extract (MTE). MDA-MB-231. 1H NMR. Metabolomics.
INTRODUCTION
MTE is an anti-cancer, traditional Chinese herbal medicine. It has been widely used in various diseases and also in cancer, for many decades. But previously, no metabolomics study is carried out on MTE. In this research study, we explored the anticancer action of MTE in order to metabolomics approach, that how the level of some metabolites directly or indirectly involved with progression and suppression of cancer, modulated by MTE.
Metabolomics is a kind of newly emerging subject in recent decades which focuses on the changes of all the metabolites produced by external stimulus in the biosystem. This process is used to track the biomarkers according to the changes of the metabolic fingerprint
and illuminate the overall effect (Roy et al., 2017), now metabolomics methods have been widely employed in
recent years (Griffin, 2004; Lou et al., 2015). We unveiled in this research study, that some crucial metabolites play a major role in cancer. Mainly, the overexpression of succinate (Selak et al., 2005) and lactate (Hirschhaeuser, Sattler, Mueller-Klieser, 2011) links with cancer formation. The aim of this research was to investigate the
curative effect of MTE on MDA-MB-231 in nude mice at
the dosage of 2.5g/kg, using an NMR based metabolomics approach complemented with the histological inspection.
MATERIAL AND METHOD
Sample collection and preparation for 1H NMR analysis
livers and kidneys were harvested and frozen in the liquid nitrogen and stored at -80 ℃ immediately. Before 1H NMR analysis, frozen mice liver and kidney tissues were weighted (500 mg) and homogenized in 50% acetonitrile/H2O (3 mL) and centrifuged at 12000 rpm for 10 min at 4 °C. We collected the supernatant. And then, the supernatant was lyophilized and reconstituted in 550 μL D2O in phosphate-buffered solution (0.2 M Na2HPO4 –NaH2PO4, pH 7.4). We used TSP (0.05 wt%) as an internal standard for D2O. The supernatant was transferred into a 5 mm NMR tube for 1H NMR analysis after the solution was vortexed and centrifuged at 12000 rpm for 10 min to remove any debris. D2O was used for field frequency locking and TSP was used as a chemical shift reference (1H, 0.00 ppm).
1H NMR spectroscopy
All the 1H NMR spectra of liver and kidney samples were acquired at 298 K on a Bruker Avance 500 MHz
flow-injection spectrometer (Bruker GmbH, Karlsruhe, Germany) with a Bruker 5 mm probe, using a modified
transverse relaxationedited Call-Purcell-Meiboom-Gill
(CPMG) sequence (90(τ–180- τ) n-acquisition) with a total spin-echo delay (2nτ) of 10 ms to suppress the signals of
proteins, with 128 transients collected into 32 768 (32 K) data points, a spectral width of 10 000 Hz, an acquisition time of 3.27 s. The spectra were Fourier transformed after multiplying the FIDs by an exponential weighting function corresponding to a line-broadening of 0.5 Hz.
Data pre-processing and peak assignments
The 1H NMR spectra were phased and baseline-corrected manually using Bruker Topspin 3.0 software (Bruker GmbH, Karlsruhe, Germany). The spectra were
converted to ASCII-format files by using MestReNova
(Version 8.0.1, Mestrelab Research SL) and then imported into “R” (http://cran.r-project.org/) for multivariate data analysis using internally developed R scripts. The spectra were split into 0.015 ppm average integrated spectral regions (buckets) between 0.2 and 10 ppm. Then, the data were probability quotient-normalized to account for variation in sample dilutions. We assigned the metabolites in the NMR spectra according to the previous literature and queried performed in open access databases, such as the Madison metabolomics consortium database (http:// mmcd.nmrfam.wisc.edu/) and the human metabolome database (http://www.hmdb.ca/). We also used Chenomx NMR suite 7.7 software and the statistical total correlation spectroscopy (STOCSY) technique to assign the metabolites.
Data analysis
We used a set of domestic R scripts to perform an unsupervised PCA and a supervised OSC-PLS-DA. PCA was performed to show a general overview of the metabolic pattern through using the NMR data and then, OSC-PLS-DA was performed to show differences in metabolic alterations across the liver and kidney tissues. Each OSC-PLS-DA model was confirmed by repeated two-fold cross-validation, as follows: the validity of the
model against overfitting was assessed using the parameter
R2Y, and the predictive ability was described by Q2. Color-coded loading and S-plots were constructed to illustrate the variables that contributed to the grouping. The fold changes and the associated p-values adjusted by BH (Benjamini–Hochberg) methods of different metabolites in liver and kidney samples were calculated and listed in Table I (for liver samples) and Table II (for kidney samples).
RESULTS AND DISCUSSION
Multivariate analysis of 1H NMR spectra
We used the supervised OSC-PLS-DA to remove variations that were unrelated to class discrimination for getting a clear separation. In the PCA scores plots of the liver (Figure 1A), the model group kept further away from the control group than drug group on the horizontal axis. In another PCA scores plots (Figure 1B for kidney), most parts of the control group were overlapping with the drug group but were distant from the model group.
The loading plot (Figure 1B, C, E, F) was constructed by a covariance-based pseudo-spectrum and it was used to show color-coded according to the absolute values of the
correlation coefficients (r2). The weight of a variable in the discrimination model was determined by calculating the square of its r2 and ranged from zero (blue areas) to high values (red areas). Changes in metabolites were directly visualized as fold-changes in these plots (Figure 2). They
are color-coded according to the p-values of differences
among the groups.
In this study, we also analyzed the antitumor activity of MTE with 1H NMR-based metabolomics approach. OPLS-DA analysis of NMR data from livers and kidneys revealed that MTE induced severe metabolic perturbations (Figure 3). Both of the livers and kidneys’
model groups were found with the significant higher level
SDH inhibition is transported to the cytosol. Elevated cytosolic succinate inhibits HIF-prolyl hydroxylase
(PHD) and thereby Hypoxia-inducible factor-α (HIF-α)
hydroxylation. HIF-α makes up HIF combined with HIF-β.
In many tumors, oxygen availability becomes limited (hypoxia) very quickly during cancer development. Intermittent hypoxia may paradoxically be the only reason for increased tumor glycolysis (Zu, Guppy, 2004). The major regulator of the response to hypoxia is the HIF transcription factor, forcefully, emphasizing the importance of HIF in tumor development or sustention. In
addition, it was demonstrated that HIF activation resulting from von Hippel-Lindau (VHL) mutations promotes metastasis by inducing the expression of met and CXR4 (Selak et al., 2005). The VHL gene product (pVHL) is part of an E3 ubiquitin ligase complex that binds to the
oxygen-dependent degradation (ODD) domain of HIF-α in
an oxygen-dependent manner and targets it for degradation
(Pugh, Ratcliffe, 2003; Semenza, 2002). Consequently, pVHL binding to HIF-α is decreased, and elevated
HIF activity induces expression of genes that facilitate angiogenesis, metastasis, and metabolism, leading to
TABLE I - Identified metabolites in the livers from different groups with log2(FC) and p-values a Multiplicity:singlet (s), doublet (d), triplet (t), quartets (q), multiplets (m). b Color coded according to the log2(FC), red represents increased and blue represents
decreased concentrations in glyphosate exposed groups. Color bar c p-values corrected by BH (Benjamini
Hochberg) methods were calculated based on a parametric Student’s t-test or a nonparametric Mann–Whitney test (dependent on the conformity to normal distribution). *p < 0.05, **p < 0.01, ***p < 0.001
Metabolites Chemical shift (ppm)a C vs. M C vs. H
log2(FC)b Pc log
2(FC) P
Valine 1.05(d) -0.15 0.09
Isoleucine 1.00(t) -0.16 0.14
Leucine 0.95(t) -0.01 0.19 *
3-Hydroxybutyrate 1.21(d) -0.02 -0.52 *
Lactate 1.33(d),4.12(t) 0.02 -0.39 **
Alanine 1.49(d) 0.11 0.06
Acetate 1.93(d) 0.14 0.28 *
Glutamate 2.08(m),2.35(m) 0.19 * 0.25 ***
Succinate 2.41(s) 1.19 ** 0.45
Carnitine 2.47(m) -0.45 * -0.08
Methionine 2.66(q) 0.14 0.29 **
Creatine 3.04(s) 0.23 0.37 **
Ethanolamine 3.14(t) 0.39 0.18
Choline 3.21(s) -0.05 0.01
Taurine 3.28(t),3.42(m) -0.04 0.04
myo-Inositol 3.62(m),4.07(q) 0.22 ** 0.17 **
Betaine 3.92(s) -0.24 -0.20
Glucose 3.80(m),5.24(d) -0.18 * -0.18 **
Uracil 5.81(d),7.55(d) 0.07 -0.23 *
Inosine 6.11(d),8.36(s) 0.24 0.29 *
Fumarate 6.53(s) 0.14 -0.02
Tyrosine 6.91(d),7.20(d) -0.05 -0.10
Niacinamide 7.60(q),8.72(q),8.95(d) 0.09 -0.01
Theophylline 8.01(s) -0.11 0.02
ATP 8.51(s) 0.36 -0.08
more aggressive tumors (Selak et al., 2005). To sum up, succinate may function as an intracellular messenger between mitochondria and the cytosol and has a profound
effect on cytosolic enzymes (PHD) and consequently on
nuclear events (gene expression by HIF) (Figure 4).
Significant alteration level of metabolites with their
related expression and relevant action are summarized
in the Table III. All the above indicates that the float of
TABLE II - Identified metabolites in the kidney from different groups with log2(FC) and p-values a Multiplicity: singlet (s), doublet (d), triplet (t), quartets (q), multiplets (m). b Color coded according to the log2(FC), red represents increased and blue represents
decreased concentrations in glyphosate exposed groups. Color bar c p-values corrected by BH (Benjamini
Hochberg) methods were calculated based on a parametric Student’s t-test or a nonparametric Mann–Whitney test (dependent on the conformity to normal distribution). *p < 0.05, **p < 0.01, ***p < 0.001
Metabolites Chemical shift (ppm)a C VS. M C vs. H
log2(FC)
b Pc log
2(FC) P
Valine 1.00(d), 1.05(d) -0.33 0.21
Isoleucine 0.94(d), 1.02(d) -0.20 0.09
Leucine 0.97(t), 1.68(m) -0.28 0.10
3-Hydroxybutyrate 1.20(d) -0.29 -0.13
Lactate 1.34(d), 4.12(q) 0.00 -0.02
Alanine 1.49(d) 0.54 * 0.40
Acetate 1.93(s) 0.11 0.34
Succinate 2.41(s) 1.31 ** 0.84 *
Lysine 1.73(q), 1.90(q), 3.03(s) -0.36 0.04
Creatine 3.04(d) -0.05 -0.12
Glutamine 2.13(t), 2.46(q) 0.17 0.28
Glucose 3.25(d), 3.50(m), 3.80(m), 4.66(d), 5.24(d) -0.06 -0.02
Taurine 3.27(t) -0.20 0.01
Glutamate 2.34(m), 2.05(t) 0.99 ** 0.74 ***
Glutathione 2.18(t), 2.56(m), 2.95(m) 0.51 * 0.73 *
Glycine 2.57(s) -0.05 0.33
Lactose 4.46(s) -1.5 ** -0.22
3-Hydromuconate 5.63(m) 0.58 0.33
Histamine 3.00(t), 7.12(s), 7.96(s) 0.15 0.19
sn-Glycero-3-phosphocholine 3.23(s) 0.29 0.43
Niacinamide 7.60(q), 8.72(d), 8.94(d) -0.37 * -0.34 *
Inosine 4.44(d), 6.11(d), 8.24(s), 8.36(s) -0.82 ** -0.30 *
Maltose 3.64(m), 3.31(s) -0.90 ** -0.38
Fumarate 6.53(s) 0.48 1.05 *
Tyrosine 6.90(d), 7.19(d) -0.37 -0.29
Phenylalanine 7.38(m) -0.19 -0.12
Formate 8.46(s) -0.05 0.20
Xanthine 7.92(s) 0.39 0.16
Uridine 5.91(q), 7.88(s), 7.90(s) 1.12 ** -0.64
ATP 6.14(d), 8.27(s), 8.51(s) -0.22 -0.03
AMP 8.59(s) 0.06 0.15
3-Hydroxyphenylacetate 6.81(s) -0.23 -0.45
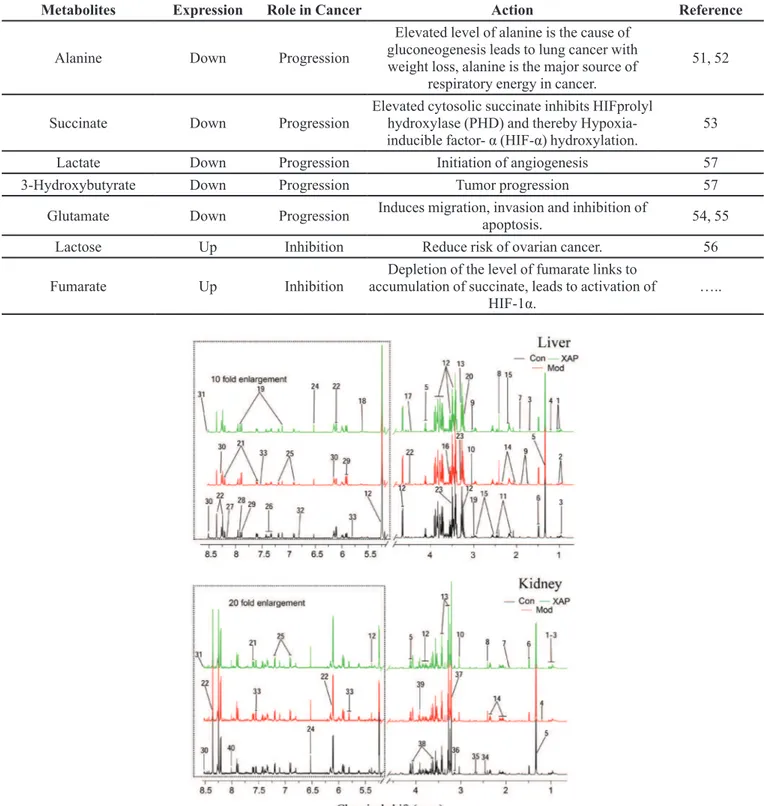
FIGURE 1 - OPLS-DA analysis of liver and kidney extract 1H NMR data of control, model, and MTE groups. Score plots (A for liver, D for kidney) and the corresponding loading plots of OPLS-DA (B and C for liver, E, and F for kidney) color-coded
with the absolute value of correlation coefficients. The color bar corresponds to the weight of the corresponding variable in the discrimination of statistically significant (red) or non-significant (blue).Positive and negative peaks indicate a relatively decreased
and increased metabolite level.
FIGURE 3 -Fold change plots color-coded with p-values adjusted by Benjamini Hochberg method indicating the significance of altered metabolites in the liver of (A), XAP vs. control (B), model vs. control (C), and lung of XAP vs. control (D), model vs. control. The blue and red dashed lines represented variations of 20% and 100%, respectively.
TABLE III -Different level of metabolites:In liver the level of the metabolites, alanine, succinate, glutamate, lactose and fumarate
were aberrated significantly. Alanine (Leij-Halfwerk et al., 2000; Tessem et al., 2008), succinate (Yang, Pollard, 2013), glutamate
(Fazzari et al., 2015; Willard, Koochekpour, 2013) are related to the cancer progression. Conversely, lactose (Goodman et al.,
2002) and fumarate play a pivotal role in the inhibition of cancer progression. However, in kidney, the level of succinate and lactate (Bonuccelli et al., 2010)were notably reduced, besides this the level of 3-Hydroxybutyrate (Bonuccelli et al.,2010) was augmented remarkably, which takes part a major role in tumor progression
Metabolites Expression Role in Cancer Action Reference
Alanine Down Progression
Elevated level of alanine is the cause of gluconeogenesis leads to lung cancer with weight loss, alanine is the major source of
respiratory energy in cancer.
51, 52
Succinate Down Progression
Elevated cytosolic succinate inhibits HIFprolyl hydroxylase (PHD) and thereby
Hypoxia-inducible factor- α (HIF-α) hydroxylation. 53
Lactate Down Progression Initiation of angiogenesis 57
3-Hydroxybutyrate Down Progression Tumor progression 57
Glutamate Down Progression Induces migration, invasion and inhibition of
apoptosis. 54, 55
Lactose Up Inhibition Reduce risk of ovarian cancer. 56
Fumarate Up Inhibition
Depletion of the level of fumarate links to accumulation of succinate, leads to activation of
succinate can reflect the growth of cancer cells in vivo.
After a consecutive 3 weeks oral MTE administration,
the level of succinate was significantly lowered and back
to normal. In another way, MTE was proved to exhibit antitumor action in vivo.
Here we used xenograft mice model for this study because all mammalian cells have similar biological
pathways to regulate growth, differentiation, replication,
and death. It has been also observed that Mice and Human have similar metabolic homogeneity and physiology disease pathogenesis. Additionally, mice acquire mutations by the equivalent spectrum of tumor suppressor genes and proto-oncogenes as Human (Balmain, Harris, 2000) (Demetrius, 2005). So, this research outcome also
will be effective on Human as well.
CONCLUSION
It has been revealed through 1H NMR-based metabolomics approach that MTE modulates the alteration of crucial metabolites, mainly succinate and lactate, which contribute major role in cancer formation.
FIGURE 4 -A schematic model that summarizes the role of succinate in the mitochondrion-to-cytosol signaling pathway. Succinate accumulated in the mitochondria due to SDH inhibition is transported to the cytosol. Elevated cytosolic
succinate inhibits PHD and thereby HIF-α hydroxylation. Consequently, pVHL binding to HIF-α is decreased, and
elevated HIF activity induces expression of genes that facilitate angiogenesis, metastasis, and metabolism, leading to more aggressive tumors (Table I).
ACKNOWLEDGEMENT
DR is the recipient of the China Govt. Scholarship-University Program (China Scholarship Council) for foreign students. The authors would like to thank Mr. Arijit Ghosh, The Hong Kong Polytechnic University (and China Pharmaceutical University Alumni), for critically reading and editing this manuscript.
REFERENCES
Balmain A, Harris CC. Carcinogenesis in mouse and human
cells: parallels and paradoxes. Carcinogenesis.
2000;21(3):371-377.
Bonuccelli G, Tsirigos A, Whitaker-Menezes D, Pavlides S, Pestell RG, Chiavarina B, et al. Ketones and lactate “fuel” tumor growth and metastasis: Evidence that epithelial cancer cells use oxidative mitochondrial metabolism. Cell Cycle.
2010;9(17):3506-3514.
Demetrius L. Of mice and men. EMBO Rep. 2005;6(Suppl
1):S39-S44.
Fazzari J, Lin H, Murphy C, Ungard R, Singh G. Inhibitors
of glutamate release from breast cancer cells; new targets for cancer-induced bone-pain. Sci Rep. 2015;5:8380.
Goodman MT, Wu AH, Tung K-H, McDuffie K, Kolonel LN,
Nomura AM, et al. Association of dairy products, lactose, and calcium with the risk of ovarian cancer. Am J Epidemiol.
2002;156(2):148-157.
Griffin JL. The potential of metabonomics in drug safety and toxicology. Drug Discov Today Technol. 2004;1(3):285-293.
Hirschhaeuser F, Sattler UGA, Mueller-Klieser W. Lactate: a
metabolic key player in cancer. Cancer Res.
2011;71(22):6921-6925.
Leij-Halfwerk S, Dagnelie PC, van den Berg JWO, Wattimena JDL, Hordijk-Luijk CH, Wilson JP. Weight loss and elevated gluconeogenesis from alanine in lung cancer patients. Am J Clin
Nutr. 2000;71(2):583-589.
Lou Y-H, Wang J-S, Dong G, Guo P-P, Wei D-D, Xie S-S, et al. The acute hepatotoxicity of tacrine explained by 1 H NMR based
metabolomic profiling. Toxicol Res. 2015;4(6):1465-1478.
D. Roy, C. Chen, J.-s. Wang, S. Yuan, L. Sun
Roy D, Sheng GY, Herve S, Carvalho E, Mahanty A, Yuan S, Sun L. Interplay between cancer cell cycle and metabolism: Challenges, targets and therapeutic opportunities. Biomed
Pharmacother. 2017;89(Suppl C):288-296.
Selak MA, Armour SM, MacKenzie ED, Boulahbel H, Watson
DG, Mansfield KD, et al. Succinate links TCA cycle dysfunction to oncogenesis by inhibiting HIF-α prolyl hydroxylase. Cancer Cell. 2005;7(1):77-85.
Semenza GL. HIF-1 and tumor progression: pathophysiology
and therapeutics. Trends Molec Med. 2002;8(4):S62-S67.
Tessem MB, Swanson MG, Keshari KR, Albers MJ, Joun D, Tabatabai ZL, et al. Evaluation of lactate and alanine as
metabolic biomarkers of prostate cancer using 1H HR‐MAS
spectroscopy of biopsy tissues. Magnetic Resonance Med.
2008;60(3):510-516.
Willard SS, Koochekpour S. Glutamate signaling in benign and malignant disorders: current status, future perspectives, and
therapeutic implications. Int J Biol Sci. 2013;9(7):728.
Yang M, Pollard PJ. Succinate: a new epigenetic hacker. Cancer
Cell. 2013;23(6):709-711.
Zu XL, Guppy M. Cancer metabolism: facts, fantasy, and fiction. Biochem Biophys Res Commun. 2004;313(3):459-465.