Principal components for the
in vivo
and carcass conformations of
Anglo-Nubian crossbred goats
Componentes principais para conformações in vivo e das carcaças em caprinos mestiços da raça Anglo-Nubiana
Marta Jeidjane Borges Ribeiro1 Luís Fernando Batista Pinto2 Ana Carla Borges Barbosa2 Gladston Rafael de Arruda Santos3
Ana Paula Gomes Pinto4 Carlos Souza do Nascimento5 Leandro Teixeira Barbosa3*
ISSNe 1678-4596
INTRODUCTION
Several lines of research in animal science require the measurement of variables of interest to provide a good characterization of animals or experimental groups. Morphometric traits such as body length, chest and rump widths, withers and rump heights, and chest circumference can help to identify which animals have adequate conformation for meat production (JUCÁ et al., 2014). These traits can be measure in vivo and do not require expensive equipment for this procedure, which makes them good options for animal
breeding strategies. However, obtaining these measurements directly at the carcass of slaughtered animals allows for a more accurate evaluation of the carcass quality (JUCÁ et al., 2016).
Regardless of the time of evaluation
- in vivo or after slaughter -, the number of
morphometric traits in such studies is usually large, which generates excessive work without necessarily improving the characterization of animals or groups. This occurs when high correlations are present among the many studied traits. In this case, a multivariate method is suggested to better understand the complex correlation existing among
1Programa de Pós-graduação em Zootecnia (PROZOOTEC), Universidade Federal de Sergipe (UFS), São Cristóvão, SE, Brasil. 2Departamento de Zootecnia, Universidade Federal da Bahia (UFBA), Salvador, BA, Brasil.
3Departamento de Zootecnia, Universidade Federal de Sergipe (UFS), Av. Marechal Rondon, s/n, Rosa Elze, 49100-000, São Cristóvão, SE,
Brasil. E-mail: leandro@ufs.br. *Corresponding author.
4Departamento de Zootecnia, Universidade Federal Rural de Pernambuco (UFRPE), Serra Talhada, PE, Brasil. 5Departamento de Zootecnia, Universidade Federal de Sergipe (UFS), Nossa Senhora da Gloria, SE, Brasil.
ABSTRACT: This study aimed to identify the principal components (PC) that explain the highest percentages of total variance and best
characterize the in vivo and carcass morphologies of Anglo-Nubian crossbred goats. Nineteen carcass morphometric traits and six in vivo
morphometric traits were measured in 28 kids at eight months of age. Principal component analysis indicated that five PC were able to explain
83.57% of the total variance in the 19 original carcass traits. Those components were termed PC1-Carcass Size, PC2 - Body Condition, PC3 -Carcass Width, PC4-Chest Depth, and PC5 - Hindquarter. For in vivo morphometric traits, the first two principal components explained 78.86% of the total variance. These components were called PC1-In vivo Size and PC2-In vivo Conformation.
Key words: carcass, correlation, multivariate analysis, variance.
RESUMO: Este estudo buscou identificar componentes principais (CP) que explicam os maiores percentuais de variância total e que melhor
caracterizam cabritos mestiços da raça Anglo Nubiana, quanto à medidas morfológicas obtidas in vivo, e na carcaça de 28 animais com 8 meses de idade. Foram conduzidas duas análises de componentes principais, sendo uma para 19 características de carcaça e outra para
seis características morfométricas in vivo. Os cinco primeiros CP explicaram 82,54% da variância total das 19 características incluídas
nessa análise. Estes componentes foram chamados de: CP1 - Tamanho da Carcaça, CP2 - Condição Corporal, CP3 - Largura da Carcaça, CP4 - Profundidade do Tórax e, CP5 - Comprimento do Pernil. Os dois primeiros componentes principais das morfometrias obtidas in vivo
explicaram 78,86% da variância total e foram chamados de CP1 - Tamanho in vivo e CP2 - Conformação in vivo.
Palavras-chave: análise multivariada, carcaça, correlação, variância.
these variables. Principal component analysis (PCA) is a multivariate method that allows for the transformation of a set of correlated original traits into a new set of uncorrelated traits with equivalent dimension, but retaining most of the variance present in the original traits in a few principal components. Therefore, the study of the principal components may reveal aspects not perceived in the separate analysis of the original traits, making it possible to differentiate animals considering a set of variables simultaneously.
In animal science, PCA has been applied in research with several species. PINTO et al. (2005), used PCA to identify redundant morphometric traits in Mangalarga Marchador horses. Similarly, BARBOSA et al. (2005), applied PCA to 33 carcass traits in a swine population
and identified 17 redundant traits. YAMAKI et al.
(2009), studied 12 chicken traits and reported seven redundant traits. LEITE et al. (2009), evaluated 11 quail carcass traits and noted that only four traits
were sufficient for characterization of animals.
PINTO et al. (2013), studied 15 performance traits in Angus cattle and had four principal components explaining 80% of total variation. However, no studies have reported PCA applied to reduce the dimensionality of variables in goats. The present research was carried out to identify the principal components that explain the highest percentages of total variance and best characterize the in vivo
and the carcass morphologies of Anglo Nubian crossbred goats.
MATERIALS AND METHODS
This study was carried out from August to December 2009 (dry season) at the Agronomic Institute of Pernambuco, located in the municipality of Sertânia, Pernambuco State, Brazil (08º04’25”S,37º15’52” W; 600m asl). The ecosystem of the region is the Caatinga biome,
and the local climate, according to the Köppen
classification, is a hot semiarid BSh type, with two distinct seasons (rainy and dry).The average temperature in the evaluation period was 25.1°C, with an accumulated precipitation of 71.05mm (SILVA et al., 2014). Twenty-eight Anglo-Nubian crossbred withers with an average initial live weight of 18.75 ± 2kg, at eight months of age,
were used. Before the start of the experiment, the animals were treated against endo and ectoparasites and vaccinated against clostridiosis and rabies. Goats were kept, in a continuous grazing system, in an experimental 37-ha area covered by a hyperxerophilic Caatinga vegetation of dense trees and shrubs, at a stocking rate of 1.15 head/ha.
The animals remained in the pasture from 7h00 to 14h00, when they were then gathered into the experimental shed and housed in individual stalls to receive feed supplementation. The initial supplement contained 0, 72, 144, and 216g dry matter of the supplement offered daily, which represented 0, 0.5, 1.0, and 1.5% of their live weight, respectively. These amounts were adjusted weekly as a function of live weight. The supplement was isoprotein (average 12% CP), containing 50% small palm (Nopalea
cochenillifera (L.) SD), 16 to 14% crushed
corn, 9.94% wheat bran, 17.22% cottonseed, 5.70% soybean meal, and 1.0% of a mineral mixture formulated according to the nutritional requirements recommended by the NRC (2007) for an average daily gain of 50g by animals receiving the highest level of feed supplementation.
The morphometric traits evaluated in vivo on the day of slaughter (after fasting for 16h) were body length, chest width, withers height, rump height, rump width, and chest circumference. Body weight at slaughter, hot carcass weight (obtained immediately after slaughter), cold carcass weight (obtained 24h after slaughter, at 4ºC), and body condition score (1 and 2) (with values ranging from 1 to 5 depending on the muscle development) were also measured.
Traits followed by number 1 are expressed relative to the hot carcass weights, and those followed by number 2 are relative to the cold carcass weights. External carcass length (1 and 2)
-distance from the cervico thoracic joint to the first
intercoccygeal joint; internal carcass length (1 and 2) -distance between the front border of the pubic bone
and the front border of the first rib at its midpoint;
shoulder; leg length (1 and 2) -distance between the greater trochanter and the border of the tarsal-metatarsal joint; chest depth (1 and 2) -distance from the sternum to the withers; and chest width (1 and 2) -distance between the anterior ends of the sternum. Lengths and circumferences were measured with a tape, and widths with a caliper. Based on these values, the leg compactness index (LCI (cm/cm) = rump width/leg length) and the carcass compactness index (CCI (kg/cm) = cold carcass weight/internal carcass length) were determined, as described by
YÁÑEZ et al. (2004).
Hot and cold carcass weights, rump width-2, and leg length-1 were excluded from the PCA because they formed singular or poorly conditioned matrices. All other variables were included in two PCA analyses-one with carcass traits and another with
in vivo morphometric traits. Minimum, maximum,
mean, and standard deviations for measurements used in the PCA can be observed in table 1.
The PCA was carried out on the correlation matrix. The analysis consists of transforming a set of
Z1, Z2, ..., Zp variables into a new set of Y1 (PC1), Y2 (PC2), ..., Yp (PCp) variables uncorrelated with each
other and arranged in descending order of variance.
The principle of this procedure is that the first
principal component contains the highest variability of the original data. The principal components were obtained using the following expressions:
│R - τI │= 0 →provides the eigenvalues τ1, τ2, ..., τp;
│R - τiI│αi = Ø →provides the eigenvectors α1, α2,... αp;
Where R = matrix of correlation among the
traits; τi= eigenvalues of matrix R; αi = eigenvector
associated with eigenvalue τi; I = identity matrix of
order p(p = number of traits); and Ø= null vector of dimension p × 1.
Table 1 - Minimum, maximum, mean, and standard deviation for the traits evaluated in Anglo-Nubian crossbred goats.
Trait* Minimum Maximum Mean Standard deviation
Body weight at slaughter 15.00 28.10 20.28 3.05
Body length 54.00 71.00 61.03 3.81
Chest circumference 59.00 71.00 63.61 2.97
Chest width 12.00 17.00 14.74 1.42
Withers height 53.00 70.00 60.46 3.83
Rump height 51.00 72.00 59.68 4.70
Rump width 9.40 14.40 11.45 1.33
Body condition score 1 2.80 4.30 3.30 0.39
Body condition score 2 2.80 3.80 3.34 0.28
External carcass length 1 47.40 56.70 51.51 2.86
External carcass length 2 47.30 56.50 51.35 2.39
Internal carcass length 1 50.30 62.70 54.78 2.92
Internal carcass length 2 51.00 63.60 55.80 3.28
Leg length 2 33.00 42.00 36.19 2.11
Chest depth 1 20.50 26.80 23.06 1.72
Chest depth 2 19.10 27.00 23.27 1.85
Chest circumference 1 49.40 61.50 48.37 3.00
Chestcircumference 2 50.00 59.60 55.53 2.44
Rump width 1 11.00 20.70 14.76 2.52
Chestwidth 1 11.00 18.90 15.38 1.68
Chestwidth 2 13.70 18.50 16.42 1.40
Rump circumference 1 39.70 53.20 46.24 3.03
Rump circumference 2 38.00 50.80 45.69 2.84
Leg compactness index 0.32 0.56 0.47 0.06
Carcass compactness index 0.12 0.20 0.14 0.02
*Traits followed by number 1 are expressed relative hot carcass weights, and those followed by number 2 are relative to the cold carcass
The αi eigenvectors were normalized to obtain αi*, such that α’
i *α
i
* = 1for i = 1, 2,..., p and α’
i *α
j
* = 0 for i ≠ j.
A minimum percentage of 80% of the explained variance and/or eigenvalues higher than one was assumed as a criterion for evaluation of components. Data were analyzed using the PRINCOMP procedure of SAS software (SAS, 2012).
RESULTS AND DISCUSSION
Carcass traits
The slaughter weight obtained in the present study (20.28kg) corroborates those reported previously for the Anglo-Nubian goat. OLIVEIRA et al. (2007) and OLIVEIRA et al. (2008) slaughtered Anglo-Nubian crossbred goats at 350 days of age and reported body weights ranging from 20 to 30kg. SILVA et al. (2014) evaluated Anglo-Nubian crossbred goats slaughtered at 350 days of age and reported body weights ranging from 18.9 to 22.1kg. Regarding morphometric traits, comparisons with
other studies are more difficult due to differences
between experiments in terms of animal size, slaughter age, as well as different anatomical points used to measure the traits. However, SOUSA et al.
(2009) reported a carcass length of 61.8 ± 2.6cm in Anglo-Nubian crossbred goats, which is close to the values reported here for internal carcass length (Table 1). Therefore, the mean values of the present study are consistent with those of studies on the Anglo-Nubian crossbreed.
Principal components analysis
The objective of principal components analysis (PCA) is to reduce the dimensionality of the variables under study (DUNTEMAN, 1984). Once this has been accomplished by explaining the high percentage of total variance in the original traits with few principal components, it can be
concluded that the analysis had a good fit and was successfully applied. The first five principal
components were able to explain 83.57% of the total variation existing in the 19 carcass traits evaluated and had eigenvalues very close to one
(Table 2). This is a very significant reduction,
which can be applied in some areas of animal science. Pinto et al. (2006) used PCA applied to carcass and performance traits in chicken and
reported that the first five components accounted
for approximately 93.3% of the total variance of 10
traits, and demonstrated that selection for the first
Table 2 - Eigenvalues and proportion of variance of carcass traits explained by each principal component evaluated in Anglo-Nubiancrossbred goats.
Principal component Eigenvalue Proportion of variance explained Accumulated proportion of variance explained
PC1 9.7231 0.5117 0.5117
PC2 2.5595 0.1347 0.6465
PC3 1.5506 0.0816 0.7281
PC4 1.1326 0.0596 0.7877
PC5 0.9125 0.0480 0.8357
PC6 0.7896 0.0416 0.8773
PC7 0.5957 0.0314 0.9086
PC8 0.4315 0.0227 0.9313
PC9 0.3224 0.0170 0.9483
PC10 0.2945 0.0155 0.9638
PC11 0.1787 0.0094 0.9732
PC12 0.1367 0.0072 0.9804
PC13 0.1297 0.0068 0.9872
PC14 0.0925 0.0049 0.9921
PC15 0.0522 0.0027 0.9948
PC16 0.0441 0.0023 0.9988
PC17 0.0306 0.0016 0.9995
PC18 0.0146 0.0008 0.9995
PC19 0.0089 0.0005 1.0000
principal component already resulted in genetic gain similar to selection for ten individual traits. However, selection for each of the ten traits would
be much more complex than for the first principal
component only.
This strong dimensional reduction had already been reported in other species, but the
present study is the first to indicate this possibility
also in goats. In newly born Mangalarga Marchador horses, PINTO et al. (2005) applied PCA for morphometric measurements and observed a reduction from 25 to seven and nine in females and males, respectively, while for angular measurements the reduction was from 11 to six and seven traits in females and males, respectively. BARBOSA et al. (2005) evaluated 33 carcass traits in swine
with PC analysis and identified 17 redundant traits. YAMAKI et al. (2009) applied PCA for days at first egg laying, egg production, body weights at
different ages, and egg weight, and of the total 12 traits studied, seven were redundant. LEITE et al. (2009) evaluated live body weight; carcass weight;
whole leg weight; breast weight; abdominal fat pad weight; weights of liver, gizzard, and heart; and carcass dry matter, fat, and crude protein contents, and of the11 quail carcass traits assessed,
only four were sufficient for explaining a large
variance percentage. PINTO et al. (2013) studied performance traits in Angus cattle and observed a decrease from 15 to four principal components.
All previous studies showed the good fit of PCA
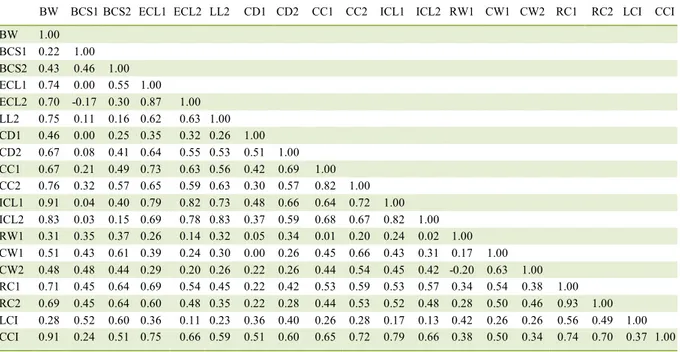
in the evaluation of the complex correlation among the many variables of interest in animal production, because many variables are moderated or highly correlated. As shown in table 3, of the171 correlations among carcass traits, only 18 were low
(0.20). Besides, some correlation coefficients were
very high, such as the 0.91 between body weight at slaughter and internal carcass length.
The first principal component (PC1) of the
carcass traits group had positive eigenvectors ranging from 0.1033 to 0.2976 (Table 4) and explained 51.17% of total variation. PC1 was termed Carcass Size, because animals with small values for this
Table 3 - Pearson correlations among carcass traits evaluated in Anglo-Nubiancrossbred goats.
BW BCS1 BCS2 ECL1 ECL2 LL2 CD1 CD2 CC1 CC2 ICL1 ICL2 RW1 CW1 CW2 RC1 RC2 LCI CCI
BW 1.00 BCS1 0.22 1.00 BCS2 0.43 0.46 1.00 ECL1 0.74 0.00 0.55 1.00 ECL2 0.70 -0.17 0.30 0.87 1.00 LL2 0.75 0.11 0.16 0.62 0.63 1.00 CD1 0.46 0.00 0.25 0.35 0.32 0.26 1.00 CD2 0.67 0.08 0.41 0.64 0.55 0.53 0.51 1.00 CC1 0.67 0.21 0.49 0.73 0.63 0.56 0.42 0.69 1.00 CC2 0.76 0.32 0.57 0.65 0.59 0.63 0.30 0.57 0.82 1.00 ICL1 0.91 0.04 0.40 0.79 0.82 0.73 0.48 0.66 0.64 0.72 1.00 ICL2 0.83 0.03 0.15 0.69 0.78 0.83 0.37 0.59 0.68 0.67 0.82 1.00 RW1 0.31 0.35 0.37 0.26 0.14 0.32 0.05 0.34 0.01 0.20 0.24 0.02 1.00 CW1 0.51 0.43 0.61 0.39 0.24 0.30 0.00 0.26 0.45 0.66 0.43 0.31 0.17 1.00 CW2 0.48 0.48 0.44 0.29 0.20 0.26 0.22 0.26 0.44 0.54 0.45 0.42 -0.20 0.63 1.00 RC1 0.71 0.45 0.64 0.69 0.54 0.45 0.22 0.42 0.53 0.59 0.53 0.57 0.34 0.54 0.38 1.00 RC2 0.69 0.45 0.64 0.60 0.48 0.35 0.22 0.28 0.44 0.53 0.52 0.48 0.28 0.50 0.46 0.93 1.00 LCI 0.28 0.52 0.60 0.36 0.11 0.23 0.36 0.40 0.26 0.28 0.17 0.13 0.42 0.26 0.26 0.56 0.49 1.00 CCI 0.91 0.24 0.51 0.75 0.66 0.59 0.51 0.60 0.65 0.72 0.79 0.66 0.38 0.50 0.34 0.74 0.70 0.37 1.00
Table 4 - Eigenvectors for each of the first five principal components in Anglo-Nubiancrossbred goats.
Trait PC1 PC2 PC3 PC4 PC5
Body weight at slaughter 0.2976 -0.0903 -0.0039 -0.0798 0.0855 Body condition score 1 0.1033 0.4831 -0.0705 0.0150 0.3332 Body condition score 2 0.2056 0.3395 0.0438 0.1163 -0.2039 External carcass length 1 0.2751 -0.1293 0.1075 -0.0786 -0.2642 External carcass length 2 0.2436 -0.2906 0.0512 -0.1591 -0.2521 Internal carcass length 1 0.2799 -0.2066 -0.0197 -0.0296 0.0575 Internal carcass length 2 0.2569 -0.2694 -0.1243 -0.0819 0.0868
Leg length 2 0.2325 -0.2038 0.0590 -0.1960 0.4043
Chest depth 1 0.1511 -0.1189 0.1763 0.6742 -0.0858
Chest depth 2 0.2311 -0.1220 0.2008 0.3009 0.2410
Chestcircumference1 0.2569 -0.0934 -0.1579 0.2080 0.0448 Chestcircumference2 0.2723 0.0086 -0.1946 -0.0083 0.2062
Rump width 1 0.1065 0.1973 0.5724 -0.2740 0.3618
Chestwidth 1 0.1936 0.2534 -0.3394 -0.1644 0.1238
Chestwidth 2 0.1732 0.1775 -0.5187 0.2094 0.0885
Rump circumference1 0.2600 0.2031 0.0673 -0.2023 -0.3102 Rump circumference2 0.2405 0.2309 0.0035 -0.1945 -0.4070 Leg compactness index 0.1512 0.3431 0.3122 0.2968 -0.0433 Carcass compactness index 0.2857 -0.0183 0.1071 -0.0342 -0.0678
PC1…PC5 -From first to fifth principal component.
component had small values for the carcass traits studied, while animals with large values for this component had large carcass trait values.
For the second principal component (PC2), body condition scores 1 and 2 and leg compactness index are the most important variables in the second principal component because of their higher eigenvector values (Table 4). Thus, PC2 was termed Body Condition, and animals with higher values for this component were those with better body condition. The PC2 explained 13.47% of total variation, indicating that body condition scores and leg compactness index are important traits for total variation among animals. Animals with positive values for both PC1 and PC2 are also those that simultaneously showed larger carcasses traits and better body condition scores. The ellipse in figure 1 indicates that most of the animals positive for both PC1 and PC2 received supplementation at the level of 1.5%. Conversely animals treated with 0.0% showed negative values for PC1 and PC2 or values near zero for these components. Thus, the
treatment used here seems to increase the carcass size and the body condition scores, especially when we compare the treatments with 0.0 and 1.5% supplementation.
According to SANTOS (2011), supplementation at 1.5% of the live weight of the animals in this experiment, reared in a semi-intensive system in the Caatinga biome during the dry season, allowed for greater body weight and body length as well as better carcass fatness and conformation.
Rump width 1 and chest width 2 had higher eigenvectors for the third principal component (PC3) (Table 4). The fact that these eigenvectors had respective positive and negative values reveals an antagonistic relationship between these variables. Thus, animals with a wider rump and a narrower chest showed the highest values for PC3. The opposite was also true: animals with lower values for PC3 were those that had the narrowest rump and the broadest chest. A negative association between these traits was also observed in the correlation analysis (Table
Figure 1 - Scatter diagram of first and second principal components (PC1 × PC2) of carcass traitsin Anglo-Nubiancrossbred goats
according to the treatments 0.0% (diamond), 0.5% (circle), 1.0% (triangle),and 1.5% (square).
strong meaning for discussion. Principal component analysis revealed that this correlation is important, because this component explained 8.16% of the total variation of the 19 carcass traits studied here. For goat meat production purposes, animals with high values for this component are desirable, as they will have a more developed carcass hindquarter. Because these two measurements represent the carcass widths in the fore- and hind-quarters, respectively, this component was called Carcass Width.
Chest depth (1) had the highest eigenvector value in the fourth principal component (PC4) (Table 4), and other traits had much lower eigenvectors. PC4 explained 5.96% of the total variation and was termed Chest Depth, as it allowed for the differentiation between animals with greater and smaller values
for this trait. Finally, the fifth principal component
(PC5) explained 4.80% of total variation and had leg length (2)and rump circumference (2) with the highest eigenvector (Table 4).The eigenvector values were positive for leg length and negative for rump circumference; therefore, these variables showed an inverse relationship; i.e., animals with long legs had a small rump circumference and vice versa. Thus, PC5 was termed Hindquarter, because the two variables are associated with hindquarter development.
In vivo morphometric traits
A PCA was applied to six in vivo
morphometric traits, and the first two principal
eigenvalues higher than one (Table 5). Therefore, for this set of variables, PCA also showed good
fit, allowing for a reduction of 1/3 the variables of interest. This good fit is also a consequence of
correlation between the variables, because of the 15 correlation estimates in table 6, only two were lower than 0.20. Besides, high correlations can be observed such as 0.72 between body length and withers height.
The first principal component explained 58.92% of total variation and is able to differentiate between small and large animals, because all eigenvectors were positive and with very similar magnitudes (0.3157 to 0.4774) (Table 7). Therefore, this component was called
in vivo size. The second principal component
explained 19.94% of total variation and was named in vivo conformation, as it showed chest and rump widths, besides rump height, as the traits with the highest eigenvectors (Table 7). In this case, the widths had positive eigenvectors, while withers height had a negative sign. Thus, animals with large values for the second
principal component showed high values for chest and rump widths, but a small value for withers height. Therefore, animals with the largest values for the second component are desirable. It is possible to observe, in figure 2, that eight animals showed a PC1value higher than 1.0. Of these, five were treated with supplementation at 1.5% and no animal from treatment 0% appears in this group. Therefore, there is again a clear separation between groups (0% and 1.5%) in this analysis and a strong indication that the supplementation level of 1.5% promotes an increase in size in vivo when compared with 0%.
According to SANTOS (2011), the
growth and development of animals are influenced
by the quality and quantity of feed supplied. As the animal grows, changes in its body measurements occur and the animal begins to develop, and growth and body development decrease gradually when it reaches maturity. In this way, the supplementation level of 1.5% resulted in changes in live weight
Table 5 - Eigenvalues andproportion of the variance of morphometric traits explained by each principal component evaluated in Anglo-Nubiancrossbred goats.
Principal component Eigenvalue Proportion of variance explained Accumulated proportion of variance explained
PC1 3.5350 0.5892 0.5892
PC2 1.1964 0.1994 0.7886
PC3 0.5594 0.0932 0.8818
PC4 0.2817 0.0469 0.9287
PC5 0.2347 0.0391 0.9679
PC6 0.1928 0.0321 1.0000
PC1…PC6 - From first to sixth principal component.
Table 6 – Pearson correlation among in vivo morphometric traits in Anglo-Nubiancrossbred goats.
Body length Chest circumference Chestwidth Withers height Rump height Rump width Body length 1.00
Chest circumference 0.71 1.00
Chestwidth 0.38 0.60 1.00
Withers height 0.72 0.67 0.30 1.00
Rump height 0.67 0.52 0.13 0.70 1.00
at slaughter and in body length, confirming the
growth of these animals during a period of low forage availability.
Results of this study demonstrate the practical application of PCA in goats to evaluate carcass and in vivo body traits. Seven principal components
were identified through this analysis: five carcass traits
and two in vivo morphometric traits. Therefore, the 25 original traits studied can be reduced to seven principal components, which can be useful in experiments in the animal science area. For example, in studies focusing on goat nutrition, instead evaluating the effect of
Table 7 - Eigenvectors of the first two principal components (PCi) of morphometrictraits in vivoevaluated in Anglo-Nubiancrossbred goats.
PC1 PC2
Body length 0.472960 ‒0.133121
Chest circumference 0.477428 0.148180
Chestwidth 0.315708 0.545819
Withers height 0.440924 ‒0.337313
Rump height 0.379145 ‒0.533397
Rump width 0.332468 0.513917
PC1 and PC2 -First and second principal component.
treatments on 25 traits, researchers could solely test the effects for the few principal components analyzed
here. This would significantly reduce the occurrence of
statistical type-I errors and make the discussion simpler and more objective. Another important aspect of the
results obtained in our study was the identification of
the original variables that most affected the principal components and thus allowed us to assign names to each component. These variables are also the most important in the differentiation of animals and should be prioritized in future studies aimed univariate statistical analysis.
DECLARATION OF CONFLICT OF INTEREST
The authors declared no potential conflicts of interest with respect to the research, authorship, and/or publication of this article.
REFERENCES
BARBOSA, L. et al. Evaluation of Swine Carcass Traits Using Principal Components. Revista Brasileira de Zootecnia, v.34, n.6, p.2209-2217, 2005. Available from: <http://www.scielo. br/scielo.php?pid=S1516-35982005000700007&script=sci_ arttext&tlng=pt>. Accessed: Apr. 15, 2018. doi: 10.1590/S1516-35982005000700007.
DUNTEMAN, G.H. Introduction to multivariate analysis. Beverly Hills: Sage, 1984. 237p.
JUCÁ, A.F. et al. Effects of birth type and family on the variation of carcass and meat traits in Santa Ines sheep. Tropical Animal Health
and Production, v. 48, p.435-443, 2016. Available from: <https://
link.springer.com/article/10.1007/s11250-015-0971-8>. Accessed: Apr. 15, 2018. doi: https://doi.org/10.1007/s11250-015-0971-8.
JUCÁ, A.F. et al. Performance of the Santa Ines breed raised on pasture in semiarid tropical regions and factors that explain trait variation. Tropical Animal Health and Production, v. 46, p.1249-1256, 2014. Available from: <https://link.springer.com/ article/10.1007/s11250-014-0635-0>. Accessed: Apr. 15, 2018. doi: https://doi.org/10.1007/s11250-014-0635-0.
LEITE, C.D.S. et al. Evaluation of production and carcass traits of meat - type quails by principal components analysis. Arquivo
Brasileiro de Medicina Veterinária e Zootecnia, v.61, n.2,
p.498-503, 2009. Available from: <http://www.scielo.br/scielo. php?pid=S0102-09352009000200030&script=sci_arttext>. Accessed: Apr. 15, 2018. doi: 10.1590/S0102-09352009000200030.
NRC - NATIONAL RESEARCH COUNCIL. Nutrients requeriments
of small ruminants. Washington, DC: NRC, 2007. 362p.
OLIVEIRA, A.N. et al. Evaluation of carcass characteristics of
crossbred Anglo-Nubian, Boer and undefined breed goats. Ciência
Rural, v.38, n.4, p.1073-1077, 2008. Available from: <http://www.
scielo.br/scielo.php?pid=S0103-84782008000400026&script=sci_ arttext&tlng=pt>. Accessed: Apr. 15, 2018. doi: 10.1590/S0103-84782008000400026.
OLIVEIRA, A.N. et al. Feedlot performance of Anglo Nubian and Boer goats crossbreed. Ciência Animal, v.17, n.2, p.69-74, 2007. Available from: <http://www.uece.br/cienciaanimal/ dmdocuments/Artigo1.2007.2.pdf>. Accessed: Apr. 15, 2018.
PINTO, L. F. B. et al. Multivariate Analysis of the Body Measures in Mangalarga Marchador Foals: Principal Components Analysis.
Revista Brasileira de Zootecnia, v.34, n.2, p.589-599, 2005.
Available from: <http://www.scielo.br/scielo.php?pid=S1516-35982005000200029&script=sci_arttext&tlng=es>. Accessed: Apr. 15, 2018. doi: 10.1590/S1516-35982005000200029.
PINTO, L. F. B. et al. Live weight, carcassultrasoundimages, and visual scores in Angus cattleunderfeeding regimes in Brazil. Tropical Animal
Health and Production, v. 45, p.1281-1287, 2013. Available from:
<https://link.springer.com/article/10.1007%2Fs11250-013-0358-7>. Accessed: Apr. 15, 2018. doi: 10.1007/s11250-013-0358-7.
PINTO, L. F. B. et al. Principal components analysis applied to performance and carcass traits in the chicken. Animal Research, v.55, n.5, p. 419-425, 2006. Available from: <https://animres. edpsciences.org/articles/animres/abs/2006/05/z205056/z205056. html>. Accessed: Apr. 15, 2018. doi: 10.1051/animres:2006022.
SANTOS, F.R. Características morfométricas e avaliação dos não componentes de carcaça de caprinos mestiços anglonubiana x SPRD criados na caatinga em sistema
semi-intensivo. 2011. 56f. Dissertação (Mestrado em
Agroecossistemas) - Núcleo de Pós-Graduação e Estudos em Recursos Naturais, Universidade Federal de Sergipe.
SAS/STAT® 12.1 User’s Guide, SAS Institute Inc, 2012.
SILVA, D.C. et al. Levels of feed supplementation on the qualitative
aspects of meat from crossbred goats finished on caatinga.
Revista Ciência Agronômica, v.46, n.4, p.855-864, 2015.
Available from: <http://www.scielo.br/scielo.php?pid=S1806-66902015000400855&script=sci_arttext>. Accessed: Apr. 15, 2018. doi: 10.5935/1806-6690.20150074.
SILVA, D.C. et al. Levels of supplementation on quantitative
carcass aspects and leg tissue composition of crossbred goats finish
on caatinga. Revista Brasileira de Saúde e Produção Animal, v.15, n.3, p.705-716, 2014. Available from: <http://www.scielo.br/ scielo.php?pid=S1519-99402014000300015&script=sci_arttext>. Accessed: Apr. 15, 2018. doi: 10.1590/S1519-99402014000300015.
SOUSA, W.H. et al. Morphometric and carcass characteristics of kid
goats and lambs finished in feedlots. Revista Brasileira de Zootecnia, v.38, n.7, p.1340-1346, 2009. Available from: <http://www.scielo. br/scielo.php?pid=S1516-35982009000700025&script=sci_ arttext&tlng=pt>. Accessed: Apr. 15, 2018. doi: 10.1590/S1516-35982009000700025.
YAMAKI, M. et al. Study of meat-type chickens production
traits by principal components analysis. Arquivo Brasileiro
de Medicina Veterinária e Zootecnia, v. 61, p.227-231, 2009.
Available from: <http://www.scielo.br/scielo.php?pid=S0102-09352009000100032&script=sci_arttext&tlng=es>. Accessed: Apr. 15, 2018. doi: 10.1590/S0102-09352009000100032.
YÁÑEZ, E.A., et al. Utilization of biometric measures for prediction