Full Terms & Conditions of access and use can be found at
http://www.tandfonline.com/action/journalInformation?journalCode=lpla20
Journal of Plant Nutrition
ISSN: 0190-4167 (Print) 1532-4087 (Online) Journal homepage: http://www.tandfonline.com/loi/lpla20
Sufficiency ranges for lemon balm and nutrient
removals in aboveground phytomass
M. Ângelo Rodrigues, Isabel Q. Ferreira, Sandra Afonso & Margarida Arrobas
To cite this article: M. Ângelo Rodrigues, Isabel Q. Ferreira, Sandra Afonso & Margarida Arrobas (2018) Sufficiency ranges for lemon balm and nutrient removals in aboveground phytomass, Journal of Plant Nutrition, 41:8, 996-1008, DOI: 10.1080/01904167.2018.1431671
To link to this article: https://doi.org/10.1080/01904167.2018.1431671
Published online: 23 Feb 2018.
Submit your article to this journal
Article views: 37
Suf
fi
ciency ranges for lemon balm and nutrient removals in
aboveground phytomass
M.Angelo Rodrigues, Isabel Q. Ferreira, Sandra Afonso, and Margarida Arrobas^
Mountain Research Centre–Polytechnic Institute of Bragan¸ca, Campus de Santa Apolonia, Bragan¸ca, Portugal
ARTICLE HISTORY Received 15 November 2016 Accepted 28 September 2017 ABSTRACT
A set of fertilizer experiments were conducted during three growing seasons with the aim of establishing sufficiency ranges and crop nutrient removals forMelissa officinalisL. Critical nutrient concentrations were determined by the Cate–Nelson
method or by removing 10% of extreme high and low values, respectively if a positive response to a given nutrient was recorded or not. Sufficiency ranges for macro, micronutrients, and SPAD-readings were set as: 27.0–40.0 g N kg
¡1; 0.8
– 2.7 g P kg¡1(May
–August); 1.5–3.8 g P kg
¡1(September
–November); 10.0–25.0 g K kg¡1(May
–August); 18.0–32.0 g K kg
¡1(September
–November); 5.0–25.0 g Ca kg¡1; 3.5
–8.5 g Mg kg ¡1; 18
–125 mg B kg ¡1; 5
–25 mg Cu kg ¡1; 75
–500 mg Fe kg¡1; 20
–300 mg Zn kg ¡1; 30
–250 g Mn kg ¡1; 30
–45 SPAD-units. These results will allow laboratories to use plant analysis as an important tool in improving the fertilizer recommendations for this species.
KEYWORDS critical concentrations;
Melissa officinalis; plant analysis; SPAD readings; threshold values
Introduction
Lemon balm is a perennial herbaceous plant of the Lamiaceae family native to Central and Southern
Europe, North Africa, and Central Asia (Babulka2005). The leaves of lemon balm have a mild lemon
scent which makes the plant useful as aflavoring in dishes, ice cream, and herbal teas. The essential oil
is also very popular in aromatherapy (Babulka2005; Sodre et al. 2012). Lemon balm has been
pre-scribed for several medicinal uses such as the treatment of disorders of the gastrointestinal tract, as an anxiolytic agent, and against viral infections (Gr€unwald and J€anicke 2009; Cunha, Nogueira, and Roque2012). Its use as an insect repellent has also been reported (Ashori, Hamzeh, and Amani2011).
The use of lemon balm in folk medicine and its multiple perceived health benefits have led to
intense research activity in thefields of phytotherapy and pharmacognosy. Several studies have been
conducted to evaluate the chemical composition of lemon balm (Pereira et al. 2014), its anxiolytic
activity (Vafaei et al.2005; Taiwo et al.2012), and nutraceutical and antioxidant properties (Dias et al.
2012; Luno et al.~ 2015) as well as its potential as an antimicrobial (Stanojevic et al.2010; Rabbani et al.
2016), a neuroprotective (Lopez et al.2009; Kamdem et al.2013), or a carcinopreventive (Sousa et al.
2004; Weidner et al.2015) agent.
The relevant literature on this species in the biochemical and pharmaceutical fields contrasts
with the limited available data on the agronomy of the crop. Some papers can be found on several aspects of cropping technique, but they are usually studies of short duration and the majority are published in national journals, rarely in English, containing limited data and not easily accessible
to the international scientific community. There can be found agronomic studies on lemon balm
focused on cover cropping strategies (Biasi et al. 2009), harvesting regimes (Blank et al. 2005;
Leon-Fernandez et al.2008; May et al. 2008), and water requirements (Ghamarnia, Mousabeygi,
CONTACT M.^Angelo Rodrigues [email protected] Mountain Research Centre–Polytechnic Institute of Bragan¸ca, Campus de
Santa Apolonia, 5300-253 Bragan¸ca, Portugal. © 2018 Taylor & Francis Group, LLC
–
and Arji 2015). However, crop fertilization has probably been the agronomic aspect that has
received the greatest attention. Studies can be found on lime application (Blank et al. 2006),
organic amendment (Santos et al.2009; Sodre et al.2013), and mineral fertilization by combining
diverse rates of the major nutrients (Blank et al.2006; May et al.2008; Sodre et al.2013; Sharafza-deh, Khosh-Khui, and Javidnia2011; Nemeth-Zamborine et al.2015). These studies usually seek to assess the effect of manures and fertilizers on biomass yield and/or essential oil production, but there are other important aspects such as nutrient concentration in plant tissues. Unlike for most
other crops, critical sufficiency ranges or threshold values, which are essential for establishing a
proper fertilization program, are not available for this species. It should be noted that Bryson et al.
(2014) compiled sufficiency ranges for more than 2,000 cultivated species, from herbaceous crops,
fruit growing, forestry and ornamentals, but they did not include lemon balm. As far as we know, such data is currently not available for a crop with such economic potential and broad distribution as the lemon balm. In practice, if a farmer wanted to monitor the nutritional status of this crop, or to establish a fertilization program based on plant analysis, it would not be possible due to the lack of leaf nutrient concentration standards for the interpretation of results.
This work was carried out with the aim of fulfilling four main objectives: i) to assess the effect of four individual important nutrients [nitrogen (N), phosphorus (P), potassium (K), or boron (B)] on crop dry matter yield in a varied range of conditions; ii) to establish threshold leaf nutrient concentra-tions and sufficiency ranges for N, P, K, calcium (Ca), magnesium (Mg), B, copper (Cu), iron (Fe), zinc (Zn), and manganese (Mn); iii) to set a sufficiency range for SPAD-readings, a N nutritional index that can be obtained with a portable device without the need for sending plant samples to the lab; and iv) to estimate crop nutrient removals in the harvested biomass, an important parameter in fertilizer recom-mendations since it may indicate the needs of the crop.
Materials and methods
Study site
The experiments were carried out in Bragan¸ca (41
480
N, 6440
W), NE Portugal. The region of
Braganca bene¸ fits from a Mediterranean type climate, somewhat influenced by the Atlantic regime.
The mean annual air temperature and annual precipitation in the period 1971–2000 were, respectively,
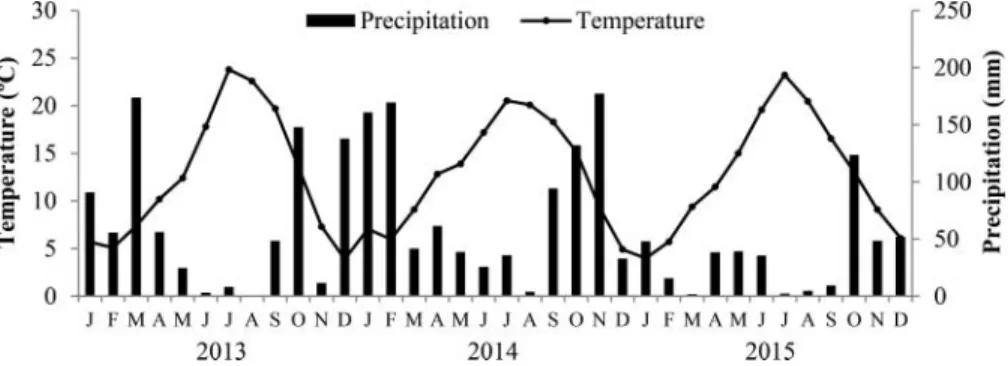
12.3C and 758 mm. Mean monthly temperatures and precipitation recorded during the experimental
period are presented inFigure 1.
The experimental apparatus included fourfield trials that took place in 2013 and 2014 and eight pot experiments carried out in 2013 (1), 2014 (3), and 2015 (4). Thefield trials were carried out in a
Lepto-sol (WRBSR2014) originating from a bed-rock of schist. The cultivated plot was prepared in terraces
to reduce the slope and to facilitate cultivation. The properties of a soil sample from thisfield and also from the soils used in the pot experiments are presented inTable 1.
Experimental designs and crop management
Thefield trials were carried out over two years, during the growing seasons of 2013 and 2014, in a com-mercialfield organically managed. They consisted in N (FieldN), P (FieldP), K (FieldK), and B (FieldB) fertilizer trials. The experiments were arranged as completely randomized designs with four N (0, 50, 100, and 150 kg ha¡1yr¡1), three P [0, 50, and 100 kg (P2O5) ha
¡1
yr¡1], three K [0, 50, and 100 kg (K2O) ha
¡1 yr¡1] and three B (0, 1, and 2 kg ha¡1yr¡1) rates and three replications. The plots of a
given nutrient received also a basal fertilization plan with the nutrients not included in the experimen-tal design. The basal fertilization plan consisted of the application of 100 kg N, P (P2O5) and K (K2O)
ha¡1
yr¡1
, and 2 kg B ha¡1
yr¡1
. Each individual plot consisted of six rows 2.8 m long. The ground
was covered with a plastic anti-weed mat punched with holes spaced at 40£40 cm which defines the
planting density. Thefield was drip-irrigated from May to September. The nutrients were supplied as a nutrient solution prepared from fertilizers authorized for organic farming. To supply the nutrients
required in the experimental design the commercial fertilizers fosfigen (0:30:20), organihum P (8%
P2O5, 2% N), organihum K (30% K2O, 2% N), organihum nitro (8% total N), and neobor (15% B)
were applied. The concentrations of the nutrient solutions were established by taking into account the plant spacing, the rate of nutrients to apply per hectare, and the volume of nutrient solution applied to each plant (50 mL). To reduce the salt effect and to increase nutrient use efficiency, the total amount of nutrients was split in four applications thereabout monthly spaced. After being prepared the nutrient solution was poured into the holes of the mat surrounding the plants.
In 2013 a pot experiment was carried out. It consisted of an N fertilization experiment (PotN2013) arranged as a completely randomized design with four N rates (0, 0.45, 0.90, 1.35 kg N pot¡1) and six
replications (six pots). All the pots also received 0.90 g (P2O5) and (K2O) pot
¡1and a mixture of macro
and micronutrients in a commercial formulation marketed as oligomag (10% MgO, 0.3% B, 18.5% SO3,
0.3% Cu, 2% Fe, 1% Mn, 0.02% Mo, 1.6% Zn) applied at a rate of 0.08 g plot¡1. The fertilizers used
were the same as those in thefield experiment. The pots werefilled with 4 kg of dry and sieved (mesh of 2 mm) soil mixed with 15 g perlite kg¡1
dry soil. The fertilizers were added as a nutrient solution split into four applications during the growing season. The pots were placed in holes in the ground lined with PVC pipe to protect the walls of the pots from direct sunlight and to avoid overheating of
the rhizosphere. Cuttings of 8–12 cm height were transplanted on 21 March. During the growing
sea-son the pots were watered as necessary to allow normal plant growth.
In 2014, three pot experiments were carried out one for each of the nutrients N (PotN2014), P (PotP2014), and K (PotK2014). They consisted of completely randomized designs with four N (0, 0.8, 1.6, and 2.5 g pot¡1), three P [0, 0.8, and 1.6 kg (P2O5) ha
¡1
], and three K [0, 0.8 and 1.6 kg (K2O)
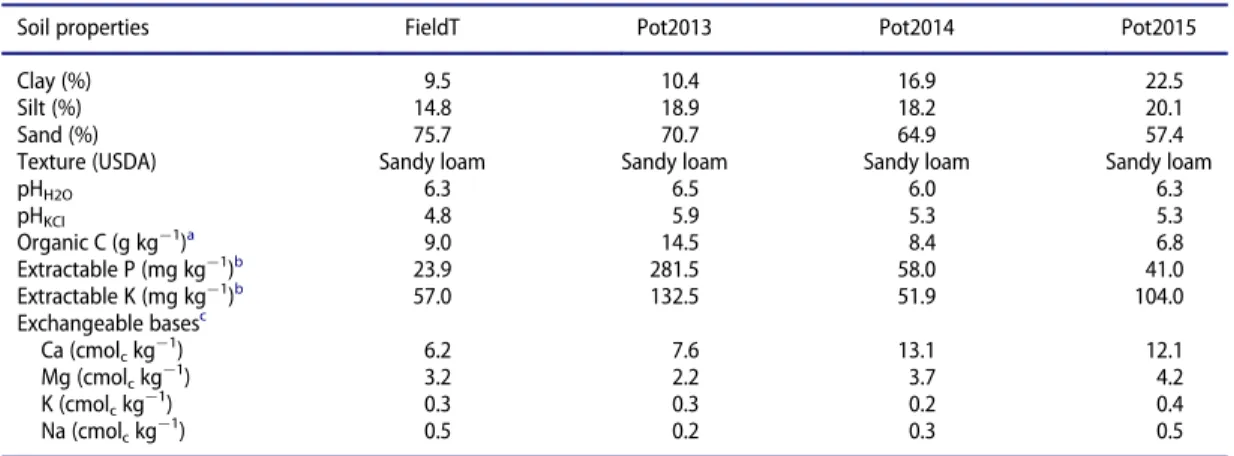
Table 1.Selected properties of the soils (0–20 cm) of thefield trials (FieldT) and those used in the pot experiments of 2013 (Pot2013),
2014 (Pot2014), and 2015 (Pot2015).
Soil properties FieldT Pot2013 Pot2014 Pot2015
Clay (%) 9.5 10.4 16.9 22.5
Silt (%) 14.8 18.9 18.2 20.1
Sand (%) 75.7 70.7 64.9 57.4
Texture (USDA) Sandy loam Sandy loam Sandy loam Sandy loam
pHH2O 6.3 6.5 6.0 6.3
pHKCl 4.8 5.9 5.3 5.3
Organic C (g kg¡1)a 9.0 14.5 8.4 6.8
Extractable P (mg kg¡1)b 23.9 281.5 58.0 41.0
Extractable K (mg kg¡1)b 57.0 132.5 51.9 104.0
Exchangeable basesc
Ca (cmolckg
¡1) 6.2 7.6 13.1 12.1
Mg (cmolckg
¡1) 3.2 2.2 3.7 4.2
K (cmolckg
¡1
) 0.3 0.3 0.2 0.4
Na (cmolckg
¡1) 0.5 0.2 0.3 0.5
a
Walkley–Black (Motsara and Roy2008);
b
Egner–Riehm (Egner, Riehm, and Domingo1960);
c
pot¡1
] rates, and ten replications. The experiment of a given nutrient (N, P, or K) received the other two as a basal fertilization plan, consisting of 1.6 g pot¡1
of N, P (P2O5), and K (K2O). The N, P, and K
pots also received 0.08 g of oligomag. The nutrients were supplied as a nutrient solution prepared with the fertilizers used in thefield trials and PotN2013. The experiment was started on 8 May from cuttings of 8–12 cm height. All other aspects of the fertilization plan and crop management were similar to that reported for PotN2013.
In 2015, four pot experiments were carried out, one for each of the nutrients N (PotN2015), P (PotP2015), K (PotK2015), and B (PotB2015). They were arranged as completely randomized designs with four rates of N, P (P2O5), and K (K2O) (0, 1.6, 3.2, and 6.4 kg pot
¡1), and also four B (0, 32, 64,
and 128 g pot¡1) rates and three replications. The basal fertilization plan was composed of 2.4 g pot¡1
of N, P (P2O5), and K (K2O) and 0.08 g of oligomag. The B experiment did not receive oligomag, since
it also contains B. The nutrients were supplied as fertilizers ammonium nitrate (34.5% N), superphos-phate (18%, P2O5), potassium chloride (60%, K2O), neobor (15% B), and oligomag. The high rates of
fertilizers used in this experiment [estimated as 400 kg N, P (P2O5) and K (K2O) ha
¡1
, after taking into account a planting density of 62,500 plants ha¡1
] aimed to strongly increase leaf nutrient concentra-tions allowing the establishment of higher limits of sufficiency ranges. The preference for conventional fertilizers was due to their higher solubility and availability to plants. The fertilization plan was split
into four applications during the growing season. The pots werefilled with 15 kg of dry and sieved
(2 mm mesh) soil mixed with 15 g perlite kg¡1dry soil. The pots were also placed in holes in the
ground lined with PVC pipe to prevent direct sunlight reaching the walls of the pots.
Sample collection and tissue analyses
In the region, lemon balm is usually managed on a regime of multiple cuts during the summer growing season. In winter, the plants undergo a resting period due to the winter frost. In thefield trial, the plants were harvested three and four times, respectively in 2013 and 2014. The dates of sampling were 15 July, 2 September, and 4 November in 2013 and 7 May, 25 June, 12 August, and 6 October in 2014. In each cut, six plants from the inner rows of the plots were randomly selected. A subsample of young mature leaves was used for elemental analysis to serve as the standard tissue for the establishment of the sufficiency ranges. The remaining sample was separated into leaves and stems and used to estimate
dry matter yield and plant nutrient recovery. The plants were cut at»10 cm from the ground on early
flowering. All tissue materials were oven dried at 65C, weighed and ground. Tissue analyses were
per-formed by Kjeldahl (N), colorimetry (P and B),flame emission spectrometry (K), and atomic
absorp-tion spectrometry (Ca, Mg, Cu, Fe, Zn, and Mn) methods.
Plants of the pot experiment of 2013 were harvested four times during the growing season, on 7 May, 11 June, 12 August, and 4 October. The dates of sampling in 2014 were 23 June, 30 July, 10 September, and 23 October. In 2015, the dates of sampling were 22 June, 5 August, and 27 November. The harvesting method, pre-treatment of plant samples, and tissue analysis were the same as reported for thefield experiment.
Estimates of greenness or relative chlorophyll content in plant leaves were recorded by using the
portable SPAD-502 plus chlorophyll meter (Spectrum Technologies, Inc., Plainfield, IL, USA). The
tool estimates the SPAD-readings from the amount of light transmitted by the leaf in two wavelength regions in which the chlorophyll pigments absorb (650 nm, red light) and do not absorb (940 nm, infrared light) the radiation passing through the leaf. The readings were taken from the blade of fully
expanded young leaves. SPAD readings were taken from thefield experiments on 2 September 2013
and 7 May, 25 June, 12 August, and 6 October 2014 and from the pot experiments on 22 June, 5 August, and 27 October 2015.
Data analysis
The effect of the fertilizer treatments on dry matter yield of stems, leaves, and total was subjected to
analysis of variance (ANOVA). When significant differences among treatments occurred, the means
Critical nutrient concentration is defined as the point in the curve of the relationship between tissue nutrient concentration and yield below or above which there is, respectively, a high or low probability of obtaining a positive response of the crop if more nutrient is applied (Rodrigues et al.2005). Based on that relationship, a critical toxic (or excessive) tissue nutrient concentration can also be defined. To establish sufficiency ranges, tissue nutrient concentrations were divided into three classes: deficient; adequate; and excessive. The boundaries of the adequate range are set by the threshold values defined above. In this work, when a positive response to a given nutrient is found, critical nutrient
concentra-tions were determined by the graphical method of Cate–Nelson (Cate and Nelson1971), modified by
declaring the horizontal line at a fixed value (Rodrigues 2004). From the relationship between leaf
nutrient concentration and relative yield, a horizontal line wasfixed at 90% of relative yield, and the vertical line was free to keep the greatest amount of points in the positive quadrants. The Cate–Nelson technique is usually used in these kinds of studies since it can overcome the difficulty in obtaining a good relationship between tissue nutrient concentration and yield. Relative yields were estimated as the percentage of the maximum yield obtained in each individual experiment. The procedure allows removing most of the experimental variability and comparing critical values from a wide range of con-ditions. The sufficiency ranges of nutrients for which a response from the crop was not found, or those not included in the experimental design, were estimated by removing 10% of extreme high and low points of the scatterplot, since they probably are outliers associated with experimental error.
Crop nutrient removals were estimated from the highly productive plots of each experiment by mul-tiplying dry matter yield and tissue nutrient concentration after plant samples had been split into leaves and stems, weighed and analyzed separately. The results were expressed per ton of dry biomass.
Results
Crop response to fertilizer application
Lemon balm dry matter yield significantly increased in response to N application on almost all the
sampling dates of thefield trial and pot experiments. Data of thefield trial of 2014 are presented in
Figure 2. Leaf and total dry matter yields increased respectively from 9.0 to 15.3 g plant¡1and 35.8 to
55.2 g plant¡1
from the control treatment of the highest N rate.
In the pot experiments, the response of lemon balm to N application followed a similar trend as observed inFigure 2. However, in the PotN2015, where a treatment consisting of a very high rate of N was included, a plateau was observed where leaf and total dry matter yields did not increase with increased rates of applied N (Figure 3).
Lemon balm did not respond to P fertilization. In a total of 14 cuts of biomass, corresponding to the four P fertilization trials, no significant response to P application was found. The same occurred for K fertilization. In this study, no significant response by lemon balm to applied K was found, either in the
field trial or in the pot experiments.
Figure 2.Leaf (left) and total (leavesCstems) (right) dry matter (DM) yield of lemon balm grown in thefield trial of 2014 as a func-tion of four N rates [0 (N0), 50 (N50), 100 (N100), 150 (N150) kg ha¡1]. Letters above the columns is the result of the Tukey HSD test
Plants did not respond to B fertilization. However, when B was applied at excessively high rates (PotB2015) a significant decrease in dry matter yield was found (Figure 4). In the treatment consisting of 128 mg B pot¡1
only 3.8 and 5.7 g plant¡1
, respectively of leaf and total dry matter were recorded while in the control treatment much higher values were found, respectively 24.2 and 49.5 g plant¡1.
Sufficiency ranges
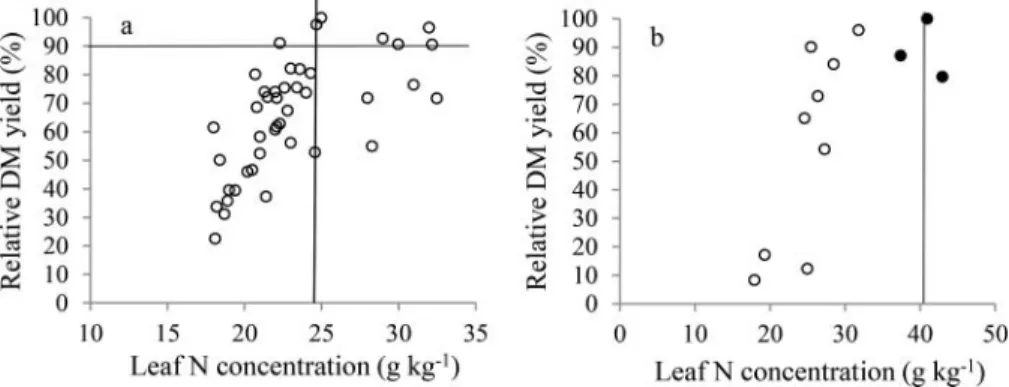
Critical leaf N concentration, which corresponds to the lower limit of the sufficiency range for N, was set as the average of the critical or threshold values of 18 plots obtained from the relationship between leaf N concentration and relative dry matter yield. The procedure is exemplified inFigure 5a by using data from the harvest of 23 June of the pot experiment of 2014. The values of all the 18 plots varied from 22 to 31 g kg¡1 averaging 27 g kg¡1. Critical leaf N concentrations for the individual plots
remained stable, below and above average over time, which gave 27 g kg¡1for the lower limit of the
sufficiency range for the entire growing season. The critical excessive leaf N concentration was set as the average of leaf N concentrations of the plants receiving an excessive rate of N. From the pot experi-ment of 2015, data of the harvest of 27 October is presented inFigure 5b as an example. By using data from all the harvests of this pot experiment, an average value of 40 g kg¡1
was estimated which became the proposal for the higher limit of the sufficiency range for N.
Lemon balm did not respond to P application. The sufficiency range for P was established by
removing»10% of values away from the center of the scatterplot, which probably are outliers
associ-ated with experimental error. From the individual plots it was observed that leaf P concentrations
Figure 3.Leaf (left) and total (leavesCstems) (right) dry matter (DM) yield of lemon balm grown in the pot experiment carried out in 2015 as a function of four N rates [0 (N0), 1.6 (N1.6), 3.2 (N3.2), 6.4 (N6.4) g pot¡1]. Letters above the columns is the result of the Tukey
HSD test (aD0.05) for the sum of DM yields of the three cuts of vegetation.
Figure 4.Leaf (left) and total (leavesCstems) (right) dry matter (DM) yield of lemon balm grown in the pot experiment carried out in 2015 as a function of four B rates (0, 32, 64, 128 mg pot¡1). The experiment was managed in two cuts (22 June and 5 August) during
consistently increased from the first to the last harvests over the growing season. Thus, the harvest dates were separated into two groups, from May to August and September to November. The two scat-terplots used to set the sufficiency ranges for P are presented inFigure 6.
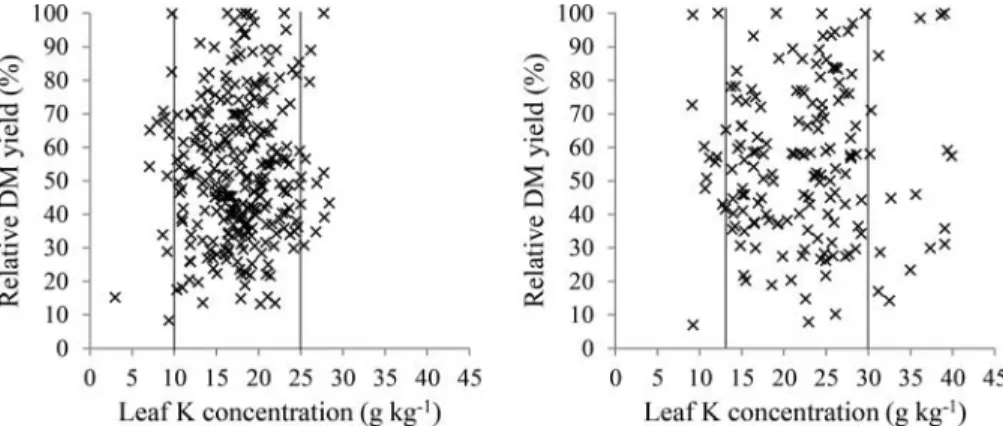
As observed for P, no significant response by lemon balm was found to K application. Leaf K
con-centrations also tended to increase throughout the growing season. Thus, the sufficiency ranges for K were estimated as reported for P (Figure 7).
In this study, considering all the experiments and dates of cut, no positive response to B application was found. However, when excessive B rates were used, aimed at establishing the higher limit of the sufficiency range, a significant decrease in dry matter yield was found (Figure 4). In this particular situ-ation, critical leaf B concentration was set as the average of the lower values of all the B0 (B zero) treat-ments. The value found was»18 mg B kg¡1, this being the value proposed for the lower limit of the
sufficiency range. From the pots excessively fertilized with B, a decrease in dry biomass yield was found
when the leaves contained between 75 and 150 mg B kg¡1
. The harvest of 5 August of the PotB2015 (Figure 8) shows one of those situations. The average of all the dates of cut gave 125 mg B kg¡1
, a leaf B concentration which will become the proposal for the higher limit of the sufficiency range.
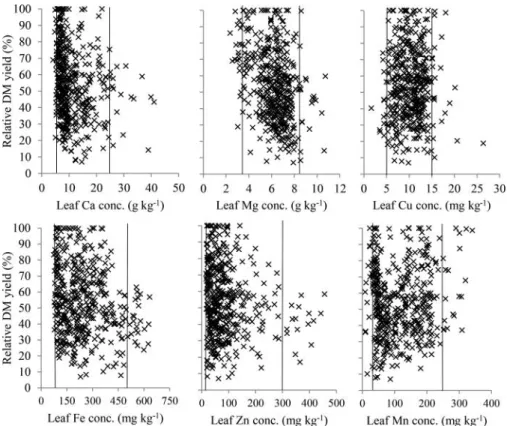
The methodology for establishing sufficiency ranges for the nutrients analyzed from plant tissues, but not included in the experimental design (Ca, Mg, Cu, Fe, Zn, and Mn), was the same as reported for the nutrients for which a response by dry matter yield to nutrient application was not found. Approximately 10% of the values positioned away from the center of the scatterplot were removed. This was to avoid incorporate outliers associated with experimental error, maintaining only those in
Figure 5.Critical leaf N concentration (a) estimated from the relationship between leaf N concentration and relative dry matter (DM) yield by using the Cate–Nelson technique (data from the harvest of 23 June of the pot experiment of 2014), and critical excessive leaf
N concentration (b) established from the average of the leaf N concentrations of the plants excessively fertilized with N (full symbols) (data of the harvest of 27 October of the pot experiment of 2015).
the range where the probability of occurrence is much higher. The scatterplots establishing the suffi -ciency ranges for Ca, Mg, Cu, Fe, Zn, and Mn are presented inFigure 9.
To set critical SPAD-readings the Cate–Nelson technique was applied to a total of eight plots. That corresponding to the harvest of 6 October of thefield trial of 2014 is shown inFigure 10a. A value of 30 was found as the average of the eight plots, being the proposal for the lower limit of the sufficiency range. The higher limit of the sufficiency range was estimated as the average of SPAD-readings of the plots excessively fertilized with N. The procedure is presented inFigure 10b. The estimated value was 45 which is proposed as the higher limit of the sufficiency range.
Table 2 summarizes the sufficiency ranges established for macro and micronutrients and SPAD readings. In the case of P and K, different sufficiency ranges were proposed for the first and second halves of the growing season since leaf concentrations of both the nutrients increased as the growing season progressed.
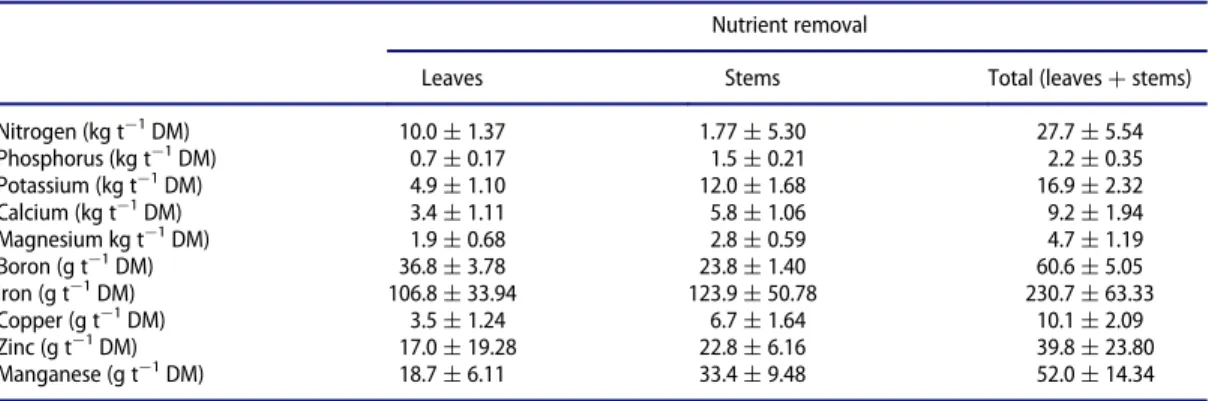
Crop nutrient removal
Crop nutrient removals were estimated from the plants grown in the most productive plots, multiply-ing leaf and stem dry matter yields by the nutrient concentrations in the respective plant part. The results were expressed as kg (macronutrients) or g (micronutrients) per ton of dry biomass (Table 3).
The total removals of macronutrients per ton of dry biomass in a cultivatedfield of lemon balm were
estimated in 27.7, 2.2, 16.9, 9.2, and 4.7 kg, respectively, for N, P, K, Ca, and Mg.
Figure 7.Sufficiency ranges for leaf K based on removing»10% of values away from the center of the scatterplot. Two set of data were established taking into account the variation observed in leaf K concentration during the growing season. Data were grouped into May, June, July, and August (left) and September, October, and November (right).
Discussion
Dry matter yield of lemon balm significantly increased with N applied as a fertilizer on almost all the
harvest dates of thefield and pot experiments. A previous study in Brazil had also shown that lemon
balm responded almost linearly to relatively high N rates (180 kg ha¡1
) (May et al.2008). From an
experiment carried out in Iran, Nemeth-Zamborine et al. (2015) reported that a moderate N rate (90 kg ha¡1
) was enough to maximize dry matter yield and essential oil content in the biomass. The response to applied N is the most common result from agricultural crops. Studies from the region of Braganca have shown positive responses to applied N in several herbaceous and perennial tree crops,¸ such as potato (Solanum tuberosumL.) (Rodrigues et al.2005), maize (Zea maysL.) (Rodrigues et al.
Figure 9.Sufficiency ranges for leaf Ca, Mg, Fe, Zn, Cu, and Mn after removing»10% of the extreme higher and lower values of each plot.
Figure 10.Critical SPAD reading (a) for lemon balm estimated by the Cate–Nelson technique (data from the harvest of 6 October 2014
2006), Jerusalem artichoke (Helianthus tuberosusL.) (Rodrigues et al.2007), stevia [Stevia rebaudiana
(Bertoni)] (Rodrigues et al.2016), and olive (Olea europaeaL.) (Rodrigues et al.2011). This is likely due to the fact that N does not accumulate in soils in readily available forms to plants. N should be applied annually as fertilizers or manures to agricultural soils or be allowed to enter the soil through a natural process, such as biological dinitrogenfixation (Rodrigues et al.2013,2015).
Lemon balm did not respond to applied P and K. Sharafzadeh, Khosh-Khui, and Javidnia (2011)
also did notfind an increase in dry matter yield of lemon balm in response to P application. However,
the authors reported a positive effect on lemon balm dry matter yield from a NP treatment. N
emeth-Zamborine et al. (2015) also reported positive effects on dry matter yield of lemon balm from applied P and K, but in combination with other nutrients, respectively in NPMg and NPKMg treatments. There are no studies reporting the effect of the application of B on lemon balm. In the present study, a positive response to the applied B was not found. However, B is a frequent nutritional disorder in the region, mainly in dicots when rainfed-managed (Arrobas et al.2010; Portela and Louzada2012). Since lemon balm was watered during the summer growing season, probably the irrigation water had sup-plied enough B to reduce the response to B apsup-plied as a fertilizer. Excessive B rates severely damaged the crop and reduced dry matter yield. It is well-known that the sufficiency ranges for B are usually narrower than those of other nutrients which increase the risk of B toxicity (Gupta1993; Nable, Ba~
nue-los, and Paull, 1997) and may explain the result that was obtained. Studies using manures have
reported an increase in lemon balm performance and in essential oil concentration in plant tissues (Santos et al.2009; Sodre et al.2013), probably as a result of nutrient release, particularly N, and an improvement in general soil fertility.
Threshold values or sufficiency ranges for lemon balm are not yet available in the literature. Even elemental analysis of plant tissue can hardly be found from previous work. Blank et al. (2006), from a pot experiment carried out in a greenhouse, reported leaf nutrient concentrations in plants subjected to a complete fertilization plan (NCPCKCSCBCCuCFeCZnCliming) and to other fertilization
treat-ments where each one of the nutrients were individually removed. In general, all the nutrients analyzed fell within the sufficiency ranges that are reported in the present work. From a brief comparison of the
Table 2.Sufficiency ranges for macro and micronutrients and SPAD-readings.
Macronutrients (g kg¡1) Micronutrients (mg kg¡1)
Nitrogen 27.0–40.0 Boron 18–125
Phosphorus 0.8–2.7y 1.5–3.8z Copper 5–25
Potassium 10.0–25.0y 18.0–30.0z Iron 75–500
Calcium 5.0–25.0 Zinc 20–300
Magnesium 3.5–8.5 Manganese 30–250
SPAD-readings 30–45
y
May to August;zSeptember to November.
Table 3.Nutrient removal (average§standard error) in the aerial biomass of lemon balm estimated from the most productive fertil-izer treatments.
Nutrient removal
Leaves Stems Total (leavesCstems)
Nitrogen (kg t¡1
DM) 10.0§1.37 1.77§5.30 27.7§5.54 Phosphorus (kg t¡1DM) 0.7§0.17 1.5§0.21 2.2§0.35
Potassium (kg t¡1
DM) 4.9§1.10 12.0§1.68 16.9§2.32 Calcium (kg t¡1DM) 3.4§1.11 5.8§1.06 9.2§1.94
Magnesium kg t¡1
DM) 1.9§0.68 2.8§0.59 4.7§1.19 Boron (g t¡1DM) 36.8§3.78 23.8§1.40 60.6§5.05
Iron (g t¡1DM) 106.8§33.94 123.9§50.78 230.7§63.33
Copper (g t¡1DM) 3.5§1.24 6.7§1.64 10.1§2.09
Zinc (g t¡1DM) 17.0§19.28 22.8§6.16 39.8§23.80
sufficiency ranges proposed here for lemon balm with those reported by Bryson et al. (2014) for some major herbaceous (winter wheat, potatoes,…) or perennial (vine, olive,…) crops widely grown in the
region, it is possible to note that the order of magnitude is similar but with specific differences for indi-vidual nutrients or species.
Crop nutrient removal is a function of aboveground dry matter yield and tissue nutrient concentra-tion, data for which does not seem to be available in the literature for lemon balm. There are studies, although few, reporting dry matter yield of lemon balm in different growing conditions, such asfield,
greenhouses, and pots (May et al.2008; Luz et al. 2014). Comparing the results of those authors to
these here reported and expressed on an area basis, they are not very dissimilar. It is expected that dry matter yield can greatly vary across the world, depending on the general growing conditions. To over-come the situation and increase the worldwide potential use of the present data, crop nutrient removals are here expressed per ton of dry biomass.
Conclusions
Lemon balm showed a strong response to N applied as a fertilizer in the conditions of these experi-ments, which means that the crop should be properly fertilized to achieve high yields. In contrast, there was no significant response to applied P, K, or B. Sufficiency ranges for ten essential nutrients were made available, which will allow the diagnosis of the nutritional status of lemon balm by means of
plant analysis by comparing actual leaf nutrient concentrations with the sufficiency ranges here
reported. These values are valid for phenological stages close to the time of commercial harvest. Data of crop removal for ten important macro and micronutrients were also provided, which can help in establishing fertilizer recommendations for this crop, since crop nutrient removals provide a direct measure of crop needs.
Acknowledgment
The authors wish to thank Jose Montanha for meteorological data.
Funding
The project“Sustainable management of medicinal and aromatic plants”(PRODER 46025) providedfinancial support.
References
Arrobas, M., J. I. Lopes, F. Pav~ao, J. E. Cabanas, and M. A. Rodrigues. 2010. Comparative boron nutritional diagnosis for olive based on July and January leaf samplings.Communications in Soil Science and Plant Analysis 41:709–20. doi:10.1080/00103620903563949.
Ashori, A., Y. Hamzeh, and F. Amani. 2011. Lemon balm (Melissa officinalis) stalk: chemical composition andfiber mor-phology.Journal of Polymers and the Environment19:297–300. doi:10.1007/s10924-010-0279-8.
Babulka, P. 2005. La melisse (Melissa officinalisL).Phytotherapie3:114–17. doi:10.1007/s10298-005-0084-z.
Biasi, L. A., A. P. J. Kowalski, D. Signor, M. A. Alves, F. I. Lima, and C. Deschamps. 2009. Tipos de cobertura do solo e
epocas de colheita na produc¸ao~ de melissa. Horticultura Brasileira 27:314–18. doi:10.1590/S0102-05362009000300009.
Blank, A. F., A. S. Oliveira, M. F. Arrigoni-Blank, and V. Faquin. 2006. Efeitos da aduba¸c~ao quımica e da calagem na nutric¸~ao de melissa e hortel~a-pimenta.Horticultura Brasileira24:195–98. doi:10.1590/S0102-05362006000200014. Blank, A. F., S. M. Fontes, A. S. Oliveira, M. C. Mendonca, R. Silva-Mann, and M. F. Arrigoni-Blank. 2005. Produ¸ ¸c~ao de
mudas, altura e intervalo de corte em melissa. Horticultura Brasileira 23:780–84. doi:10.1590/S0102-05362005000300018.
Bryson, G., H. A. Mills, D. N. Sasseville, J. B. Jones Jr., and A. V. Barker. 2014.Plant Analysis Handbook III. A guide to sampling, preparation, analysis and interpretation for agronomic and horticultural crops. Athens, GA: Micro-Macro Publishing, Inc.
Cunha, A. P., M. T. Nogueira, and O. R. Roque. 2012.Plantas aromaticas eoleos essenciais: composic¸~ao e aplica¸c~oes. Lisboa: Fundac¸~ao Calouste Gulbenkian.
Dias, M. I., L. Barros, M. J. Sousa, and I. C. F. R. Ferreira. 2012. Systematic comparison of nutraceuticals and antioxidant potential of cultivated, in vitro cultured and commercialMelissa officinalissamples.Food and Chemical Toxicology
50:1866–73. doi:10.1016/j.fct.2012.03.057.
Egner, H., R. Riehm, and W. R. Domingo. 1960. Untersuchungen iber die chemische Bodenanalyse als Grundlag fur die Beurteilunger des Nahrstoffzustandes der Boden, II: Chemische Extractionsmethoden zur Phosphor, und Kalium-bes-timmung.Kunglia Lantbrukshogskolans Annaler26:199–215.
Ghamarnia, H., F. Mousabeygi, and I. Arji. 2015. Lemon balm (Melissa officinalisL) water requirement, crop coefficients determination and SIMDualKc model implementing.European Journal of Medicinal Plants5:281–96. doi:10.9734/ EJMP/2015/14138.
Gr€unwald, J., and C. J€anicke. 2009.Gr€une apotheke (Green pharmacy) Grafe and Unzer Verlag. M€unchen: GmbH. Gupta, U. C. 1993. Deficiency, sufficiency, and toxicity levels of boron in crops. InBoron and its role in crop production,
ed. U. C. Gupta, 137–45. Boca Raton: CRC Press (FL).
Kamdem, J. P., A. Adeniran, A. A. Boligon, C. V. Klimaczewski, O. O. Elekofehinti, W. Hassan, M. Ibrahim, E. P. Wac-zuk, D. F. Meinerz, and M. L. Athayde. 2013. Antioxidant activity, genotoxicity and cytotoxicity evaluation of lemon balm (Melissa officinalisL) ethanolic extract: its potential role in neuroprotection.Industrial Crops and Products
51:26–34. doi:10.1016/j.indcrop.2013.08.056.
Leon-Fernandez, M., E. Sanchez-Govın, C. E. Quijano-Celis, and J. A. Pino. 2008. Effect of planting practice and harvest
time in oil content and its composition inMelissa officinalisL cultivated in Cuba.Journal of Essential Oil Bearing Plants11:62–68. doi:10.1080/0972060X.2008.10643599.
Lopez, V., S. Martın, M. Gomez-Serranillos, M. Carretero, A. J€ager, and M. Calvo. 2009. Neuroprotective and
neurologi-cal properties ofMelissa officinalis. Neurochemical Research34:1955–61. doi:10.1007/s11064-009-9981-0.
Lu~no, V., L. Gil, M. Olaciregui, R. A. Jerez, I. Blas, and F. Hozbor. 2015. Antioxidant effect of lemon balm (Melissa offi ci-nalis) and mate tea (Ilex paraguensys) on quality, lipid peroxidation and DNA oxidation of cryopreserved boar epidid-ymal spermatozoa.Andrologia47:1004–11. doi:10.1111/and.12370.
Luz, J. M. Q., S. M. Silva, L. L. Habber, and M. O. M. Marquez. 2014. Essential oil ofMelissa officinalisL at different seasons, sys-tems of planting and fertilizations.Revista Brasileira de Plantas Medicinais16:552–60. doi:10.1590/1983-084X/11_130. May, A., A. O. Bovi, L. V. Sacconi, A. G. Samra, and M. Q. Pinheiro. 2008. Produtividade da biomassa de melissa em
func¸~ao de intervalo de cortes e doses de nitrogenio. Horticultura Brasileira 26:312–15. doi:10.1590/S0102-05362008000300004.
Motsara, M. R., and R. N. Roy. 2008. Guide to laboratory establishment for plant nutrient analysis. FAO Fertilizer and Plant Nutrition Bulletin 19, Food and Agriculture Organization of the United Nations, Rome.
Nable, R. O., G. S. Ba~nuelos, and J. G. Paull. 1997. Boron toxicity. Plant and Soil 198:181–98. doi:10.1023/ A:1004272227886.
Nemeth-Zamborine, E., K. Szabo, P. Rajhart, L. Lelik, J. Bernath, and T. Popp. 2015. Effect of nutrients on drug produc-tion and essential oil content of lemon balm (Melissa officinalisL).Journal of .Essential Oil Bearing Plants18:1508– 15. doi:10.1080/0972060X.2014.935040.
Pereira, R. P., A. A. Boligon, A. S. Appel, R. Fachinetto, C. S. Ceron, J. E. Tanus-Santos, M. L. Athayde, and J. B. T. Rocha. 2014. Chemical composition, antioxidant and anticholinesterase activity ofMelissa officinalis. Industrial Crops and Products53:34–45. doi:10.1016/j.indcrop.2013.12.007.
Portela, E. M., and J. L. Louzada. 2012. Early diagnosis of boron deficiency in chestnut.Journal of Plant Nutrition35:304– 10. doi:10.1080/01904167.2012.636132.
Rabbani, M., Z. Etemadifar, F. Karamifard, and M. Borhani. 2016. Assessment of the antimicrobial activity ofMelissa offi -cinalisandLawsonia inermisextracts against some bacterial pathogens.Comparative Clinical Pathology 25:59–65. doi:10.1007/s00580-015-2140-x.
Rodrigues, M. A. 2004. Establishment of continuous critical levels for indices of plant and pre-sidedress soil N status in the potato crop.Communications in Soil Science and Plant Analysis35:2067–85. doi:10.1081/LCSS-200026837. Rodrigues, M. A., A. Pereira, J. E. Cabanas, L. Dias, J. Pires, and M. Arrobas. 2006. Crops use-efficiency of nitrogen from
manures permitted in organic farming.European Journal of Agronomy25:328–35. doi:10.1016/j.eja.2006.07.002. Rodrigues, M. A., C. M. Correia, A. M. Claro, I. Q. Ferreira, J. C. Barbosa, J. M. Moutinho-Pereira, E. A. Bacelar, A. A.
Fernandes-Silva, and M. Arrobas. 2013. Soil nitrogen availability in olive orchards after mulching legume cover crop residues. Scientia Horticulturae 156:45–51. doi:information: 101016/jscienta201304035. doi:10.1016/j. scienta.2013.04.035.
Rodrigues, M. A., F. Pav~ao, J. I. Lopes, V. Gomes, M. Arrobas, J. Moutinho-Pereira, S. Ruivo, J. E. Cabanas, and C. M. Correia. 2011. Olive yields and tree nutritional status during a four year period without nitrogen and boron fertiliza-tion.Communications in Soil Science and Plant Analysis42:803–14. doi:10.1080/00103624.2011.552656.
Rodrigues, M. A., J. Coutinho, J. Martins, and M. Arrobas. 2005. Quantitative sidedress nitrogen recommendations for potatoes based upon crop nutritional indices.European Journal of Agronomy23:79–88. doi:10.1016/j.eja.2004.10.001. Rodrigues, M. A., L. Sousa, J. E. Cabanas, and M. Arrobas. 2007. Tuber yield and leaf mineral composition of Jerusalem
artichoke (Helianthus tuberosusL) grown under different cropping practices.Spanish Journal of Agricultural Research
Rodrigues, M. A., P. Dimande, E. Pereira, I. Q. Ferreira, S. Freitas, C. M. Correia, J. Moutinho-Pereira, and M. Arrobas. 2015. Early-maturing annual legumes: an option for cover cropping in rainfed olive orchards.Nutrient Cycling in Agroecosystems103:153–66. doi:10.1007/s10705-015-9730-5.
Rodrigues, M. A., S. Afonso, I. Q. Ferreira, and M. Arrobas. 2016. Response of stevia to nitrogen fertilization and harvest-ing regime in Northeastern Portugal. Archives of Agronomy and Soil Science 63 (5):626–637. doi:101080/ 0365034020161230272.
Santos, M. F., M. C. Mendonca, J. L. S. Carvalho Filho, I. B. Dantas, R. Silva-Mann, and A. F. Blank. 2009. Esterco bovino¸ e biofertilizante no cultivo de erva-cidreira-verdadeira (Melissa officinalisL).Revista Brasileira de Plantas Medicinais
11:355–59. doi:10.1590/S1516-05722009000400001.
Sharafzadeh, S., M. Khosh-Khui, and K. Javidnia. 2011. Effects of nutrients on growth and active substances of lemon balm (Melissa officinalis).Acta Horticulturae925:229–32. doi:10.17660/ActaHortic.2011.925.33.
Sodre, A C. B., L. L. Haber, J. M. Q. Luz, M. O. M. Marques, and C. R. Rodrigues. 2013. Adubac¸~ao org^anica e mineral em melissa.Horticultura Brasileira31:147–52. doi:10.1590/S0102-05362013000100023.
Sodre, A. C. B., J. M. Q. Luz, L. L. Haber, M. O. M. Marques, C. R. Rodrigues, and A. F. Blank. 2012. Organic and mineral fertilization and chemical composition of lemon balm (Melissa officinalis) essential oil.Revista Brasileira de Farma-cognosia22:40–44. doi:10.1590/S0102-695X2011005000186.
Sousa, A. C., C. R. Gattass, D. S. Alviano, C. S. Alviano, A. F. Blank, and P. B. Alves. 2004.Melissa officinalisL essential oil: antitumoral and antioxidant activities. Journal of Pharmacy and Pharmacology 56:677–81. doi:10.1211/ 0022357023321.
Stanojevic, D., L. Comic, O. Stefanovic, and S. S. Sukdolak. 2010. In vitro synergistic antibacterial activity ofMelissa offi ci-nalisL and some preservatives.Spanish Journal of Agricultural Research8:109–15. doi:10.5424/sjar/2010081-1149. Taiwo, A. E., F. B. Leite, G. M. Lucena, M. Barros, D. Silveira, M. V. Silva, and V. M. Ferreira. 2012. Anxiolytic and
anti-depressant-like effects ofMelissa officinalis(lemon balm) extract in rats: influence of administration and gender.
Indian Journal of Pharmacology44:189–92. doi:10.4103/0253-7613.93846.
Vafaei, A. A., H. Miladi-Gorgi, A. Rashidy-Pour, A. A. Taherian, M. Jarrahi, and M. Emami-Abargoei. 2005. Anxiolytic effects of the aqueous extracts of Melissa officinalis and the role of opioid receptors in mice.Journal of the Neurologi-cal Sciences. doi:10.1016/S0022-510X(05)81319-X.
Weidner, C., M. Rousseau, A. Plauth, S. J. Wowro, C. Fischer, H. Abdel-Aziz, and S. Sauer. 2015.Melissa officinalisextract induces apoptosis and inhibits proliferation in colon cancer cells through formation of reactive oxygen species. Phyto-medicine22:262–70. doi:10.1016/j.phymed.2014.12.008.
![Figure 2. Leaf (left) and total (leaves C stems) (right) dry matter (DM) yield of lemon balm grown in the fi eld trial of 2014 as a func- func-tion of four N rates [0 (N0), 50 (N50), 100 (N100), 150 (N150) kg ha ¡1 ]](https://thumb-eu.123doks.com/thumbv2/123dok_br/16974717.762368/6.756.125.627.772.954/figure-leaf-total-leaves-stems-right-matter-yield.webp)
![Figure 3. Leaf (left) and total (leaves C stems) (right) dry matter (DM) yield of lemon balm grown in the pot experiment carried out in 2015 as a function of four N rates [0 (N0), 1.6 (N1.6), 3.2 (N3.2), 6.4 (N6.4) g pot ¡1 ]](https://thumb-eu.123doks.com/thumbv2/123dok_br/16974717.762368/7.756.126.629.76.274/figure-leaf-total-leaves-matter-experiment-carried-function.webp)