Abstract—With the objective of characterizing the profile and performance of energy use by slaughterhouses, surveys and audits were performed in two different facilities located in the northeastern region of Portugal. Energy consumption from multiple energy sources was assessed monthly, along with production and costs, for the same reference year. Gathered data was analyzed to identify and quantify the main consuming processes and to estimate energy efficiency indicators for benchmarking purposes. Main results show differences between the two slaughterhouses concerning energy sources, consumption by source and sector, and global energy efficiency. Electricity is the most used source in both slaughterhouses with a contribution of around 50%, being essentially used for meat processing and refrigeration. Natural gas, in slaughterhouse A, and pellets, in slaughterhouse B, used for heating water take the second place, with a mean contribution of about 45%. On average, a 62 kgoe/t specific energy consumption (SEC) was found, although with differences between slaughterhouses. A prominent negative correlation between SEC and carcass production was found specially in slaughterhouse A. Estimated Specific Energy Cost and Greenhouse Gases Intensity (GHGI) show mean values of about 50€/t and 1.8 tCO2e/toe, respectively. Main results show that there is a significant margin for improving energy efficiency and therefore lowering costs in this type of non-energy intensive industries.
Keywords—Meat industry, energy intensity, energy efficiency, GHG emissions.
I. INTRODUCTION
NERGY is a key factor to the global economy and the welfare of human population [1], [2]. Its strong connection to multiple economic, social and environmental issues makes energy a key element for sustainable development [3]. In the industrial sector, energy is nowadays acquiring special relevance in the decision-making structure of many world industries [4]. The widespread acceptance of the eco-efficiency concept by the industrial sector shows the increase of its awareness to reduce energy consumption and improve environmental performance [5], [6]. In fact, saving energy contributes to a more efficient production, increases competitiveness, enhances innovative capacity and allows industries to respond to environmental requirements imposed
M. Feliciano is with CIMO Research Center, Escola Superior Agrária do Instituto Politécnico de Bragança, Campus de Santa Apolónia, Apartado 1172, 5301-855 Bragança, Portugal (corresponding author to provide phone: +351273303339; e-mail: msabenca@ipb.pt).
F. Rodrigues, J.M.R.C.A. Santos and A. Gonçalves are with CIMO Research Center, Escola Superior Agrária do Instituto Politécnico de Bragança, Campus de Santa Apolónia, Apartado 1172, 5301-855 Bragança, Portugal (e-mail: fjmrodrigues@gmail.com, ajg@ipb.pt, josesantos@ipb.pt).
V. Leite is with Escola Superior de Tecnologia e Gestão do Instituto Politécnico de Bragança, Campus de Santa Apolónia, Apartado 1172, 5301-855 Bragança, Portugal (e-mail: avtl@ipb.pt).
by law, market and society in general.
Despite general progresses in promoting sustainable energy policies, there has been a global increase in energy consumption in recent years [7]. This trend has been largely driven by the rapid development of emerging economies and it is likely to continue in the near future. Portugal, until 2005, faced a similar situation, as there was an increase in energy intensity when compared to the EU27 average. This unfavorable trend has been reversed over the last five years, but the development of more ambitious and dynamic efforts in promoting energy efficiency and energy saving still remains a priority in all sectors of society, and it is particularly relevant to highly competitive sectors such as the food industry.
Food industry is the second largest manufacturing sector in Europe, with a 12.2% market share and 14.5% of the total manufacturing turnover [8]. Among food industry worldwide, meat industry is a growing sector accounting for about 65% of the global food production [9]. Although most meat industries are non-intensive energy consumers, improving energy efficiency of industrial processes is one of the most important options for lowering the dependence on fossil fuels, while lowering costs and greenhouse gas emissions. Many studies (e.g. [10]–[12]) show that it is possible to reduce the energy consumption in meat industries, either by applying adequate strategies or by implementing some adjustments to existent processes.
The Inovenergy Project - Energy Efficiency in the Food Industry Sector was launched in 2011 with the objective of surveying and analyzing energy use, providing technical support, and thus promoting efficiency measures in six food industry subsectors: meat, fish, dairy, wine, fruit & vegetables and food conservation & distribution. Portuguese food industry is the largest of the manufacturing industry sectors, accounting for a 13.7% market share and with net sales of over 10 thousand million Euros in 2012 [13]. The meat industry is one of the most important areas within the Portuguese food sector and has been growing over the last decade [14], [15]. This article addresses an energy study conducted within the framework of the aforementioned project at two slaughterhouses, with the main purpose of assessing energy performance of this type of meat industry facilities.
II.BRIEFDESCRIPTION OFSLAUGHTERHOUSEPROCESSES
The EU defines slaughterhouses as any premises, including facilities for moving or lairaging animals, used for the commercial slaughter of animals, as solipeds, ruminants, pigs, rabbits and poultry [16]. They can be specialized in a specific livestock, such as pigs, cattle, sheep, goats or rabbits, or they
Assessment of Energy Use and Energy Efficiency in
Two Portuguese Slaughterhouses
M. Feliciano, F. Rodrigues, A. Gonçalves, J. M. R. C. A. Santos, V. Leite
E
can be polyvalent.
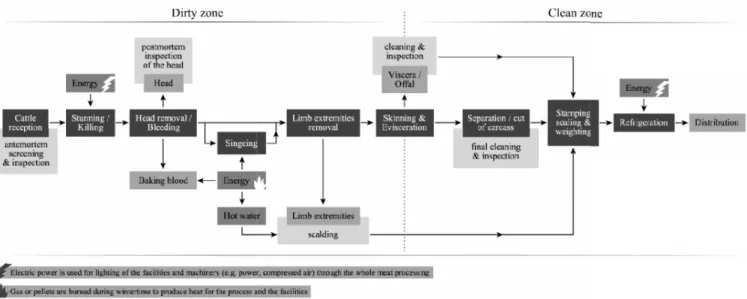
Fig. 1 General sche
Slaughterhouses receive and process live a carcasses and by-products, such as blood, fat, bones, white and red offal and leather. By-p be processed on-site. Fig. 1 shows the main processes, from the arrival of the animal, un matured and ready for distribution and Typically, the slaughterhouse’s processes ar two physical zones: the first one, named concerns mostly the killing of the animal and its interior elements (organs and fluids); th named the clean zone, is dedicated to the pre the carcass and viscera/offal for con evisceration is the process that usually defines Energy supply is required to assure various as the killing (that requires an electric shock) of some specific kinds of meat (e.g. pork), wh or other sources of energy to produce ho scalding. Electric power is also used for illum and to power the machinery along the including the generation of compressed air. will also be necessary for cleaning and waste Other energy sources, such as natural gas usually burned in boilers to produce heat in o blood and to warm up the facilities, particu cold weather. By the end of the process, meat are stored in cooling chambers which require e
III. METHODOLOGY
The study was performed with the colla polyvalent slaughterhouses located in the nor of Portugal, hereinafter referred to as SA industries slaughter cattle, goats, sheep and p semi-automated slaughtering procedure. Both similar installed capacity, but SA is slaugh about 6,300 heads (cattle 41%; goats 12% s
EEI Formula Terms
Specific energy
consumption, SEC
Qs, quantity of energy from source
s[kgoe];P, volume of production
[ton]. Specific energy
cost, SECost
Cs, costs with energy from sources [€];P, volume of production [ton]. GHG intensity,
GHGIa Efrom energy sources, emission of CO2equivalent
s[tons of CO2e];Qs, quantity of energy from sources[toe].
chematic of the process of meat production at a slaughterhouse
e animals into meat at, meat scraps and -products can also ain slaughterhouse until its carcass is and consumption. re organized into ed the dirty zone, and the removal of the second zone, preparation of both onsumption. The es the zones. ous processes, such
ck) or the singeing which requires gas, hot water for the uminating facilities e production line, ir. Energy supplies stewater treatment. as or pellets, are n order to bake the icularly during the eat and other goods re electricity.
llaboration of two northeastern region SA and SB. Both d pigs, following a oth industries have ughtering annually sheep 40%; pigs
7%) and SB about 6,100 heads (cat 40%; pigs 15%). Slaughtering proc depending on the type of animal b different stages illustrated in Fig. 1. preparation, they are split, usually stored in refrigerated chambers slaughterhouses’ customers. Some further split according to the requis packed and stored until delivery.
The study methodology consisted initial stage for surveying informa characteristics (e.g. dimension, ann costs and amount of energy inputs, production; a second stage involv facilities, with the purpose of identi major consuming processes, as we inefficiencies. Finally, the gathered and used to estimate energy effi widely employed for benchmarking p
TABLE I INDICATORSUSED TOASSESS THEEN
SLAUGHTERHOU
EEI Formula
Specific energy
consumption, SEC
Qs, q
s[kg
[ton] Specific energy
cost, SECost
Cs, c [€];P
GHG intensity,
GHGIa Efroms, em
CO2e sourc aGHG (Greenhouse Gases) intensity is bas emissions.
These EEIs are based on both th output (e.g. energy per unit of produ
cattle 45%; goats and sheep rocesses differ significantly l but in general follow the 1. Concerning the carcasses lly in two pieces, washed, rs and then delivered to etimes, carcasses can be uisites of the final product,
ed in two different stages: an mation on general industry nnual turnover, etc.), type, ts, raw material and annual lving energy audits in the ntifying and quantifying the well as pointing out energy d information was analyzed fficiency indicators (EEIs) g purposes (Table I).
I
NERGYEFFICIENCY OF THE USES
EEI Formula Terms
Specific energy
consumption, SEC
, quantity of energy from source [kgoe];P, volume of production
n]. Specific energy
cost, SECost
, costs with energy from sources P, volume of production [ton]. GHG intensity,
GHGIa om energy source, emission of CO2equivalent
s[tons of O2e];Qs, quantity of energy from
urces[toe].
based on carbon dioxide equivalent
the physical amount of the duction and GHG intensity)
used due to their adequacy in evaluating the e in manufacturing processes [17]–[20] incl industry [21].
The consumption for each energy source monthly to assess its variation during a full both slaughterhouses. A cost analysis was also up-to-date energy prices for Portugal, to e values and to assess the possible reduction order to determine the EEI values, the prod evaluated for the same period. The study information on the energy use per section/eq specific cost reduction strategies could be pres to be reported in further publications).
IV. RESULTS
A. Energy Use
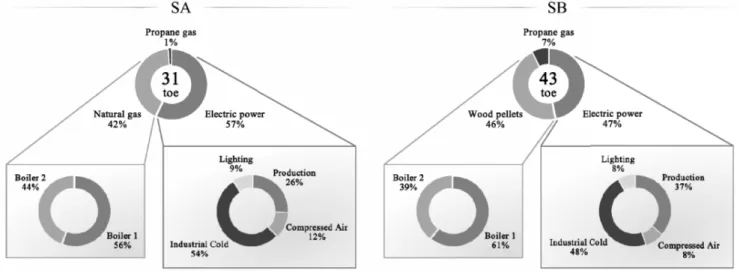
Fig. 2 shows the use of energy by both also identifying the consumption by source a The annual energy consumption is 31 toe an and SB respectively. According to the Portu
Fig. 2 Energy use fo
B. Production and Energy Use
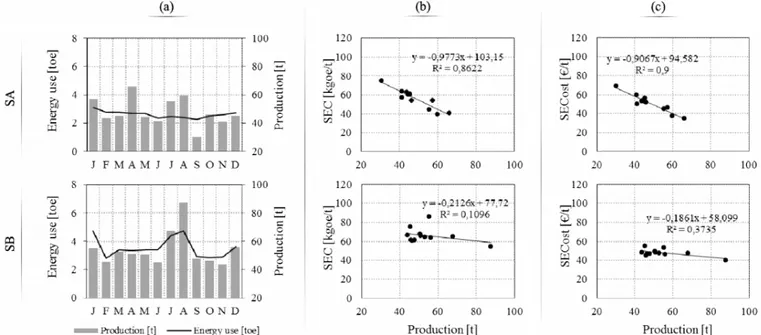
Fig. 3 (a) depicts the monthly production evolution for both slaughterhouses. Productio dress weight carcass in tonnes. Production exhibit distinct annual profiles in each Concerning energy use, SB exhibits a higher f the year (std value of 0.72 toe) with a ma consumption during the summer months, espe SA shows a near constant energy consumptio year, with a standard deviation of 0.23 to production is similar in both slaughterhouses, irregular slaughtering rates than those observ may be attributed to its location in a most where animal slaughter is demanded for the traditional products such as smoked ham and s
e energy efficiency ncluding the meat
rce was examined ll calendar year in lso performed with evaluate the EEI on of expenses. In roduction was also udy also provided /equipment so that resented (an aspect
th slaughterhouses, e and by subsector. and 43 toe, for SA rtuguese legislation
they are both non-energy intensive annual energy consumption is below (toe).
Electricity and natural gas are the in SA, while SB relies on electricity 90% of its total primary energy su electric power per sector is similar both cases, industrial cold, used for electricity consumer weighting aro findings reported for other European by other production processes, comp lighting.
At SA, natural gas, used as fuel f required for processing animal part represents 42% of the total energy c energy in SB is provided by two w pellets represent about 46% of total gas is also used in SB for singeing used as a backup fuel in the boilers.
for both slaughterhouses: consumption by source and by sector.
on and energy use tion corresponds to on and energy use h slaughterhouse. er fluctuation along marked increase in specially in August. tion throughout the toe. Annual meat s, but SB has more rved in SA, which ostly rural county, the manufacture of
d sausages.
In order to better understand energy use and production, an anal Specific Consumption Indicator (SE As shown in Fig. 3 (b), SEC increases, being this relationship we the SEC ranges from 54 to 86 kgoe/t only a slight tendency to decr production. Correlation coefficients s explains 93% (SA) and 33% (SB) o main results also show differences ar for SA and 66 kgoe/t for SB) b Ramírez et al. [21] report simila primary energy and typical technol such as 33.2 kgoe (cattle) or 50.1 dress carcass weight.
e industries since their total ow 500 tons of oil equivalent
he most used energy sources ity and pellets for more than supply. The distribution of lar in both organizations. In or meat storage, is the main around 50%, in line with ean countries [21], followed mpressed air production and
el for hot heating generation arts and sterilizing utensils, y consumption. The thermal wood pellets boilers. Wood tal primary energy. Propane ing swine skins, being also s.
.
d the relationship between nalysis based on the Energy (SEC) was also performed. decreases as production well evident for SA. At SB, e/t throughout the year, with crease inversely to meat ts show that the linear model ) of the data. Moreover, the around 10 kgoe/t (56 kgoe/t ) between slaughterhouses. ilar SEC values regarding nologies for the late 1990s, .1 kgoe (pork) per tonne of
C.Energy Use and Cost
Regarding the energy costs, SB spends more than SA. However, based on the analys indicator (Fig. 3 (c)), it is evident that SB is m the typical productions. The energy cost per t average 1.06 times higher in SA (51.13€/t)
Fig. 3 Main results of the study conducted at sla correlation between SEC and me
D.GHG Emissions and Energy Use The CO2equivalent emissions (CO2e) wer
each slaughterhouse, per energy source (see F conversions shown in Table II. Wood pellets a are considered as carbon neutral [22]–[ emissions from its combustion were also acco analysis.
TABLE II
CONVERSIONFACTORSUSED TODETERMINE THEEQUIVA
CO2
Energy source Conversion/emission factor Reference Electric powera 1 kWh - 0.47 kg CO2e
[26] Natural gas 1 kg - 1.077 kgoe - 2.89 kg CO2
Propane gas 1 kg - 1.099 kgoe - 2.90 kg CO2
Wood pellets 1 kg - 0.401 kgoe–0.746 kg CO [26], [27] aConsidering an efficiency of 40% on converting prim
Main results show that SA emits less GH tCO2e, than SB with 88 tCO2e, when emissio
pellets are accounted for (Fig. 4), leading to of 2.4 tCO2e/toe for SA and 2.05 tCO2e/toe fo
considering that carbon dioxide emitted combustion in SB is recycled into biomass CO2e emissions from SB will drop to about 59
GHG intensity of SB to 1.21 tCO2e/toe. Even
more energy, its direct contribution for the rad lower than those estimated for SA.
s about 1.1 times lysis of the SECost s more efficient for r ton of meat is on ) than it is in SB
(48.03 €/t). For the most prevail which are in the range 40-60 t/mont amount of meat with lower costs th less.. The relationship found betwee clearly shows that SA can substantia by increasing its production.
slaughterhouses A and B: (a) Monthly energy consumption and m meat production; (c) linear correlation between SECost and meat p
ere determined for e Fig. 4), using the ts as a biomass fuel ]–[25], but GHG ccounted for in the
IVALENTEMISSIONS OF
Energy source tor Reference
Electric powera
[26]
Natural gas O2e
Propane gas O2e
Wood pellets CO2e [26], [27]
imary into final energy.
HG, a total of 75 sions from burning to GHG intensities e for SB. However, tted from pellets ss as it grows, net t 59%, lowering the en though SB uses radiative forcing is
Fig. 4 CO2equivalent emissions, tota slaughterhous
V.CONCLUSIO
The energy surveys and energy study allowed for the definition profiles in both slaughterhouses. slaughterhouses were also identified analysis of EEIs proved to be information due to the seasonality industries. SEC values showed tha consumption per tonne of meat prod lower amount, and it gets even increases. An identical reading was also decreases when production suggest that there is an increase in gets closer to its full capacity.
Regarding CO2e emissions, it is
energy is consumed, the more green
ing monthly productions, onth, SB processes the same than SA, approximately 1/4 een SECost and production ntially increase its efficiency
meat production; (b) linear at production
Energy source Conversion/emission factor Reference Electric powera 1 kWh - 0.47 kg CO2e
[26] Natural gas 1 kg - 1.077 kgoe - 2.89 kg CO2e
Propane gas 1 kg - 1.099 kgoe - 2.90 kg CO2e
Wood pellets 1 kg - 0.401 kgoe–0.746 kg CO2e [26], [27]
otal and per sector, for each ouse
SIONS
gy audits performed in this n of energy consumption s. The main consumers in ied and quantified. Monthly e an important source of ty associated to this type of hat SA has a lower energy roduced, while processing a en lower when production as found for the cost, which n rises. Therefore, results in efficiency as the facility
is expectable that the more eenhouse gases are emitted.
Considering every energy source is not carbon neutral, SA can be considered as more efficient in terms of CO2e emissions.
However, when using biomass or a biomass derived fuel (e.g. pellets), accountable emissions decrease considerably, thus lowering GHG intensity.
Main results show that there is a relevant potential margin for improving energy efficiency and lowering costs in any slaughterhouse of the region. Therefore, Portuguese meat sector which is strongly dependent on meat imports can benefit from a better energy management throughout the whole meat production chain, including the slaughtering.
The representativeness of this study is low at the national context, but even so it represents an important contribution to fill in the significant gap existing in Portugal and in other parts of the world concerning energy evaluation in non-energy intensive companies. This study can also be a helpful contribution to raise awareness for energy efficiency and environmental optimization at slaughterhouses and other food industries.
ACKNOWLEDGMENT
This research was co-funded by the project INOVENERGY (Energy Efficiency in the Food Industry sector, FCOMP-05-0128-FEDER-018642).
The authors gratefully acknowledge the involved slaughterhouses for providing relevant data for this study.
REFERENCES
[1] D.I. Stern,“The Role of Energy in Economic Growth”. CCEP working paper 3.10. Centre for Climate Economics & Policy. Crawford School of Economics and Government, the Australian National University, Canberra, 2010.
[2] R.U. Ayres, J.C.J.M. van den Bergh, D. Lindenberger, B. Warr,“The underestimated contribution of energy to economic growth”,Structural
Change and Economic Dynamics, 27, pp. 79-88, 2013.
[3] A.K. Jorgenson, A. Alekseyko, V. Giedraitis,“Energy consumption, human well-being and economic development in central and eastern European nations: A cautionary tale of sustainability”,Energy Policy,
66, pp. 419-427, 2014.
[4] K. Tanaka,“Review of policies and measures for energy efficiency in industry sector”,Energy Policy, 39(10), pp. 6532-6550, 2011.
[5] S. Schmidheiny with the Business Council on Sustainable Development,
“Changing course: a global business perspective on development and the
environment”,ISBN: 978-0-262-69153-6, MIT Press, 1992.
[6] V. Magueijo, M.C. Fernandes, H.A. Matos, C.P. Nunes, J.P. Calau, J. Carneiro, F. Oliveira, “Energy efficiency measures applicable to the
Portuguese industry: a brief technological framework”,ISBN: 978-972-8646-18-9, ADENE - Portuguese Agency for Energy, 2010.
[7] EIA, “International Energy Outlook 2013”, U.S. Energy Information Administration, Office of Energy Analysis, U.S. Department of Energy, 2013.
[8] CEC, Commission staff working document “European industry in a changing world, updated sectorial overview 2009”, SEC document, Commission of the European Communities, 1999.
[9] FAOSTAT, “FAO Statistical Yearbook 2013: World Food and Agriculture”,ISSN: 2225-7373, Food and Agriculture Organization of
the United Nations, Rome, Italy, 2013.
[10] A. Fritzson, T. Berntsson,“Efficient energy use in a slaughter and meat processing plant – opportunities for process integration”, Journal of
Food Engineering, 76 (4), pp. 594-604, 2006.
[11] A. Fritzson, T. Berntsson, “Energy efficiency in the slaughter and meat
processing industry–opportunities for improvements in future energy markets”,Journal of Food Engineering, 77 (4), pp. 792-802, 2006.
[12] M. Alcázar-Ortega, C. Álvarez-Bel, G. Escrivá-Escrivá, A. Domijan,
“Evaluation and assessment of demand response potential applied to the meat industry”,Applied Energy, 92, pp. 84-91, 2012.
[13] INE, I.P,“Estatísticas da Produção Industrial 2012”,ISBN:
978-989-25-0201-4, Instituto Nacional de Estatística, I.P., Lisboa, Portugal, 2013, from www.ine.pt.
[14] INE, I.P, “Estatísticas Agrícolas 2000”, ISBN:972-673-526-2, Instituto Nacional de Estatística, I.P., Lisboa, Portugal, 2001, from www.ine.pt. [15] INE, I.P, “Estatísticas Agrícolas 2012”, ISBN: 978-989-25-0198-7,
Instituto Nacional de Estatística, I.P., Lisboa, Portugal, 2013, from www.ine.pt.
[16] Council Directive 93/119/EC, of 22 December 1993, on the protection of animals at the time of slaughter or killing, Official Journal of the European Communities, OJ L 340, pp. 21-34, (31/12/1993).
[17] B. Hyman, T. Reed,“Energy intensity of manufacturing processes”,
Energy, 20(7), pp. 593-606, 1995.
[18] S.L. Freeman, M.J. Niefer, J.M. Roop,“Measuring industrial energy intensity: practical issues and problems”, Energy Policy, 25(7-9), pp. 703-714, 1997.
[19] X. Olsthoorn, D. Tyteca, W. Wehrmeyer, M. Wagner,“Environmental indicators for business: a review of the literature and standardisation methods”,Journal of Cleaner Production, 9(5), pp. 453-463, 2001.
[20] D. Maxime, M. Marcotte, Y. Arcand,“Development of eco-efficiency indicators for the Canadian food and beverage industry”, Journal of
Cleaner Production, 14 (6-7), pp. 636-648, 2006.
[21] C.A. Ramírez, M. Patel, K. Blok,“How much energy to process one pound of meat? A comparison of energy use and specific energy consumption in the meat industry of four European countries”.Energy, 31(12), pp. 2047-2063, 2006.
[22] R.T. Watson, I.R. Noble, B. Bolin, N.H. Ravindranath, D.J. Verardo, D.J. Dokken, “Land Use, Land-Use Change, and Forestry Special
Report”, ISBN: 92-9169-114-3, Intergovernmental Panel on Climate Change (IPCC), Cambridge University Press, Cambridge, 2000. [23] B. Wahlund, J. Yan, M. Westermark,“Increasing biomass utilisation in
energy systems: a comparative study of CO2reduction and cost for different bioenergy processing options”,Biomass and Bioenergy, 26(6), pp. 531-544, 2004.
[24] A.K.P. Raymer, “A comparison of avoided greenhouse gas emissions
when usingdifferent kinds of wood energy”,Biomass and Bioenergy, 30(7), pp. 605-617, 2006.
[25] H.K. Sjølie, B. Solberg,“Greenhouse gas emission impacts of use of Norwegian wood pellets: a sensitivity analysis”,Environmental Science & Policy, 14(8), pp. 1028-1040, 2011.
[26] PEA, Portuguese environment Agency, “Portuguese National Inventory Report on Greenhouse Gases, 1990– 2011”, Amadora, Portugal, 2013.
[27] A.P. Fernandes, C. Alves, C. Gonçalves, L. Tarelho, C. Pio, C. Schimdl,
H. Bauer, “Emission factors from residential combustion appliances burning Portuguese biomass fuels”, Journal of Environmental
Monitoring, 13, pp. 3196-3206, 2011.