Ž .
Spectrochimica Acta Part B 55 2000 1195]1240
Review
Axially and radially viewed inductively coupled plasmas
}
a critical review
I.B. Brenner
U,1, A.T. Zander
2Varian, Inc., 3120 Hansen Way, Palo Alto, CA 94304, USA
Received 16 February 1999; accepted 19 May 2000
Abstract
Ž .
The present status of axially viewed inductively coupled plasmas ICP is reviewed with special emphasis placed on the analytical performance of currently available systems. Descriptions are given of the various designs of the plasma]spectrometer configuration. Conventional figures of merit such as limits of detection, background behavior,
Ž .
interferences due to easily ionized elements EIE , Ca and acids, and the Mg II 280.270 nmrMg I 285.213 nm intensity ratio, are used to compare the performance of axially viewed and radially viewed ICPs. Various modes of
Ž .
sample introduction, including conventional pneumatic and ultrasonic nebulization USN , thermospray and a direct
Ž .
injection probe will be described. For axially viewed ICPs, limits of detection LOD are improved by factors varying from approximately 2 to 30. Additional improvements by factors of 2]20 can be obtained using USN. The improvement factors generally depend on energy potentials of the spectral lines and the element. Although limits of detection in the presence of Ca and Na are degraded relative to an aqueous solution 10]30-fold, USN LODs using an axially viewed ICP are improved relative to those obtained using a pneumatic nebulizer for solutions containing
Ž
Ca and Na. With normal aerosol load and under robust plasma conditions as evidenced by Mg IIrMg I intensity .
ratios )8 , EIE, Ca and mineral acid induced interferences are relatively small and are similar in axial and conventional radial configurations. However, interferences due to Ca are larger than those caused by Na due to the larger amount of energy required to dissociate the matrix. Matrix effects increase considerably when an USN is employed. For robust plasmas, ICP operating conditions and performance for multi-element quantitative analysis do not differ significantly from those of conventional radial configurations. In cases where robustness decreases, matrix interferences should be taken into account when establishing optimum conditions for operation. In robust axially viewed ICPs, a single internal standard can compensate for ionic line intensity suppression due to Na. However,
U
Corresponding author. Fax:q972-2-6797-145.
Ž .
E-mail address:[email protected] I.B. Brenner . 1
Present address: Environmental Analytical Laboratory, Ben Gurion University of the Negev. 9 Dishon Street, Malkha, Jerusalem 96956, Israel.
2
Present address: Molecular Devices, Inc., 1311 Orleans Drive, Sunnyvale, CA 94089, USA. 0584-8547r00r$ - see front matter Q2000 Elsevier Science B.V. All rights reserved.
Ž .
( )
I.B. Brenner, A.T. ZanderrSpectrochimica Acta Part B: Atomic Spectroscopy 55 2000 1195]1240 1196
owing to the variable influence of Ca on spectral response, more than one internal standard is required to compensate for these matrix effects. In this situation, linear energy potential-interference functions can be used to improve accuracy using spectral lines varying over wide ranges of energy potentials. In axially viewed ICPs, Mg IIr Mg I ratios vary widely as a function of applied RF power, aerosol flow rates and load, diameter of the central torch injector, and composition of the aspirated solution. The highest values of 9]13 have been observed for a pure
Ž y1.
aqueous solution using conventional nebulization and argon carrier flow rates 0.5]0.7 ml min and forward powers of 1.2]1.5 kW. Mg IIrMg I ratios decrease when the RF power decreases, when Na and Ca are added to the plasma, and when the aerosol load is increased. A low value of 2 was obtained when the carrier gas flow rate was high and when the aerosol load was high using an USN. The use of a copper metal skimmer below the analytical observation zone to isolate the axial channel of the ICP and to deflect the outer cool fringe results in 5]20 times
Ž
improvement of the LODs compared to those obtained using a conventional configuration a normal radially viewed
. Ž .
ICP . A direct He purged plasma]spectrometer interface for end-on detection of the vacuum UV VUV emission from the axial region of an ICP allows the determination of Cl, Br and other analytes in the mg ly1
range. The characteristics of a secondary discharge at the orifice of a Cu cone when the axial channel of the ICP is extracted into a vacuum chamber will be discussed. The characteristics of the emission in the Mach disk region extracted from the axial column will be surveyed. Several applications and techniques are described: determination of major, minor and trace elements in geological, environmental and biological materials, analysis of brines, nuclear materials and organic solvents and solutions. Several unique techniques are described: elemental speciation, determination of the halides and other analytes with VUV spectral lines using a He purged direct plasma]spectrometer interface. Direct solids analysis using slurries, laser and spark ablation and direct solids insertion further extends the scope of axially viewed ICPs.Q2000 Elsevier Science B.V. All rights reserved.
Keywords: Axial and radial viewing; Limits of detection; Sample introduction; Interference effects; Mg IIrMg I
intensity ratio
1. Introduction
An axially or end-on viewed inductively
cou-Ž .
pled plasma ICP as opposed to radially or side-on viewed can be defined as the observatiside-on of the plasma from its apex along the plasma column in the direction of the plasma fireball. Until recently, the ICP with atomic emission detection has been routinely viewed radially at 908 to the central channel of the plasma. With this conven-tional mode of operation the limits of detection ŽLODs can be improved by increasing the effi-. ciency of aerosol generation and transport using
Ž .
ultrasonic nebulization USN with desolvation w1,2 , thermospray 3,4 , by analyte preconcentra-x w x
w x
tion and matrix elimination 5 and improving the signal-to-background ratio by enhancing spectral
w x
resolution 6 . Further signal enhancements have been achieved by using mixed gas Ar plasmas
w x
containing hydrogen 7 and by creating a ‘pinch’ w x
plasma 8 . For low excitation energy elements, LODs can also be improved by increasing the
Ž
aerosol or the so-called sheath gas flow an
auxil-iary gas flow introduced around the aerosol stream . w x between the torch and the spray chamber 9 . This results in a temperature decrease, which enhances the intensities of low energy potential spectral lines.
Improvement of LODs is a challenge for ICP
Ž .
atomic emission spectrometry AES , as the abun-dance of several elements of environmental, bio-logical and geochemical significance is too low for direct determination. In the last few decades, it was shown that ICP-AES LODs could be improved substantially by axial viewing of the
w x
plasma 10]22 . The first report on the perfor-mance of an axially viewed ICP was by Mermet
w x
and co-workers in 1976 10 . In that publication, the setup both for AES and atomic absorption
Ž .
spectrometry AAS measurements was described. LODs were improved up to fivefold; the linear range was approximately four orders of
magni-w x w x
tude. Lichte and Koirtyohann 11 , Demers 12 ,
w x Ž w x.
Kornblum 13 , Danielsson in Kornblum 13 w x
( )
I.B. Brenner, A.T. ZanderrSpectrochimica Acta Part B: Atomic Spectroscopy 55 2000 1195]1240 1197
w x
observation. Demers 12 reported up to a 10-fold improvement of LODs for an axially viewed ICP. A close inspection of Demer’s data reveals that most of the LOD improvement is due to a decrease in the relative standard deviation ŽR.S.D. of the background. Signal-to-background.
Ž .
ratios SBR were not improved by a factor of 10. Ž Indeed, in some cases they even decreased e.g. Pb II 220.353 nm, Mermet, personal
communica-.
tion . Moreover, the dynamic range was reduced and EIEs and alkali earth elements affected the spectral response. The decrease in dynamic range was attributed to cool absorbing atoms along the optical viewing path, while matrix interferences were attributed to the observation of solution vaporization and ionization effects in the cool plasma fringe. In the second ICP Conference in
Ž
Noordwijk aan Zee in 1978, Danielsson in Korn-w x.
blum 13 reported data on the performance of an ICP using an intensified diode array emission
Ž .
spectrometer IDES detector. It was observed that the SBRs of both the atom and the ion lines have maximum values in the central part of the plasma column and that they were higher than those of radially viewed ICPs by up to an order of magnitude. Argon lines and background contin-uum showed maximum intensities in the ‘skin zone’. It was also observed that the maximum intensities of As, Ge, Sb, and C were off axis and that they were dependent on the flow rate and
w x
RF power. Demers 12 and De Loos-Vollebregt w x
et al. 16 employed a water-cooled low-power ICP and found in contradiction to the results previously cited, that compared to a conventional plasma the linearity of the calibration curves of their axially viewed system was the same. More-over, there was a remarkable reduction of
inter-w x
ferences. Fuxing et al. 17,18 used an axially viewed ICP coupled to a quartz prism emission spectrograph for the determinations of trace ele-ments in NaCl brines.
w x
Montaser and Fassel 23 located a copper metal skimmer below the analytical observation zone to isolate the axial channel of the ICP and to deflect the outer cool fringe. They observed that SBRs and LODs were 5]20 times superior to those obtained using a conventional configuration. In
w x
the late 1980s, Houk and his co-workers 24]27 ,
reported both fundamental and analytical investi-gations of the VUV emission from the axial region of an atmospheric pressure ICP using a unique direct plasma]spectrometer interface. A water-cooled Cu-metal cone with a circular orifice was mounted on the entrance slit of a He-purged monochromator. The VUV spectral lines of Cl, Br and other analytes were observed, showing mg
y1 w x
l LODs. Houk and his co-workers 24]27 de-scribed the characteristics of a secondary dis-charge generated on the tip of a Cu-metal cone, when the axial channel of the ICP was extracted into a vacuum chamber. The intensities of the ion lines were enhanced by an order of magnitude relative to the ICP itself. However, the low energy potential atom lines were suppressed. This sec-ondary discharge, which sampled the axial region of the ICP, was claimed to have analytical bene-fits for AES. It was concluded that atomization, excitation and ionization processes prevailing in this axial discharge are more efficient than in the plasma itself. Indeed, a similar discharge was employed to vaporize solid samples for introduc-w x tion into the ICP by Farnsworth and Hieftje 28 .
w x
Lim and Houk 29 were first to report mea-surements of optical emission spectra in reduced-pressure plasmas extracted from the ax-ial region of an atmospheric ICP. In comparison to a conventional ICP, the analyte intensities from the reduced pressure discharge were lower
w x
by factors up to 1000. Borer and Hiefjte 30,31 also evaluated an axially viewed microwave-boosted reduced-pressure plasma extracted from
w x
an atmospheric ICP. Luan et al. 32 and Ma’an w x
and Houk 33 described the characteristics of the emission in the Mach disk region generated from the axial column of a 40-MHz ICP. Intensities in the Mach disk were lower than those observed in conventional radially and axially viewed ICPs by factors varying from 100 to 1000.
( )
I.B. Brenner, A.T. ZanderrSpectrochimica Acta Part B: Atomic Spectroscopy 55 2000 1195]1240 1198
simple arrangement until the early 1990s. This was due to the conflicting reports describing the response of axially viewed ICPs to various inter-ference effects, with detailed characterizations being neglected. Recently however, the strengths and weaknesses of axially viewed plasmas were reconsidered in response to the challenge to im-prove LODs for environmental analysis using ICP-AES. A period of intense study aimed at examining the analytical advantages and disad-vantages of this configuration resulted in an increase in the number of publications and the availability of commercial instrumentation.
w x
Perusal of the recent literature 34]44 indicates that emphasis has been placed on the comparison of the axial configurations with radially observed ICPs. The studies focus mainly on LOD improve-ments and EIE, Ca and mineral acid interfer-ences on the emission signals of ion and atom lines using conventional and high aerosol loads, and the role of internal standardization. Claims are now being made that the analytical perfor-mance of axially viewed robust ICPs is similar to
w x
that obtained with radial viewing 35,36,40]44 . This review is undertaken with this considera-tion in mind and an attempt will be made to provide answers to the following issues: is the analytical performance of axially viewed ICPs
similar to radially viewed configurations, and what are the limitations and benefits? The review will cover the following topics: instrumentation, ana-lytical figures of merit such as LODs, the magni-tude and nature of interferences due to EIEs, Ca, and mineral acids; influence of ICP operating conditions such as RF power and aerosol flow rate. The relation with energy potentials of the analyte lines will be outlined. The utility of the Mg II 280.270 nmrMg I 285.213 intensity ratio as a criterion of plasma robustness will be examined. Several applications will be described: geological, biological and agricultural samples, foods, cosmetics, steels, analysis of organic solvents, so-lutions, speciation, determination of the halides using VUV spectral lines, and direct solids analy-sis using slurry nebulization, laser and spark abla-tion, and direct solids insertion.
2. Instrumentation
2.1. Torch configuration
In axially viewed ICPs the configuration of the torch itself is somewhat different from those used
w x
in radial viewing. Abdallah et al. 10 used an adjustable demountable torch, the outer sleeve of
w x Ž . Ž .
( )
I.B. Brenner, A.T. ZanderrSpectrochimica Acta Part B: Atomic Spectroscopy 55 2000 1195]1240 1199
Ž .
which was extended Fig. 1 . The number of turns in the RF coil was five. In axially viewed ICPs, the outer sleeve of the torch is now commonly extended so that the plasma is confined and air
w x
entrainment is minimized. Nakamura et al. 39,45 studied the analytical performance of a long torch. LODs of 24 elements in the spectral range 210]770 nm were measured and it was observed that they were improved from 50% for Be to sevenfold for Al. In the configuration used by
w x
Brenner et al. 36 an extended torch with a wide 2.3-mm injector, was positioned in the holder so that the distance between the intermediate tube and the load coil was approximately 2 mm. The distance between the coil and the top of the outer tube of the torch was 3 mm, and the distance between the top of the outer tube of the torch
w x
and the cooled cone was 1.4 mm 36 . In the study w x
described by Brenner et al. 37 , the viewing posi-tion was automatically adjusted using Mn II 257.610 nm. The Mn emission was continuously measured while the X]Y]Z position of the torch was moved under computer control. The top of
Ž .
the torch injector 2 mm i.d. was positioned 0.25]1 mm below the intermediate tube and the distance of the cut-off gas snout from the top of w x the plasma coil was 5 mm. De Loos-Vollebregt 4 used a low-flow water-cooled ICP. A ball-shaped plasma, highly suitable for axial viewing, was formed. LODs were improved by a factor of 4. A cut-off gas was not employed. Dalhquist et al. w46 , employed a ceramic torch. The use of purex alumina torches has an advantage if low Si levels have to be determined.
w x
Huang et al. 47 investigated matrix effects with an extended torch using laser excited fluor-escence and emission. They measured the intensi-ties of Ca I, Ca II, Ba I, Ba II, Mg I, Mg II, Na I and Cu I lines as a function of RF power and observed that the relationships were different from those found with a conventional short ICP torch. The effect of K on the fluorescence of Ca I and Ca II lines was considerably larger than with a conventional short torch. These authors cau-tioned that the use of extended torches such as those used in axially viewed ICPs could result in substantial ionization interferences.
An important component of the torch is the
internal diameter of the central injector. Mermet
w x
and co-workers 35,42,43,48]50 showed that resi-dence time and plasma robustness increased when
Ž .
a wide )2 mm central torch injector is
employed. They emphasized the influence of the torch injector diameter on energy transfer from the plasma to the central channel. Indeed when
w x
Ivaldi and Tyson 34 used a narrow bore injector, the Mg II 280.270rMg I 285.213 intensity ratios were low indicating that the plasma was not
w x
robust. Brenner et al. 37 using the same instru-ment and torch configuration employed a wider
Ž .
injector 2 mm and obtained higher ratios. Bren-w x
ner et al. 36 also used a wide central injector Ž2.3 mm with a sequential spectrometer Varian. Ž
.
Liberty and a high efficiency RF power
genera-Ž .
tor, and obtained high Mg IIrMg I ratios )8 even at 1 kW. Wide injectors up to 3 mm are installed in JY demountable Ryton torches.
w x
Conver et al. 51 evaluated the performance of
Ž .
a fused silica aperture thermospray FSApT with axial viewing. The %R.S.D.s for FSApT were similar to pneumatic sample introduction levels, and 10-fold LOD improvements were reported when a narrow torch central injector was
Ž
employed see additional discussion in Section .
4.1 .
2.2. Plasma]spectrometer interface
( )
I.B. Brenner, A.T. ZanderrSpectrochimica Acta Part B: Atomic Spectroscopy 55 2000 1195]1240 1200
Ž
Fig. 2. Schematic axially viewed ICP configuration in the Perkin Elmer Optima 3000, showing the 908‘shear gas’ configuration with
.
courtesy, Perkin Elmer, Bodensee Werke, Germany .
range to )190 nm. Typical shear gas
configura-tions are illustrated in Figs. 2 and 3. It is evident that two types of configuration are applied-cross flow and end-on.
w x
De Loos-Vollebregt et al. 4,16 evaluated an axially viewed ICP formed in a low-flow water-cooled torch. The plasma discharge was almost spherical, and the tail flame was deflected
Fig. 3. Schematic illustration of the Spectro EOP axially
Ž
viewed ICP configuration Spectro EOP brochure, with
cour-. Ž cour-. Ž .
tesy, Spectro, Kleve, Germany . 1 Spectrometer optics, 2
Ž . Ž . Ž .
water-cooled plasma interface, 3 argon supply, 4 plume, 5
Ž . Ž .
analytical zone, 6 RF coil, 7 plasma torch.
upwards although a 908 shear gas flow was not employed. Of interest is that these workers reported reduced matrix effects and a linear range of operation that was similar to those of radially viewed ICPs. It seems that these favorable char-acteristics were due to the deflection of the cold plasma fringe. In commercially available instru-ments, the prevalent shear gas configuration is 908. This is the most obvious approach to imple-ment. In both configurations, the mechanism is computer driven for accuracy, the optics are designed to maintain a long depth of focus, and the optimum plasma volume is selected so that
Ž
the SBR is maximum. Mermet noted personal .
communication that there is a problem of focus-ing a circular image onto a rectangular slit. In the
TM Ž .
IRIS Thermo Optek a circular entrance slit was employed with the axially viewed systems.
w x
Nakamura et al. 39 employed a water-cooled Cu metal cone positioned between the ICP and the focal lens.
2.2.1. Cross-flow shear gas
In the cross-flow configuration, the outer fringe of the plasma is diverted from the optical path by a flow of air, N or Ar. Visual inspection of this2 configuration shows that the plasma is deformed
Ž .
( )
I.B. Brenner, A.T. ZanderrSpectrochimica Acta Part B: Atomic Spectroscopy 55 2000 1195]1240 1201
excluded. The cross-flow configuration was
w x
employed by Fuxing et al. 17,18 with a quartz prism optical emission spectrograph. The cross flow configuration is employed in the Perkin Elmer, Jobin Yvon, TJA Solutions and Leeman axially viewed ICPs.
2.2.2. End-on gas flow
w x
Houk and co-workers 24]27 , first described end-on purging of the plasma]spectrometer re-gion, the optical probe and the plasma itself. Helium was used to purge the spectrometer and the Cu-metal optical probe that was immersed in the ICP. These investigators used this configura-tion to determine the halide elements and other
Ž analytes using sensitive VUV spectral lines see
.
Section 2.2.4 . In the commercial versions, the cool plasma fringe, directed to the spectrometer, is stripped away symmetrically from the optical path by an argon or nitrogen sheath gas that flows end-on through a water-cooled interface. This purging leaves the central axial channel isolated from the interfering plasma sheath. In commer-cial instruments, it is called the cooled cone
inter-Ž . Ž .
face CCI Varian and the optical plasma
Ž . Ž . w x
interface OPI Spectro . Nakamura et al. 39 employed an end-on Ar shear gas flow that was introduced into the cone and which passed
Ž .
through a nozzle 6 mm i.d. . This protected the spectrometer optics from the high temperature plasma and prevented salt deposition on the en-trance optics. In the end-on configuration, the various zones of the plasma as described by
Koir-w x
tyohann 53 , are not deformed. This is in contrast to cross-flow gas configurations where plasma
de-Ž formation can be distinctly observed. Perkin
.
Elmer Optima, TJA Solutions: Iris . In all commercial instruments, the depth of focus mostly
Ž .
includes the normal analytical zone NAZ as w x
defined by Koirtyohann 53 .
Although the end-on configuration would ap-pear to be more favorable due to the stripping of the cool plasma fringe, a critical examination using an identical detector and optimum operat-ing conditions has not been made. Such an evalu-ation would clarify the question of whether inter-ference effects are related to the mode of diver-sion of the cool plasma fringe.
2.2.3. Skimmer
w x
Montaser and Fassel 23 located a copper metal skimmer below the analytical observation zone to isolate the axial channel of the ICP and to deflect the outer cool fringe. They observed that SBRs and LODs of 10 atom lines having various excita-tion energies were 5]20 times superior to those obtained using a conventional configuration.
2.2.4. Direct coupling
w x
Houk at al 24]27 described the investigations of VUV emission from an ICP using a unique direct plasma]spectrometer coupling interface for axial viewing. A water-cooled Cu-metal cone with a circular sampling orifice was mounted in front of the entrance slit of a He-purged
monochroma-Ž
tor. He was selected because it is transparent to .
-58 nm. This optical sampler was immersed
into the axial channel of the plasma. A He-coun-ter purge gas flowed through the orifice into the
Ž .
plasma forming a well-defined plume Fig. 4 . This gas flow cooled the orifice, deflected the absorbing fringe of the plasma and prevented salt deposition on the cone tip. The grounding of the torch coils was reversed in order to alleviate arcing from the load coil to the sampler. With the
Ž .
use of a solar blind photomultiplier tube PMT , Ar resonance lines at 104.82 and 106.87 nm and O lines at 104.09 and 104.17 nm were evident. An optical mask restricted the illuminated slit for improved spatial resolution. Ray tracing indicated that the intensities observed were representative of the axial channel.
2.2.5. Secondary ‘ pinch’ discharges
When the axial channel of the ICP is extracted into a small vacuum chamber, a secondary dis-charge can be generated at an orifice in a
water-w x
cooled Cu-metal cone 8,29 . The diameter of the sampling cone was larger than its length to facili-tate cooling and to diminish cone orifice erosion by the discharge. In early ICP-mass spectrometry ŽMS this secondary discharge caused orifice ero-. sion and production of so-called ‘orifice ions’
w x
( )
I.B. Brenner, A.T. ZanderrSpectrochimica Acta Part B: Atomic Spectroscopy 55 2000 1195]1240 1202
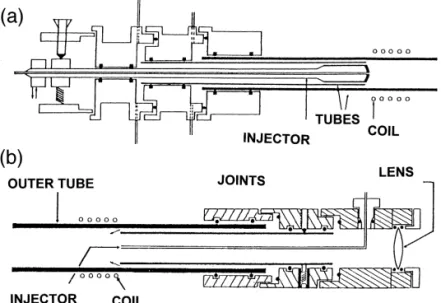
Fig. 4. Schematic reproduction of the direct end-on plasma]spectrometer interface. The water-cooled Cu-metal cone with its sampling orifice is mounted directly on the entrance slit of the He-purged monochromator. Note that the optical sampler is immersed into the axial channel of the
Ž . Ž . Ž .
plasma. A ICP torch and coil, B Cu shield, C Cu cone
Ž . Ž . Ž .
with orifice, D optical mask, E entrance slit, L He gas,
ŽM end-on purge gas flowing into ICP, N radiation transmit-. Ž . Ž .
ted to grating, P outer plasma fringe. This type of interface
w x
was employed by Houk et al. 24]27 .
the discharge present, the red emission in the
Ž .
initial radiation zone IRZ due to Y I and Y O was present high up in the plasma. This demon-strated that there was insufficient energy in that region of the ICP to generate blue Y II emission. With the discharge, however, blue Y II replaced
w x
the red emission of the central axial region 8,29 . This simple experiment demonstrated that the discharge atomized and excited the Y species. The intensities of the ion lines were enhanced by approximately one order of magnitude, whereas the emission signals of low energy potential lines were suppressed.
2.2.6. The Mach disk region
w x
Houk and co-workers 32,33 described studies of the emission in the Mach disk region when the axial region of a 40-MHz ICP was extracted into a small quartz vacuum chamber through a small orifice in a water-cooled Cu plate. The emission was measured with a PE Optima 3000 spectro-meter with segmented charge-coupled device
de-Ž .
tector SCD . On the ICP side, the sampling cone
was shallow to facilitate the sampling of the axial channel. A quartz cylinder was used as the wall of the extraction chamber so that UV emission could be measured. The sampling orifice was positioned 15 mm above the top of the load coil. In the vacuum chamber, a dark ‘zone of silence’ was surrounded by a concentric shock wave called the ‘Mach disk’. Intensities in this region were lower than those observed in a conventional ICP by factors of 100]1000. It is clear that the analytical potential of this configuration is limited unless considerable intensity boosting can be achieved.
2.3. Detection
The radially viewed ICP is the most widely used mode of observation for atomic emission analysis w56]58 that until several years ago was per-x formed mainly with PMT-based polychromators and sequential spectrometers. In the former the sample throughput is high but multi-element cov-erage is relatively low, whereas in the latter, sam-ple throughput is relatively low, but spectral ver-satility is high. These shortcomings have been overcome by the advent of charge transfer devices ŽCTDs. w59]65 , which are used to detect radia-x tions dispersed by echelle grating spectrometers. These spectrometers possess the ability to moni-tor simultaneously a vast number of spectral lines and their spectral backgrounds.
There are several types of commercial CCT configurations used with axially viewed ICPs. The
TM Ž .
IRIS TJA Solutions, Franklin, MA, USA
Ž .
charge injection device CID , described by
Den-w x
ton et al. 59]61 , the Optima 3000 XL SCD
Ž .
spectrometer Perkin Elmer, Norwalk, USA w62,63 and Varian Vista 64,65 and the Spectrox w x
Ž .
CIROS Spectro, Kleve, Germany charge
cou-Ž .
pled CCD spectrometers. In CID and CCD de-vices, the detectors cover the entire spectral range, whereas in the SCD instrument, segmented arrays have on an average 3]4 primary analytical lines for each of the 72 elements. Perkin Elmer and TJA solutions also manufacture a dual view
ver-Ž .
( )
I.B. Brenner, A.T. ZanderrSpectrochimica Acta Part B: Atomic Spectroscopy 55 2000 1195]1240 1203
mirror. With the exception of the Spectro CIROS, these instruments are echelle based, whereas the in the CIROS the 22 linear CCD detector arrays are mounted on the Rowland Circle of the Paschen Runge double grating spectrometer.
In the Varian Vista spectrometer, the CCD chip consists of 70 908 pixels that are arranged to match exactly the two-dimensional image from
Ž .
the echelle optics. Almost the entire 96% spec-tral range of 167]785 nm is covered. A CaF2
cross-disperser provides efficient UV transmis-sion. In the Spectro CIROS, the sensitized CCD
Ž .
has access to the very low UV 120 nm allowing determination of the halogens and other non-metal elements.
w x
Nakamura and co-workers 39,45 studied the performance of an axially and a radially viewed ICP using a high-dispersion echelle spectrometer. A novel aspect of this instrument was the rapid and automated changeover between radial and axial viewing positions. The reciprocal linear dis-persion was 0.031, 0.078 and 0.12 nm mmy1 at 200, 500 and 800 nm, respectively. A quartz re-fractor plate modulated the wavelength sinu-soidally and second-derivative detection was ob-tained by a built-in lock-in amplifier.The system allowed for fine computer controlled adjustment of the plasma torch, both in the horizontal and in the vertical positions. The optimum region of observation was determined based on the maxi-mum signal-to-noise ratios for the analytes stud-ied. Simultaneous background correction was per-formed.
Axially viewed ICPs have been configured in several PMT-based systems. The Jobin Yvon
Ž
Panorama system Jobin Yvon-Horiba, Long-.
jumeau, France is a conventional 0.5-m Ar-filled Ž Paschen-Runge polychromator. The Ultima Jobin
.
Yvon-Horiba, Longjumeau, France is a high-res-olution 1-m sequential spectrometer. In Varian Liberty 220 and Series II sequential ICP atomic emission spectrometers, the dispersion system operates in any one of four grating orders of diffraction, and provides an average resolution of approximately 0.009 nm. The Varian Liberty 220
w x instrument was also used by Conver et al. 51 for the evaluation of a thermospray sample introduc-tion system. The Spectro Spectroflame-EOP
ŽEnd-On Plasma is a 0.75-m Ar-filled Paschen. w x Runge polychromator. Dahlquist et al. 46 and
w x
Thiel and Danzer 66 described an axially viewed echelle-based ICP spectrometer manufactured by
Ž
Fisons-called the Maxim no longer commercially .
available . This system used optical fiber light guides to transmit the emission to the conventio-nal PMT based spectrometer. PMT outputs were sequentially processed with the aid of a shutter.
w x
Oomori et al. 52 recently announced that Shi-madzu had developed an axially viewed
spec-Ž .
trometer ICP-7500 . The axial view is achieved by observing the vertical plasma using a mirror.
w x
Fuxing et al. 17,18 used a quartz prism optical emission spectrograph with a reciprocal linear dispersion varying from 0.35 to 11 nm mmy1 and a 27-MHz ICP.
w x
Houk et al. 24]27 used a He-purged monochromator and a direct end-on optical probe for the detection of the VUV spectral lines of the halides and other elements from an axially viewed ICP. A solar blind PMT was used to detect emis-sion down to 106 nm. A scintillation counter was employed for the detection of fluorine -100 nm.
Ž
Several commercial instruments Jobin Yvon, .
Spectro, TJA Solutions have the capability of Ž
determining the halogens in the VUV e.g. Cl I . 134.724, Br I 157.485, and I I 161.760 nm . The sensitive I 170.207 nm line can also be used by conventional spectrometers.
Interference effects in axially viewed ICPs have been studied using all types of spectrometers w34]38,40,42,45 . Ivaldi and Tyson 34 , Dubuissonx w x
w x w x
et al. 40,42 , Brenner et al. 37 and Todoli et al. w38 evaluated the Optima 3000 XL in DV mode.x
w x w x
Dubuisson et al. 35 and Brenner et al. 36 also compared interference effects of axially and radi-ally viewed ICPs.
3. ICP operating conditions
( )
I.B. Brenner, A.T. ZanderrSpectrochimica Acta Part B: Atomic Spectroscopy 55 2000 1195]1240 1204
y1.
min and a wide internal diameter of the torch
w x w x
injector. Dalhquist et al. 46 and Coleman 72 described a high electron number density axially viewed ICP. Two ICP torch configurations were compared using 27- and 40-MHz RF generators and low aerosol carrier velocities. They employed conventional figures of analytical performance such as background, net line intensities,
back-Ž .
ground equivalent concentrations BECs , LODs, short- and long-term precision and freedom from EIE and solute vaporization interferences. The analytes investigated included both low energy and high-energy spectral wavelengths of Li, Na, K, P, Al, Fe, As, Zn, Pb, Ni, Mn, Cr, Cu, B, Co, Cd, Ti, V, Mo, Sn and Sr, and line pairs for Al, Pb, Fe and Mn. BECs and LODs differed by factors up to 3 among the test configurations.
w x
Houk and co-workers 8,29 generated a sec-ondary discharge by extracting the axial channel of an ICP into a vacuum chamber via a water-cooled Cu sampler. The 27-MHz discharge was noticeably smaller and less intense than that pro-duced from a 40-MHz plasma. Nakamura et al. w39,45 evaluated an axially viewed ICP using ax high-resolution echelle spectrometer and com-promise operating conditions owing to different spectral responses of the analyte lines.
4. Sample introduction
4.1. Liquids
Both conventional and unconventional modes of liquid sample introduction have been used with
w x
axially viewed ICPs. Fuxing et al. 17,18 , used a specially designed high salt ‘bell-mouth’ pneu-matic concentric nebulizer and a thermal desolva-tion system consisting of a heated spray chamber to determine trace elements in NaCl brines. No salt deposition occurred at the nebulizer orifice due to the optimum design of the bell-mouth extension.
A conventional glass concentric nebulizer was employed for the comparison of axially and
radi-w x
ally viewed ICPs by Brenner et al. 36 . In that Ž
study, a glass cyclone spray chamber Glass Ex-.
pansion, Australia was employed in the axial
view study, while in the radial configuration, a Sturman-Masters vertical cyclonic spray chamber was used. The advantage of the glass cyclone spray chamber is the small void volume of approx-imately 50 ml, and as a result, rapid washout.
w x w x
Ivaldi and Tyson 34 and Brenner et al. 37 used
Ž .
a PE Ryton cross-flow Gem Tip nebulizer CFN and a PE Ryton spray chamber. Dahlquist et al. w46 used a Meinhard K Santa Ana, CA and anx Ž .
Ž .
ARL Ecublens, Switzerland maximum dissolved
Ž .
solids V-groove nebulizer MSDN and observed that the precision varied from -0.2 to 0.5%, respectively.
w x w x
Ivaldi and Tyson 34 and Brenner et al. 36,37 determined the LODs and the influence of high Na and Ca concentrations in axially viewed ICPs
Ž
using an USN and desolvation Cetac Technolo-.
gies, Omaha, NE . The desolvated aerosol was coupled directly to the base of the torch. The desolvation temperature was 1408C and the chiller was set at 0]28C.
w x
Dubuisson et al. 48 employed robust plasma conditions to minimize Na interference effects in the plasma and then to evaluate the role of the sample introduction system. They used a Perkin Elmer Conespray nebulizer with a cyclone spray chamber and a cross-flow nebulizer with a double pass spray chamber. The latter system was more sensitive to Na, finer droplets being obtained at the spray chamber exit when Na was present.
w x
De Loos-Vollebregt et al. 4 used thermospray sample introduction and observed that LODs were enhanced fourfold relative to those obtained us-ing a conventional pneumatic nebulizer. Conver
w x
et al. 51 , used an axially viewed sequential ICP
Ž .
spectrometer Varian Liberty to evaluate the performance of a FSApT sample introduction sys-tem. These authors anticipated that the improved LODs would be further enhanced as a result of the increased sample transport. However, when FSApT was used with a standard axial torch
hav-Ž .
con-( )
I.B. Brenner, A.T. ZanderrSpectrochimica Acta Part B: Atomic Spectroscopy 55 2000 1195]1240 1205
cluded that high-performance FSApt might be incompatible with axially viewed ICPs.
4.2. Gases
Ž . w x
A direct injection probe DIP 26 was em-ployed to analyze a gaseous mixture of Cl, Br, C and S compounds using a direct couple optical probe consisting of a He-purged water-cooled Cu-cone. The orifice of this cone, 3 mm in diame-ter, was immersed in the ICP. This interface facilitated the determination of elements using VUV spectral lines which otherwise would have been totally attenuated by absorption by atmo-spheric oxygen and by the optical components in the optical transfer system. Samples were
intro-Ž .
duced using flow injection FIA .
5. Fundamental aspects
From a fundamental point of view, the axially viewed ICP does not differ from the radial con-figuration. There are, however, several points to be considered relative to the direction of viewing applied. In general, the ICP is sheathed by
Ž boundary layers that are substantially cooler
ap-.
prox. 2400 K than the plasma core and axial
Ž .
column 8000]1000 K . The energy in the hot plasma core rapidly diffuses outward by thermal conduction, electrons and ions migrating to the cooler peripheral region by ambipolar diffusion w73]75 . As a result of these processes, the ICPx decays with increasing rapidity with increasing height above the load coil. If the electron number
Ž .
density ne , is the local thermal equilibrium ŽLTE value as determined by the Saha equation,. then at 20 mm above the load coil, the value will be considerably degraded relative to that of the
w x
NAZ. Montaser and Fassel 23 located a copper metal skimmer below the analytical observation zone to isolate the axial channel of the ICP and to deflect the outer cool fringe. The electron density was approximately 8.5=1013 cmy3 com-pared to 4=1014]1.4=1015 cmy3 for a conven-tional ICP.
In the axially viewed ICP, the outer fringe of the ICP can strongly absorb the emission of
w x
atomic resonance lines 76 . Absorption profiles from these boundary regions indicate that the ratio of absorption to emitting populations is 109-fold larger than in the IRZ and NAZ. This fact should be taken into account in the determi-nation of the plasma temperature by the ion-to-atom line intensity ratio method. Otherwise, the values can be significantly biased by boundary layer absorption if one of the spectral lines is a resonance line and the results will be skewed toward erroneously high Saha temperatures. Con-sequently, from the analytical aspect, when view-ing the plasma in the axial end-on direction it is important that the cool plasma fringe be excluded.
6. Diagnostics — the Mg II 280.270 nmrrrrrMg I 285.213 nm ratio
In many of the studies comparing EIEs, Ca and acid interference effects in axially and radially viewed ICPs, the Mg II 280.270 nmrMg I 285.213 nm intensity ratio has been used as a practical criterion for plasma robustnessand analytical
per-w x
formance. Mermet 43,49,50 coined the term robustness to collectively express energy transfer, residence time, and response of the plasma to changes in atomization and excitation conditions and chemical composition of the aspirated solu-tion. The ratio is related to ne by the Saha] Egg-ert equation, assuming LTE, and to ionization w x and excitation temperatures. Mermet 50 determined Mg II 280.270 nmrMg I 285.213 nm intensity ratios in radially viewed plasmas pro-duced in torches with different central injector diameters. He concluded that the Mg IIrMg I ratios approach LTE values at optimum energy transfer and residence times. Such conditions pre-vail when the internal diameter of the central
Ž
torch injector exceeds 2 mm gas velocity .
decreases , when the aerosol carrier flow rate is approximately 0.5]0.7 l miny1, and the forward
w x
power is high 35]37,44,49,50,67]71 . With other less favorable conditions, the Mg IIrMg I ratios
w x
are significantly lower 34,37 .
sys-( )
I.B. Brenner, A.T. ZanderrSpectrochimica Acta Part B: Atomic Spectroscopy 55 2000 1195]1240 1206
Ž
tems Meinhard concentric, CFN, modified Lichte, .
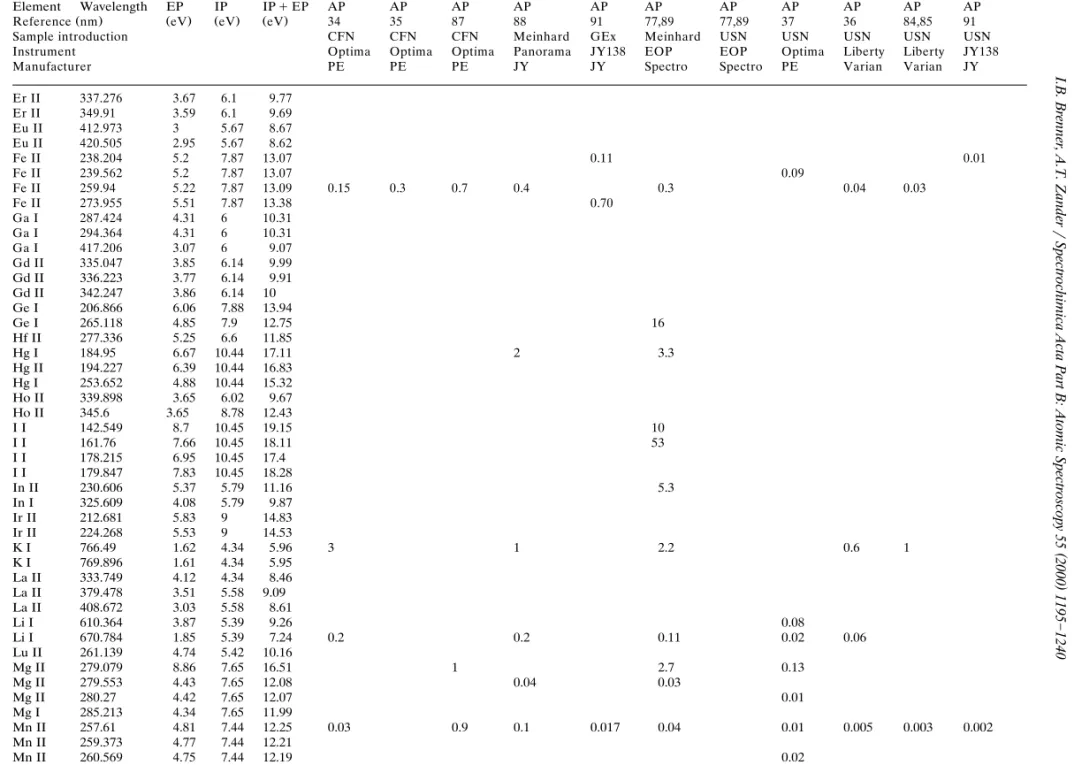
USN , and excitation systems is presented in Table
w x
1 34,36,37,40,41,44,77,79 . Original Optima 3000 XL intensity data were multiplied by 1.86 due to differences in echelle spectrometer sensitivity
w x
between the two Mg lines 34,80 .
The data listed in Table 1 indicate that the ratios for axially viewed ICPs are lower than those obtained with radially viewed plasmas. The available data indicate that under similar
condi-Ž y1.
tions of aerosol flow rate 0.7]0.8 l min , the
ratios for the Varian Liberty, the TJA Solutions IRIS, Spectro and Jobin Yvon systems for pure water were higher than those observed for the Perkin Elmer Optima 3000 XL configuration. In the first group of instruments, ratios varied from approximately 10 at 1 kW to 13 at 1.5 kW, whereas in the latter system, the ratios varied from 7 at 1 kW to 9 at 1.35 kW.
w x
Brenner et al. 36,37,44 measured the Mg IIrMg I ratio using a conventional concentric
Ž
pneumatic nebulizer and a USN Cetac
Tech-Table 1
Compilation of Mg II 280.270 nmrMg I 285.213 nm ratios for various axially and radially viewed ICPs using conventional a
Ž .
nebulization Meinhard, cross-flow and modified Lichte and USN, using various RF powers and sample composition
Instrument Solution Liberty Optima IRIS Liberty Optima Optima Optima EOP EOP
Reference 36 34 79 36 37 34 40 77 89
Ž .
Power kW Radial Radial Radial Axial Axial Axial Axial Axial Axial
Con¨entional nebulization
0.75 Water 6.5
0.9]1 Water 10.5 5.2 9.5 10 7.1 5.9 8.5 6.2
1.1]1.15 Water 10.3 7.9
1.2]1.25 Water 11.4 9 9.1 9.5
1.3]1.35 Water 12.7 9.1 9.9 10.3
1.4]1.5 Water 12 7.3 11.9 9.7 5.9 10.5 11
0.9 10% acetic acid 9.8
1.2 10% acetic acid 10.3
1.5 10% acetic acid 12.2
1 Na 0.1% 10.5 7 5.6
1 Ca 0.1% 10.1 7 5.8
1 NaCl 5% 6]7 6]7
0.95 NaCl 10% 3.6 2
1.35 Na 0.1% 7.4
1.35 Ca 0.1% 7.6
1.5 Na 0.1% 8
1.5 Ca 0.1% 8.1
USN
1 Water 5.3
1.2 Water 7.1
1.35 Water 7.5 7 7.5
1 Na 0.1% 7 5.5 2.7
1 Ca 0.1% 2.2
1.35]1.4 Na 0.1% 8 7 4.1
K
1.35 Na 0.1%
1.35 Ca 0.1% 3.5
a w x
( )
I.B. Brenner, A.T. ZanderrSpectrochimica Acta Part B: Atomic Spectroscopy 55 2000 1195]1240 1207
.
nologies in aqueous solutions at forward powers of 1 and 1.35 kW using 2- and 2.3-mm central torch injectors. Mg IIrMg I ratios increased with decreasing aerosol flow rate and increasing RF
w x
power 36 . In a desolvated plasma the Mg IIrMg I ratio was lower than that of an ICP containing
Ž
water approx. 11 vs. 7 in the Varian system and 7 . and 5 in the Perkin Elmer Optima system . In desolvated plasmas, the excitation temperatures are lower than in a plasma containing water. Dissociation of moderate amount of water in the plasma results in the formation of hydrogen and as a result an increase of the excitation
tempera-w x
ture in the central channel 7,70,81 . w x
Ivaldi and Tyson 34 determined the Mg IIrMg I ratio in a pure aqueous solution and in 10% NaCl. For their radially and axially viewed ICPs, they reported significantly lower ratios of 5 and 6 for a RF power of 0.95 kW for an aqueous solution, which increased to 7.3 and 6 at 1.45 kW and an aerosol flow rate of 0.6 l miny1, respec-tively. In the presence of 10% NaCl, the ratio was suppressed by up to a factor of 2. In comparison to the axial and radial configurations obtained with other systems, the setup employed by Ivaldi
w x
and Tyson 34 appears to have been less robust.
w x
Brenner et al. 36,37 measured the Mg IIrMg I ratios for 0.1% Na and 0.1% Ca using
conven-Ž . Ž
tional concentric Meinhard and CFN Perkin
. Ž .
Elmer nebulizers and a USN Cetac . Varian Liberty sequential and Perkin Elmer 3000 XL SCD spectrometers were used, employing 2.3-and 2-mm-diameter central torch injectors. Two RF power levels were applied} 1 and 1.35 kW. With the concentric and the CFN for 1 kW, ratios w x were approximately 7 for the Varian system 36
w x and approximately 6 for the Perkin Elmer 37 . In the presence of 0.1% Na the ratio was 5 for a CFN and only 2.7 for an USN at 1 kW. With the 0.1% Ca solution, the ratio was approximately 6 for the CFN and only 2 for the USN. These ratios increased when the RF power increased to 1.35 kW} 7.5 and 3.5, respectively. In general, these low ratios indicate that the plasma observation zone was less robust. In contrast, USN ratios using the Varian system were slightly higher }
5.5 at 1 kW and 7 at 1.35 kW. In the Spectro EOP, the Mg IIrMg I ratio was 9.5 using 1.2 kW
and an aerosol flow rate of 0.9 l miny1. At 1.4 w x
kW, it was 11. Brenner et al. 44 measured the Mg IIrMg I intensity ratio for solutions contain-ing 0.5% Ca and 0.5% Na. In the axially viewed ICP the ratio was 10.5 for pure water and for 0.5% Na. The ratio was 8 for 0.5% Ca. These values indicate that the ICP was robust even in the presence of high Na and Ca concentrations.
As mentioned previously, both radially and axi-ally viewed Mg IIrMg I ratios vary with the diameter of the central injector of the torch. The
w x
values quoted by Ivaldi and Tyson 34 using a narrow-bore central torch injector were signifi-cantly lower than those listed by Brenner et al. w36,37,44 , Dubuisson et al. 40 and Romero et al.x w x w69 using similar instrumental and torch configu-x
Ž .
rations but wider bore torch injectors )2 mm . Evidently, the diameter of the central torch injec-tor has a large influence. According to Cooper w78 , the Mg IIrMg I ratio increased from 6.5 atx 0.75 kW to 12.7 at 1.35 kW for pure water. The ratios for the Spectro EOP system varied from
Ž approximately 6 at 1 kW to 10 at 1.3 kW in both cases the diameter of the central injector was not
. stated .
w x
Dubuisson et al. 40 used the Mg IIrMg I intensity ratio to compare axially and radially viewed ICPs with 10% acetic acid. Ratios in-creased with increasing power from approxi-mately 10 and 8.5 at 0.9 kW to approxiapproxi-mately 12 and 10.5 at 1.5 kW and an argon aerosol flow rate of 0.5 l miny1. The ratio decreased to 2 at 1 l miny1 gas flow rate for acetic acid. The ratios for the acid were higher than those for pure water. They concluded that under robust plasma condi-tions, interferences in axial and radial configura-tions were of similar magnitude and that aerosol formation and transport processes were responsi-ble for the observed variations. In the case of acetic acid, the increase of the Mg IIrMg I ratio was due to the relative increase in the Mg II signal attributed to the increase in ionization caused by an increase in temperature.
w x
Todoli et al. 82 studied interference effects of HNO and H SO using several types of nebuliz-3 2 4
Ž . Ž .
( )
I.B. Brenner, A.T. ZanderrSpectrochimica Acta Part B: Atomic Spectroscopy 55 2000 1195]1240 1208
phenomena, claiming that plasma effects were insignificant. However, the low Mg IIrMg I ratios of approximately 6.4]6.8 at 1.2 kW indicate that a non-robust plasma prevailed. Thus, RF power is an important parameter and an increase results in the reduction of matrix effects but at the e x p e n s e o f th e L O D s , w h ic h a r e degraded by factors of 2]6 due to the increase in background intensity.
7. Limits of detection and SBR
7.1. Con¨entional sample introduction
w x
Nakamura et al. 39,45 determined the LODs in radially and axially viewed ICPs. A 5]35-fold net intensity enhancement in the axially viewed ICP was observed. In comparison to the radially viewed ICP, LODs were improved 1.4]25-fold and varied from 0.17 to 540 and 0.018 to 35mg ly1, respectively, for the radial and axial
configu-w x rations, respectively. Dahlquist et al. 46 , de-termined the LODs for Li, Na, K, P, Al, Fe, As, Zn, Pb, Ni, Mn, Cr, Cu, B, Co, Cd, Ti, V, Mo, Sn and Sr. Although the background for their axially viewed ICP was larger than that for radial view-ing, net intensities were 6]13 times greater.
w x
Montaser and Fassel 23 observed that SBRs and LODs of 10 atom lines having various excita-tion energies were 5]20 times superior to those obtained using a conventional configuration. The
Ž .
observation height 10]30 mm did not have a great influence on the SBRs, which varied by up to a factor of 3.
w x
Duffy and Thomas 83 determined B, P and S in low alloy steels using an Optima DV SCD spectrometer. The LODs for these elements were improved by factors of 5]10 in comparison to radially viewed ICPs. Recently, Dubuisson et al. w35 compared the SBRs of ion spectral lines ofx several commercially available axially and radially viewed ICP-AES systems. They observed that both analyte and background signals were higher for axial viewing, but SBRs were higher owing to the larger increase of signal relative to the back-ground. They showed that up to threefold im-provements could be obtained for axial viewing.
However, these authors also noted a decrease in the dynamic range and an increase in
interfer-w x
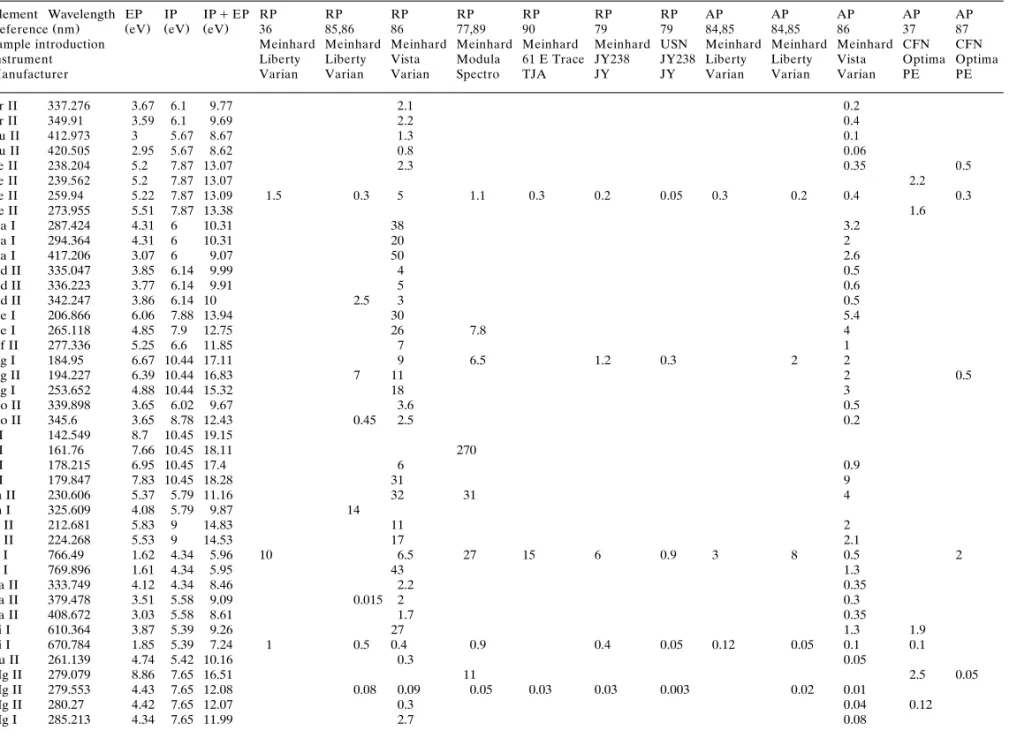
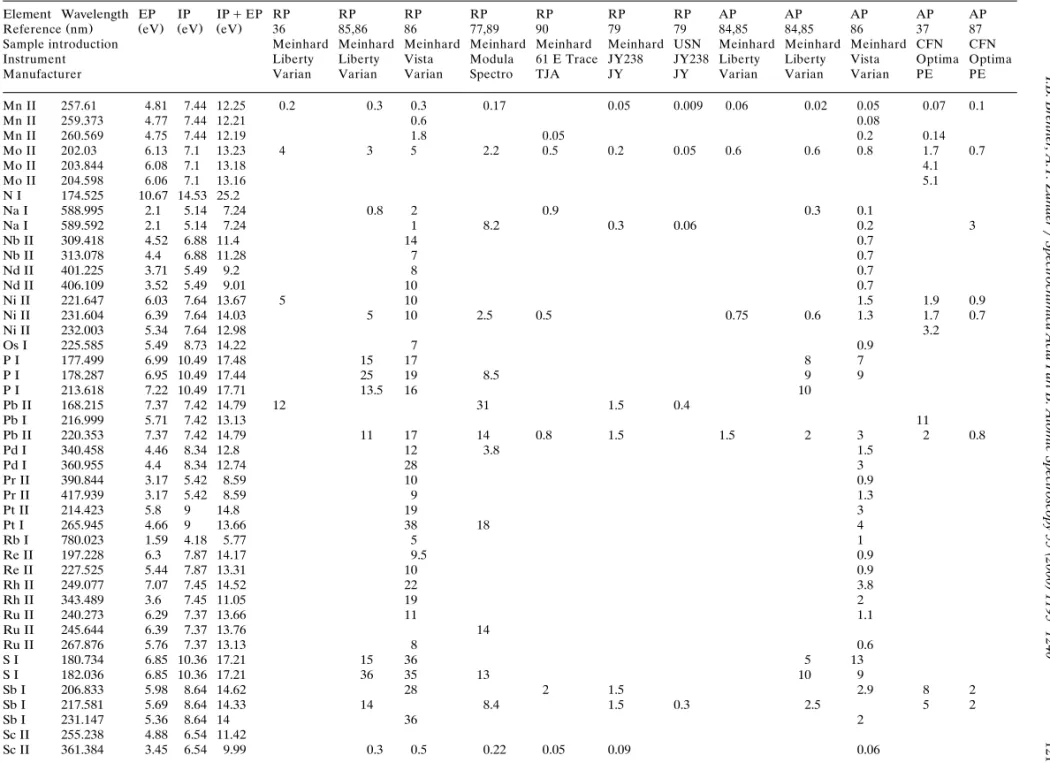
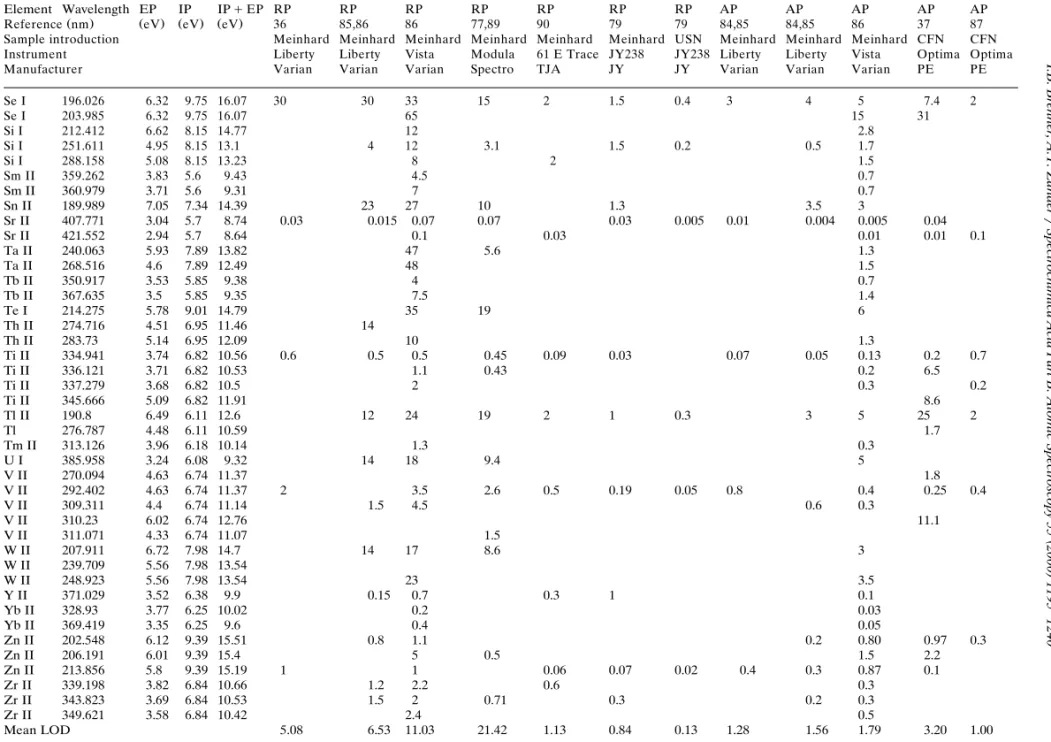
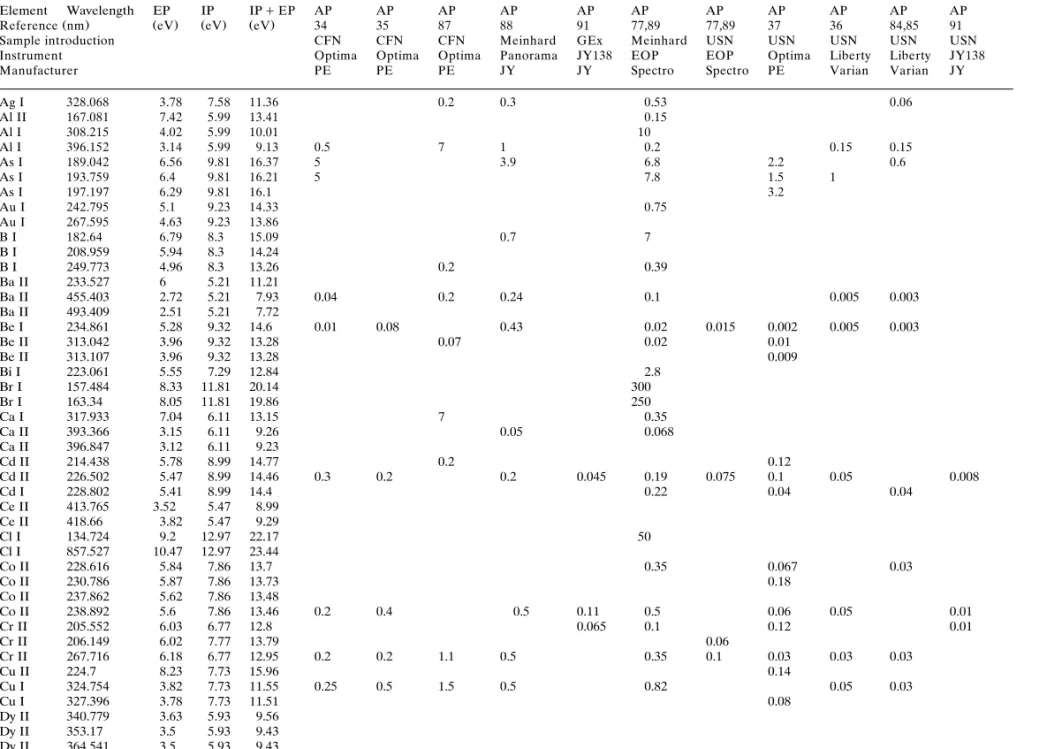
ence effects. Nakamura et al. 39,45 determined the LODs of 24 elements using conventional and extended torches. LODs for the latter were im-proved by 50% for Be and up to sevenfold for Al. A compilation of LODs obtained by axial and radial viewing using conventional nebulization and USN and various spectrometers is presented in Table 2. These data are reproduced from recent
w x
publications 34]37 , manufacturer’s brochures, information lists and written communications w64,77]79,84]91 . Ivaldi and Tysonx w34x de-termined LODs using the Perkin Elmer Optima
w x XL SCD spectrometer. Dubuisson et al. 35 and
w x Ž .
Brenner et al. 36,37 listed LODs 3s for a wide range of spectral lines varying in energy
poten-w x
tials, using Varian Liberty Series II 36 sequen-w x tial and Perkin Elmer SCD multichannel 37 spectrometers using conventional pneumatic and USN.
Relative to radially viewed ICPs, mean detec-tion limit improvement factors for axial configu-rations using conventional nebulization varied from approximately 2 to 20. LODs determined
w x using the Perkin Elmer SCD system 37 were similar to the axially viewed values published by
w x
Brenner et al. 36 using a sequential ICP
spec-Ž .
trometer Varian, Liberty . In the presence of 5% NaCl, LODs were degraded approximately by a
w x
factor of 5 36 . In the presence of 0.1% Na and 0.1% Ca, LODs were degraded by approximately one order of magnitude relative to those of an
w x
aqueous solution 37 . In general, LODs of Se, As and Tl were improved when the forward power increased from 1 to 1.35 kW.
It is of interest to note that radially viewed ICP LODs obtained with an optimized photon tran-smission sequential spectrometer with an
op-Ž . Ž
timized detection system high SrN 1 m Jobin .
Yvon Ultima and a concentric nebulizer are
Ž .
within the range of axially viewed ICPs Table 2 . LODs, recently determined by Dubuisson et al. w91 , using an axially viewed ICP and a similarx
Ž .
sequential spectrometer JY238 were improved Ž
by up to one order of magnitude RF power 1 y1.
()
I.B.
Brenner,
A.T.
Zander
r
Spectrochimica
Acta
Part
B:
Atomic
Spectroscopy
55
2000
1195
]
1240
1209
Table 2
y1 a
Ž .
Compilation of LODs 3s,mg l for axially viewed ICPs in aqueous solution using conventional and ultrasonic nebulization
Element Wavelength EP IP IPqEP RP RP RP RP RP RP RP AP AP AP AP AP
Ž . Ž . Ž . Ž .
Reference nm eV eV eV 36 85,86 86 77,89 90 79 79 84,85 84,85 86 37 87 Sample introduction Meinhard Meinhard Meinhard Meinhard Meinhard Meinhard USN Meinhard Meinhard Meinhard CFN CFN Instrument Liberty Liberty Vista Modula 61 E Trace JY238 JY238 Liberty Liberty Vista Optima Optima Manufacturer Varian Varian Varian Spectro TJA JY JY Varian Varian Varian PE PE
Ag I 328.068 3.78 7.58 11.36 5 2 2 1.9 0.5 0.6 0.08 0.7 0.5 0.4
Al II 167.081 7.42 5.99 13.41 1 0.35 0.5
Al I 308.215 4.02 5.99 10.01 10 4.7 4
Al I 396.152 3.14 5.99 9.13 3 6 0.2 0.02 1 0.7 1.5 2
As I 189.042 6.56 9.81 16.37 12 9 22 11 2 0.8 0.2 10 6 5 8.2 2
As I 193.759 6.4 9.81 16.21 10 20 2 4 5 6.1 5
As I 197.197 6.29 9.81 16.1 63 16 23
Au I 242.795 5.1 9.23 14.33 4 7 3.7 0.6 0.6 0.4 1.4
Au I 267.595 4.63 9.23 13.86 4 9 1.4
B I 182.64 6.79 8.3 15.09 4.5 1 2.7 0.3 0.03 4 0.3
B I 208.959 5.94 8.3 14.24 2.1 0.7
B I 249.773 4.96 8.3 13.26 1 0.3 1.4 0.8 0.4 0.07 0.5
Ba II 233.527 6 5.21 11.21 1.1 0.2
Ba II 455.403 2.72 5.21 7.93 0.1 0.06 0.3 0.2 0.05 0.004 0.01 0.01 0.04 0.07
Ba II 493.409 2.51 5.21 7.72 0.3 0.06 0.05
Be I 234.861 5.28 9.32 14.6 0.15 0.15 0.3 0.06 0.06 0.05 0.004 0.05 0.05 0.05 0.09
Be II 313.042 3.96 9.32 13.28 0.05 0.06 0.3 0.17 0.08
Be II 313.107 3.96 9.32 13.28 0.12
Bi I 223.061 5.55 7.29 12.84 9 18 15 2 2.6 0.8 3 2
Br I 157.484 8.33 11.81 20.14 580
Br I 163.34 8.05 11.81 19.86
Ca I 317.933 7.04 6.11 13.15 4 2.5 1.7 1 2
Ca II 393.366 3.15 6.11 9.26 0.03 0.08 0.07 0.03 0.003 0.005 0.01
Ca II 396.847 3.12 6.11 9.23 0.07 0.03 0.01
Cd II 214.438 5.78 8.99 14.77 1.5 0.06 0.02 0.3 0.97 0.3
Cd II 226.502 5.47 8.99 14.46 2 1.2 0.59 0.09 0.15 0.3 1 0.2
Cd I 228.802 5.41 8.99 14.4 1.2 0.85 0.09 0.3 0.92 0.3
Ce II 413.765 3.52 5.47 8.99 6 26 2.2
Ce II 418.66 3.82 5.47 9.29 11 2
Cl I 134.724 9.2 12.97 22.17 50
Cl I 857.527 10.47 12.97 23.44 20 000 5000
Co II 228.616 5.84 7.86 13.7 4 3.5 2.2 0.5 0.3 0.8 1.3 0.5
Co II 230.786 5.87 7.86 13.73 2.5
Co II 237.862 5.62 7.86 13.48 4.5 0.7
Co II 238.892 5.6 7.86 13.46 4 4.5 0.21 0.04 0.25 0.5 0.95 0.4
Cr II 205.552 6.03 6.77 12.8 4 1.5 0.7 1.1 0.4
Cr II 206.149 6.02 7.77 13.79 1.4 1.2 0.6
Cr II 267.716 6.18 6.77 12.95 4 3 2 1.5 0.4 0.15 0.04 0.2 0.3 0.5 0.3 0.2
Cu II 224.7 8.23 7.73 15.96 0.4
Cu I 324.754 3.82 7.73 11.55 2 1.5 1.8 1.1 0.3 0.1 0.03 0.6 0.5 0.3 0.5
Cu I 327.396 3.78 7.73 11.51 2 0.6 1.8 0.2
Dy II 340.779 3.63 5.93 9.56 5 0.6
Dy II 353.17 3.5 5.93 9.43 2 0.3
()
I.B.
Brenner,
A.T.
Zander
r
Spectrochimica
Acta
Part
B:
Atomic
Spectroscopy
55
2000
1195
]
1240
1210
Ž .
Table 2 Continued
Element Wavelength EP IP IPqEP RP RP RP RP RP RP RP AP AP AP AP AP
Ž . Ž . Ž . Ž .
Reference nm eV eV eV 36 85,86 86 77,89 90 79 79 84,85 84,85 86 37 87 Sample introduction Meinhard Meinhard Meinhard Meinhard Meinhard Meinhard USN Meinhard Meinhard Meinhard CFN CFN Instrument Liberty Liberty Vista Modula 61 E Trace JY238 JY238 Liberty Liberty Vista Optima Optima Manufacturer Varian Varian Varian Spectro TJA JY JY Varian Varian Varian PE PE
Er II 337.276 3.67 6.1 9.77 2.1 0.2
Er II 349.91 3.59 6.1 9.69 2.2 0.4
Eu II 412.973 3 5.67 8.67 1.3 0.1
Eu II 420.505 2.95 5.67 8.62 0.8 0.06
Fe II 238.204 5.2 7.87 13.07 2.3 0.35 0.5
Fe II 239.562 5.2 7.87 13.07 2.2
Fe II 259.94 5.22 7.87 13.09 1.5 0.3 5 1.1 0.3 0.2 0.05 0.3 0.2 0.4 0.3
Fe II 273.955 5.51 7.87 13.38 1.6
Ga I 287.424 4.31 6 10.31 38 3.2
Ga I 294.364 4.31 6 10.31 20 2
Ga I 417.206 3.07 6 9.07 50 2.6
Gd II 335.047 3.85 6.14 9.99 4 0.5
Gd II 336.223 3.77 6.14 9.91 5 0.6
Gd II 342.247 3.86 6.14 10 2.5 3 0.5
Ge I 206.866 6.06 7.88 13.94 30 5.4
Ge I 265.118 4.85 7.9 12.75 26 7.8 4
Hf II 277.336 5.25 6.6 11.85 7 1
Hg I 184.95 6.67 10.44 17.11 9 6.5 1.2 0.3 2 2
Hg II 194.227 6.39 10.44 16.83 7 11 2 0.5
Hg I 253.652 4.88 10.44 15.32 18 3
Ho II 339.898 3.65 6.02 9.67 3.6 0.5
Ho II 345.6 3.65 8.78 12.43 0.45 2.5 0.2
I I 142.549 8.7 10.45 19.15
I I 161.76 7.66 10.45 18.11 270
I I 178.215 6.95 10.45 17.4 6 0.9
I I 179.847 7.83 10.45 18.28 31 9
In II 230.606 5.37 5.79 11.16 32 31 4
In I 325.609 4.08 5.79 9.87 14
Ir II 212.681 5.83 9 14.83 11 2
Ir II 224.268 5.53 9 14.53 17 2.1
K I 766.49 1.62 4.34 5.96 10 6.5 27 15 6 0.9 3 8 0.5 2
K I 769.896 1.61 4.34 5.95 43 1.3
La II 333.749 4.12 4.34 8.46 2.2 0.35
La II 379.478 3.51 5.58 9.09 0.015 2 0.3
La II 408.672 3.03 5.58 8.61 1.7 0.35
Li I 610.364 3.87 5.39 9.26 27 1.3 1.9
Li I 670.784 1.85 5.39 7.24 1 0.5 0.4 0.9 0.4 0.05 0.12 0.05 0.1 0.1
Lu II 261.139 4.74 5.42 10.16 0.3 0.05
Mg II 279.079 8.86 7.65 16.51 11 2.5 0.05
Mg II 279.553 4.43 7.65 12.08 0.08 0.09 0.05 0.03 0.03 0.003 0.02 0.01
Mg II 280.27 4.42 7.65 12.07 0.3 0.04 0.12
()
I.B.
Brenner,
A.T.
Zander
r
Spectrochimica
Acta
Part
B:
Atomic
Spectroscopy
55
2000
1195
]
1240
1211
Ž .
Table 2 Continued
Element Wavelength EP IP IPqEP RP RP RP RP RP RP RP AP AP AP AP AP
Ž . Ž . Ž . Ž .
Reference nm eV eV eV 36 85,86 86 77,89 90 79 79 84,85 84,85 86 37 87 Sample introduction Meinhard Meinhard Meinhard Meinhard Meinhard Meinhard USN Meinhard Meinhard Meinhard CFN CFN Instrument Liberty Liberty Vista Modula 61 E Trace JY238 JY238 Liberty Liberty Vista Optima Optima Manufacturer Varian Varian Varian Spectro TJA JY JY Varian Varian Varian PE PE
Mn II 257.61 4.81 7.44 12.25 0.2 0.3 0.3 0.17 0.05 0.009 0.06 0.02 0.05 0.07 0.1
Mn II 259.373 4.77 7.44 12.21 0.6 0.08
Mn II 260.569 4.75 7.44 12.19 1.8 0.05 0.2 0.14
Mo II 202.03 6.13 7.1 13.23 4 3 5 2.2 0.5 0.2 0.05 0.6 0.6 0.8 1.7 0.7
Mo II 203.844 6.08 7.1 13.18 4.1
Mo II 204.598 6.06 7.1 13.16 5.1
N I 174.525 10.67 14.53 25.2
Na I 588.995 2.1 5.14 7.24 0.8 2 0.9 0.3 0.1
Na I 589.592 2.1 5.14 7.24 1 8.2 0.3 0.06 0.2 3
Nb II 309.418 4.52 6.88 11.4 14 0.7
Nb II 313.078 4.4 6.88 11.28 7 0.7
Nd II 401.225 3.71 5.49 9.2 8 0.7
Nd II 406.109 3.52 5.49 9.01 10 0.7
Ni II 221.647 6.03 7.64 13.67 5 10 1.5 1.9 0.9
Ni II 231.604 6.39 7.64 14.03 5 10 2.5 0.5 0.75 0.6 1.3 1.7 0.7
Ni II 232.003 5.34 7.64 12.98 3.2
Os I 225.585 5.49 8.73 14.22 7 0.9
P I 177.499 6.99 10.49 17.48 15 17 8 7
P I 178.287 6.95 10.49 17.44 25 19 8.5 9 9
P I 213.618 7.22 10.49 17.71 13.5 16 10
Pb II 168.215 7.37 7.42 14.79 12 31 1.5 0.4
Pb I 216.999 5.71 7.42 13.13 11
Pb II 220.353 7.37 7.42 14.79 11 17 14 0.8 1.5 1.5 2 3 2 0.8
Pd I 340.458 4.46 8.34 12.8 12 3.8 1.5
Pd I 360.955 4.4 8.34 12.74 28 3
Pr II 390.844 3.17 5.42 8.59 10 0.9
Pr II 417.939 3.17 5.42 8.59 9 1.3
Pt II 214.423 5.8 9 14.8 19 3
Pt I 265.945 4.66 9 13.66 38 18 4
Rb I 780.023 1.59 4.18 5.77 5 1
Re II 197.228 6.3 7.87 14.17 9.5 0.9
Re II 227.525 5.44 7.87 13.31 10 0.9
Rh II 249.077 7.07 7.45 14.52 22 3.8
Rh II 343.489 3.6 7.45 11.05 19 2
Ru II 240.273 6.29 7.37 13.66 11 1.1
Ru II 245.644 6.39 7.37 13.76 14
Ru II 267.876 5.76 7.37 13.13 8 0.6
S I 180.734 6.85 10.36 17.21 15 36 5 13
S I 182.036 6.85 10.36 17.21 36 35 13 10 9
Sb I 206.833 5.98 8.64 14.62 28 2 1.5 2.9 8 2
Sb I 217.581 5.69 8.64 14.33 14 8.4 1.5 0.3 2.5 5 2
Sb I 231.147 5.36 8.64 14 36 2
Sc II 255.238 4.88 6.54 11.42
()
I.B.
Brenner,
A.T.
Zander
r
Spectrochimica
Acta
Part
B:
Atomic
Spectroscopy
55
2000
1195
]
1240
1212
Ž .
Table 2 Continued
Element Wavelength EP IP IPqEP RP RP RP RP RP RP RP AP AP AP AP AP
Ž . Ž . Ž . Ž .
Reference nm eV eV eV 36 85,86 86 77,89 90 79 79 84,85 84,85 86 37 87 Sample introduction Meinhard Meinhard Meinhard Meinhard Meinhard Meinhard USN Meinhard Meinhard Meinhard CFN CFN Instrument Liberty Liberty Vista Modula 61 E Trace JY238 JY238 Liberty Liberty Vista Optima Optima Manufacturer Varian Varian Varian Spectro TJA JY JY Varian Varian Varian PE PE
Se I 196.026 6.32 9.75 16.07 30 30 33 15 2 1.5 0.4 3 4 5 7.4 2
Se I 203.985 6.32 9.75 16.07 65 15 31
Si I 212.412 6.62 8.15 14.77 12 2.8
Si I 251.611 4.95 8.15 13.1 4 12 3.1 1.5 0.2 0.5 1.7
Si I 288.158 5.08 8.15 13.23 8 2 1.5
Sm II 359.262 3.83 5.6 9.43 4.5 0.7
Sm II 360.979 3.71 5.6 9.31 7 0.7
Sn II 189.989 7.05 7.34 14.39 23 27 10 1.3 3.5 3
Sr II 407.771 3.04 5.7 8.74 0.03 0.015 0.07 0.07 0.03 0.005 0.01 0.004 0.005 0.04
Sr II 421.552 2.94 5.7 8.64 0.1 0.03 0.01 0.01 0.1
Ta II 240.063 5.93 7.89 13.82 47 5.6 1.3
Ta II 268.516 4.6 7.89 12.49 48 1.5
Tb II 350.917 3.53 5.85 9.38 4 0.7
Tb II 367.635 3.5 5.85 9.35 7.5 1.4
Te I 214.275 5.78 9.01 14.79 35 19 6
Th II 274.716 4.51 6.95 11.46 14
Th II 283.73 5.14 6.95 12.09 10 1.3
Ti II 334.941 3.74 6.82 10.56 0.6 0.5 0.5 0.45 0.09 0.03 0.07 0.05 0.13 0.2 0.7
Ti II 336.121 3.71 6.82 10.53 1.1 0.43 0.2 6.5
Ti II 337.279 3.68 6.82 10.5 2 0.3 0.2
Ti II 345.666 5.09 6.82 11.91 8.6
Tl II 190.8 6.49 6.11 12.6 12 24 19 2 1 0.3 3 5 25 2
Tl 276.787 4.48 6.11 10.59 1.7
Tm II 313.126 3.96 6.18 10.14 1.3 0.3
U I 385.958 3.24 6.08 9.32 14 18 9.4 5
V II 270.094 4.63 6.74 11.37 1.8
V II 292.402 4.63 6.74 11.37 2 3.5 2.6 0.5 0.19 0.05 0.8 0.4 0.25 0.4
V II 309.311 4.4 6.74 11.14 1.5 4.5 0.6 0.3
V II 310.23 6.02 6.74 12.76 11.1
V II 311.071 4.33 6.74 11.07 1.5
W II 207.911 6.72 7.98 14.7 14 17 8.6 3
W II 239.709 5.56 7.98 13.54
W II 248.923 5.56 7.98 13.54 23 3.5
Y II 371.029 3.52 6.38 9.9 0.15 0.7 0.3 1 0.1
Yb II 328.93 3.77 6.25 10.02 0.2 0.03
Yb II 369.419 3.35 6.25 9.6 0.4 0.05
Zn II 202.548 6.12 9.39 15.51 0.8 1.1 0.2 0.80 0.97 0.3
Zn II 206.191 6.01 9.39 15.4 5 0.5 1.5 2.2
Zn II 213.856 5.8 9.39 15.19 1 1 0.06 0.07 0.02 0.4 0.3 0.87 0.1
Zr II 339.198 3.82 6.84 10.66 1.2 2.2 0.6 0.3
Zr II 343.823 3.69 6.84 10.53 1.5 2 0.71 0.3 0.2 0.3
Zr II 349.621 3.58 6.84 10.42 2.4 0.5
()
I.B.
Brenner,
A.T.
Zander
r
Spectrochimica
Acta
Part
B:
Atomic
Spectroscopy
55
2000
1195
]
1240
1213
Ž .
Table 2 Continued
Element Wavelength EP IP IPqEP AP AP AP AP AP AP AP AP AP AP AP
Ž . Ž . Ž . Ž .
Reference nm eV eV eV 34 35 87 88 91 77,89 77,89 37 36 84,85 91
Sample introduction CFN CFN CFN Meinhard GEx Meinhard USN USN USN USN USN Instrument Optima Optima Optima Panorama JY138 EOP EOP Optima Liberty Liberty JY138
Manufacturer PE PE PE JY JY Spectro Spectro PE Varian Varian JY
Ag I 328.068 3.78 7.58 11.36 0.2 0.3 0.53 0.06
Al II 167.081 7.42 5.99 13.41 0.15
Al I 308.215 4.02 5.99 10.01 10
Al I 396.152 3.14 5.99 9.13 0.5 7 1 0.2 0.15 0.15
As I 189.042 6.56 9.81 16.37 5 3.9 6.8 2.2 0.6
As I 193.759 6.4 9.81 16.21 5 7.8 1.5 1
As I 197.197 6.29 9.81 16.1 3.2
Au I 242.795 5.1 9.23 14.33 0.75
Au I 267.595 4.63 9.23 13.86
B I 182.64 6.79 8.3 15.09 0.7 7
B I 208.959 5.94 8.3 14.24
B I 249.773 4.96 8.3 13.26 0.2 0.39
Ba II 233.527 6 5.21 11.21
Ba II 455.403 2.72 5.21 7.93 0.04 0.2 0.24 0.1 0.005 0.003
Ba II 493.409 2.51 5.21 7.72
Be I 234.861 5.28 9.32 14.6 0.01 0.08 0.43 0.02 0.015 0.002 0.005 0.003
Be II 313.042 3.96 9.32 13.28 0.07 0.02 0.01
Be II 313.107 3.96 9.32 13.28 0.009
Bi I 223.061 5.55 7.29 12.84 2.8
Br I 157.484 8.33 11.81 20.14 300
Br I 163.34 8.05 11.81 19.86 250
Ca I 317.933 7.04 6.11 13.15 7 0.35
Ca II 393.366 3.15 6.11 9.26 0.05 0.068
Ca II 396.847 3.12 6.11 9.23
Cd II 214.438 5.78 8.99 14.77 0.2 0.12
Cd II 226.502 5.47 8.99 14.46 0.3 0.2 0.2 0.045 0.19 0.075 0.1 0.05 0.008
Cd I 228.802 5.41 8.99 14.4 0.22 0.04 0.04
Ce II 413.765 3.52 5.47 8.99 Ce II 418.66 3.82 5.47 9.29
Cl I 134.724 9.2 12.97 22.17 50
Cl I 857.527 10.47 12.97 23.44
Co II 228.616 5.84 7.86 13.7 0.35 0.067 0.03
Co II 230.786 5.87 7.86 13.73 0.18
Co II 237.862 5.62 7.86 13.48
Co II 238.892 5.6 7.86 13.46 0.2 0.4 0.5 0.11 0.5 0.06 0.05 0.01
Cr II 205.552 6.03 6.77 12.8 0.065 0.1 0.12 0.01
Cr II 206.149 6.02 7.77 13.79 0.06
Cr II 267.716 6.18 6.77 12.95 0.2 0.2 1.1 0.5 0.35 0.1 0.03 0.03 0.03
Cu II 224.7 8.23 7.73 15.96 0.14
Cu I 324.754 3.82 7.73 11.55 0.25 0.5 1.5 0.5 0.82 0.05 0.03
Cu I 327.396 3.78 7.73 11.51 0.08
()
I.B.
Brenner,
A.T.
Zander
r
Spectrochimica
Acta
Part
B:
Atomic
Spectroscopy
55
2000
1195
]
1240
1214
Ž .
Table 2 Continued
Element Wavelength EP IP IPqEP AP AP AP AP AP AP AP AP AP AP AP
Ž . Ž . Ž . Ž .
Reference nm eV eV eV 34 35 87 88 91 77,89 77,89 37 36 84,85 91
Sample introduction CFN CFN CFN Meinhard GEx Meinhard USN USN USN USN USN Instrument Optima Optima Optima Panorama JY138 EOP EOP Optima Liberty Liberty JY138
Manufacturer PE PE PE JY JY Spectro Spectro PE Varian Varian JY
Er II 337.276 3.67 6.1 9.77 Er II 349.91 3.59 6.1 9.69 Eu II 412.973 3 5.67 8.67 Eu II 420.505 2.95 5.67 8.62
Fe II 238.204 5.2 7.87 13.07 0.11 0.01
Fe II 239.562 5.2 7.87 13.07 0.09
Fe II 259.94 5.22 7.87 13.09 0.15 0.3 0.7 0.4 0.3 0.04 0.03
Fe II 273.955 5.51 7.87 13.38 0.70
Ga I 287.424 4.31 6 10.31 Ga I 294.364 4.31 6 10.31 Ga I 417.206 3.07 6 9.07 Gd II 335.047 3.85 6.14 9.99 Gd II 336.223 3.77 6.14 9.91 Gd II 342.247 3.86 6.14 10 Ge I 206.866 6.06 7.88 13.94
Ge I 265.118 4.85 7.9 12.75 16
Hf II 277.336 5.25 6.6 11.85
Hg I 184.95 6.67 10.44 17.11 2 3.3
Hg II 194.227 6.39 10.44 16.83 Hg I 253.652 4.88 10.44 15.32 Ho II 339.898 3.65 6.02 9.67 Ho II 345.6 3.65 8.78 12.43
I I 142.549 8.7 10.45 19.15 10
I I 161.76 7.66 10.45 18.11 53
I I 178.215 6.95 10.45 17.4 I I 179.847 7.83 10.45 18.28
In II 230.606 5.37 5.79 11.16 5.3
In I 325.609 4.08 5.79 9.87 Ir II 212.681 5.83 9 14.83 Ir II 224.268 5.53 9 14.53
K I 766.49 1.62 4.34 5.96 3 1 2.2 0.6 1
K I 769.896 1.61 4.34 5.95 La II 333.749 4.12 4.34 8.46 La II 379.478 3.51 5.58 9.09 La II 408.672 3.03 5.58 8.61
Li I 610.364 3.87 5.39 9.26 0.08
Li I 670.784 1.85 5.39 7.24 0.2 0.2 0.11 0.02 0.06
Lu II 261.139 4.74 5.42 10.16
Mg II 279.079 8.86 7.65 16.51 1 2.7 0.13
Mg II 279.553 4.43 7.65 12.08 0.04 0.03
Mg II 280.27 4.42 7.65 12.07 0.01
Mg I 285.213 4.34 7.65 11.99
Mn II 257.61 4.81 7.44 12.25 0.03 0.9 0.1 0.017 0.04 0.01 0.005 0.003 0.002 Mn II 259.373 4.77 7.44 12.21
()
I.B.
Brenner,
A.T.
Zander
r
Spectrochimica
Acta
Part
B:
Atomic
Spectroscopy
55
2000
1195
]
1240
1215
Ž .
Table 2 Continued
Element Wavelength EP IP IPqEP AP AP AP AP AP AP AP AP AP AP AP
Ž . Ž . Ž . Ž .
Reference nm eV eV eV 34 35 87 88 91 77,89 77,89 37 36 84,85 91
Sample introduction CFN CFN CFN Meinhard GEx Meinhard USN USN USN USN USN Instrument Optima Optima Optima Panorama JY138 EOP EOP Optima Liberty Liberty JY138
Manufacturer PE PE PE JY JY Spectro Spectro PE Varian Varian JY
Mo II 202.03 6.13 7.1 13.23 0.2 0.7 0.45 0.6 0.06 0.04
Mo II 203.844 6.08 7.1 13.18 0.19
Mo II 204.598 6.06 7.1 13.16 0.35
y1
N I 174.525 10.67 14.53 25.2 100 mg l
Na I 588.995 2.1 5.14 7.24 0.03
Na I 589.592 2.1 5.14 7.24 1.5 1.6
Nb II 309.418 4.52 6.88 11.4 Nb II 313.078 4.4 6.88 11.28 Nd II 401.225 3.71 5.49 9.2 Nd II 406.109 3.52 5.49 9.01
Ni II 221.647 6.03 7.64 13.67 0.11
Ni II 231.604 6.39 7.64 14.03 0.50 0.7 0.3 1 0.19 0.6 0.18 0.02 0.06 0.06
Ni II 232.003 5.34 7.64 12.98 0.16
Os I 225.585 5.49 8.73 14.22 P I 177.499 6.99 10.49 17.48
P I 178.287 6.95 10.49 17.44 4
P I 213.618 7.22 10.49 17.71 1.1 0.13
Pb II 168.215 7.37 7.42 14.79 4.5
Pb I 216.999 5.71 7.42 13.13 0.36
Pb II 220.353 7.37 7.42 14.79 1.5 0.8 0.8 2.8 0.68 2.6 0.6 0.55 0.2 0.2 0.06
Pd I 340.458 4.46 8.34 12.8 3.1
Pd I 360.955 4.4 8.34 12.74 Pr II 390.844 3.17 5.42 8.59 Pr II 417.939 3.17 5.42 8.59 Pt II 214.423 5.8 9 14.8
Pt I 265.945 4.66 9 13.66 4.9
Rb I 780.023 1.59 4.18 5.77 Re II 197.228 6.3 7.87 14.17 Re II 227.525 5.44 7.87 13.31 Rh II 249.077 7.07 7.45 14.52 Rh II 343.489 3.6 7.45 11.05 Ru II 240.273 6.29 7.37 13.66
Ru II 245.644 6.39 7.37 13.76 18
Ru II 267.876 5.76 7.37 13.13 S I 180.734 6.85 10.36 17.21
S I 182.036 6.85 10.36 17.21 1.4 6.6
Sb I 206.833 5.98 8.64 14.62 1 0.93
Sb I 217.581 5.69 8.64 14.33 2.7 2 0.63 0.2
Sb I 231.147 5.36 8.64 14 Sc II 255.238 4.88 6.54 11.42
Sc II 361.384 3.45 6.54 9.99 0.08 0.24
Se I 196.026 6.32 9.75 16.07 4 1.6 4.9 5.6 0.59 0.8 0.8

![Fig. 4. Schematic reproduction of the direct end-on plasma]spectrometer interface. The water-cooled Cu-metal cone with its sampling orifice is mounted directly on the entrance slit of the He-purged monochromator](https://thumb-eu.123doks.com/thumbv2/123dok_br/16983281.763068/8.897.86.427.128.440/schematic-reproduction-spectrometer-interface-sampling-directly-entrance-monochromator.webp)