Pharmacist interventions to enhance blood pressure
control and adherence to antihypertensive therapy:
Review and meta-analysis
M
anuelP. M
orgado, S
andrar. M
orgado, l
ilianaC. M
endeS, l
uíSaJ. P
ereira,
and
M
iguelC
aStelo-B
ranCoManuel P. Morgado, M.Sc., PharM.D., is Pharmacist, Health Sci-ences Research Centre, University of Beira Interior (UBI), Covilhã, Portugal, and Senior Hospital Pharmacist, Hospital Centre of Cova da Beira (HCCB), Covilhã. Sandra r. Morgado, M.Sc., PharM.D., is Senior Hospital Pharmacist, HCCB. liliana c. MendeS, M.Sc., PharM.D., is a Ph.D. student, Health Sciences Research Centre, UBI. luíSa J. Pereira, Ph.D., is Mathematician and Statistician, Math-ematics Department, UBI. Miguel caStelo-Branco, Ph.D., M.D., is Researcher, Health Sciences Research Centre, UBI, and Chief, Internal Medicine, HCCB.
Address correspondence to Dr. Morgado at the Health Sciences
Research Centre, University of Beira Interior, Avenue Infante D. Henrique, Covilhã 6200-506, Portugal (manuelaugustomorgado@ gmail.com).
Supported by fellowship grant SFRH/BD/36756/2007 from the Fundação para a Ciência e a Tecnologia.
The authors have declared no potential conflicts of interest. Copyright © 2011, American Society of Health-System Pharma-cists, Inc. All rights reserved. 1079-2082/11/0201-0241$06.00.
DOI 10.2146/ajhp090656 Purpose. Pharmacist interventions to enhance blood pressure (BP) control and adherence to antihypertensive therapy in adults with essential hypertension were reviewed.
Methods. A literature search was con-ducted to identify relevant articles describ-ing pharmacist interventions intended to improve adherence to antihypertensive medications. Studies were included if they described a pharmacist intervention to improve medication adherence and ana-lyzed adherence to therapy and BP control as outcomes. A fixed-effects model was used to combine data from randomized controlled trials.
Results. A total of 15 studies were identi-fied, testing 16 different interventions and containing data on 3280 enrolled patients. Although 87.5% of the interven-tions resulted in significant improvements in treatment outcomes, only 43.8% of the interventions were associated with signifi-cant increases in medication adherence. All interventions that increased antihyperten-sive medication adherence also significant-ly reduced BP. Almost all the interventions
that were effective in increasing adherence to medication were complex, including combinations of different strategies. Meta-analysis of 2619 patients in 8 studies found that pharmacist interventions significantly reduced systolic blood pressure (SBP) (p < 0.001) and diastolic blood pressure (DBP) (p = 0.002) and that the meta-analytic dif-ferences in SBP and DBP changes from baseline to endpoint in intervention and control groups were –4.9 ± 0.9 mm Hg (p < 0.001) and –2.6 ± 0.9 mm Hg (p < 0.001), respectively.
Conclusion. A literature review and meta-analysis showed that pharmacist interven-tions can significantly improve medication adherence, SBP, DBP, and BP control in patients with essential hypertension. Inter-ventions were complex and multifaceted and included medication management in all analyzed studies.
Index terms: Blood pressure; Compliance; Hypertension; Hypotensive agents; Inter-ventions; Patients; Pharmacists
Am J Health-Syst Pharm. 2011; 68:241-53
H
ypertension is a major riskfac-tor for cardiovascular disease and an important public health problem worldwide. The risk of car-diovascular morbidity and mortality is particularly marked when there is insufficient hypertension control and prevention at the community level. Randomized controlled trials (RCTs) have demonstrated that treating high blood pressure (BP) with medication can substantially reduce the risk of stroke by 35–40% and myocardial
infarction by 20–25%.1,2 Although
the treatment of hypertension has been shown to reduce the risk of cardiovascular disease and mortality, hypertension remains inadequately managed worldwide, with a lack of adherence to BP-lowering medica-tion playing a major role in poor
BP control.3-7 Hypertensive patients
may fail to take their medication because of the symptomless nature of the condition, the long duration of therapy, adverse effects of
medi-cation, complicated drug regimens, the lack of understanding about hypertension management, costs of medication, and the challenge to
individual patients’ health beliefs.8,9
Adherence rates to antihypertensive agents differ depending on the popu-lation studied, ranging between 50%
and 70%.5,10,11
The importance of improving adherence to antihypertensive medi-cation has been addressed by the seventh report of the Joint National Committee on Prevention, Detec-tion, EvaluaDetec-tion, and Treatment of High Blood Pressure, emphasizing the role of all health care profession-als, including pharmacists, to
im-prove adherence to treatment.1 In the
past two decades, pharmacists have been developing and implementing validated methods and services to improve adherence to antihyperten-sive medication and the clinical
out-comes of this “silent” disease.12
One systematic review, which included studies from 1978 to 2006, assessed pharmacist interventions in hypertensive patients in order to enhance patients’ adherence to medi-cation and reduce systolic BP (SBP)
and diastolic BP (DBP).13 Since then,
several important RCTs14-17 and
non-RCTs18-20 have been conducted
to assess the effect of pharmacist interventions on medication adher-ence and BP control in hypertensive patients.
While there is strong evidence supporting the benefits of
antihyper-tensive drug therapy,21 there is little
clear evidence as to which types of pharmacist interventions for hyper-tensive patients are most effective for increasing medication adherence and improving hypertension control. We conducted a systematic review of published data on pharmacist inter-ventions targeting antihypertensive medication adherence in adults with essential hypertension to evaluate the effect of pharmacist interventions on antihypertensive medication adher-ence and quantify the reductions in
SBP and DBP resulting from those interventions.
Methods
A literature search to identify pharmacist interventions intended to improve adherence to antihyper-tensive medications and BP control was conducted. To be included in the systematic review, studies had to (1) have a population of adults with es-sential hypertension currently treated with BP-lowering drugs in a primary care, an outpatient, or a commu-nity setting, (2) clearly describe and evaluate an intervention delivered by a pharmacist to improve adherence with antihypertensive drugs and BP control, and (3) include both adher-ence to antihypertensive medication and mean SBP, mean DBP, or BP con-trol as outcomes. Studies describing multidisciplinary interventions were included only if the pharmacist’s role in patient care was clearly de-scribed. Articles describing different health conditions (e.g., cardiovascu-lar diseases not involving essential hypertension) were excluded, as were studies assessing SBP and DBP or BP control but not antihypertensive medication adherence. The criteria used to assess adherence and treat-ment outcome were based on the observation that studies showing an increase in adherence without an im-provement in clinical outcome pro-vide no practical guidance for prac-tice. Articles were also required to be written in English, French, Spanish, German, Portuguese, or Italian.
We searched the main electronic databases freely available in our research center: MEDLINE, The Cochrane Library, and ISI Web of Knowledge. Each database was inde-pendently searched by two reviewers for articles published from January 1999 through June 2009, using the terms high blood pressure,
hyper-tension, pharmaceutical services or pharmaceutical care or pharmacist,
and patient outcomes (i.e., adherence,
compliance, systolic blood pressure,
di-astolic blood pressure, and blood pres-sure control). We also hand searched
bibliographies of all retrieved articles to identify additional publications of pharmacist interventions on patient medication adherence.
Two authors independently se-lected articles by first reading titles, then abstracts, and, finally, full texts. The reviewers selected articles based on the predefined inclusion and ex-clusion criteria and then compared results. Any disagreements were resolved by consensus. The rationale for decisions was discussed until re-viewers agreed on the final decision. A third author was called to resolve any remaining discrepancies con-cerning article eligibility.
Data extraction was also per-formed by two independent authors, and disagreements were resolved through the same consensus process used with article selection. The fol-lowing data were obtained in dupli-cate and verified: year of publication, study design, use of a comparison group, type of pharmacist interven-tions, extent of follow-up, study set-ting, sample size of both intervention and control groups, patients lost to follow-up, methods used to measure medication adherence, and out-comes measured. The outout-comes of particular interest were medication adherence, SBP, DBP, and BP control. During data extraction, we wrote to corresponding authors of studies to request missing data and clarify study details.
After data were extracted, we clas-sified study outcomes as either sensi-tive or nonsensisensi-tive. Sensisensi-tive results were those that were influenced posi-tively by the pharmacist intervention from a clinical point of view and that had statistical significance (i.e., p of ≤0.05 at the endpoint of the study). Pharmacist interventions aimed to increase adherence to BP-lowering medication and BP control were classified as (1) medication manage-ment (drug therapy monitoring and adjustments; simplification of
anti-hypertensive regimens; optimization of drug regimen in order to solve adverse drug reactions, drug–drug interactions, and food–drug inter-actions; generic substitution), (2) educational interventions directed at the patient (hypertension education, BP self-monitoring recommenda-tion, lifestyle education and coun-seling, medication education and counseling), (3) self-monitoring and recording of BP, including educa-tion, encouragement, and validata-tion of BP monitor, (4) medicavalidata-tion reminders, including education and counseling tips (adherence aids), and appointment reminders (e.g., telephone or computer-based), (5) improved administration systems (e.g., Medication Event Monitoring System [Aardex Group Ltd., Slon, Valais, Switzerland]), and medica-tions dispensed using an adherence aid (e.g., blister packs), (6) more-frequent follow-up appointments or contacts, (7) educational inter-ventions and alerts directed at the health care professional (personal, telephone- or computer-based), and (8) pharmacist clinical visits in medical, university, hospital, and community-based clinics.
Two reviewers assessed the quality of accepted studies independently and in duplicate, using the quality
scale of Downs and Black,22 which
was developed based on epide-miologic principles, reviews of study designs, and existing checklists for assessing RCTs. Disagreements re-garding study quality were handled by consensus, and additional in-formation about study design was requested from the authors if nec-essary. The method of Downs and
Black22 has been validated, and it
allows for the scoring of quality of RCTs and observational studies. The instrument consists of a 28-item checklist that addresses a study’s quality of reporting (10 items), ex-ternal validity (3 items), inex-ternal va-lidity or bias (7 items), confounding variables (6 items), power (1 item),
and a global score (1 item assessing the rater’s overall impression of the quality of a paper) and has a pos-sible total score of 42 (correspond-ing to the maximum quality score of 100%). Scores below 50% were considered weak, those between 50% and 69% were considered fair, scores of 70–79% were good, and scores of 80–100% were very good. We used a Mann-Whitney U test to compare quality scores between sensitive and nonsensitive outcomes, because there may be a relationship between the methodological quality of the included studies and the success of their respective interventions.
Medication adherence was re-ported in the individual groups of the studies at baseline and end of study. Whenever feasible, the per-centage of participants with con-trolled BP at the end of the study and the corresponding odds ratio were mentioned. In each study, BP was classified as controlled using the national or international guidelines applicable at the time of the study. Because of the substantial differences among selected studies in terms of the various methods that were used to measure adherence (e.g., prescrip-tion refill data, pill count, compliance questionnaire, plasma drug level), we believed that pooling of the medica-tion adherence results was inappro-priate. A fixed-effects meta-analytic model was used to combine SBP and DBP results. However, only studies with extractable data and that had a contemporary control group were included in the meta-analysis (i.e., subjects allocated to usual care [con-trol group] were treated during the same time period [contemporary] as the intervention group) to ensure that the only difference between the groups was the pharmacist interven-tion under investigainterven-tion.
We explored the potential for publication bias by using funnel plots and calculating the Begg–
Mazumdar23 statistic. We examined
the heterogeneity of outcomes
us-ing the chi-square test.24 All analyses
were conducted with SPSS, version 17.0 (SPSS Institute, Chicago, IL) and Comprehensive Meta-Analysis, version 2.0 (Biostat, Englewood, NJ), and the a priori level of significance was 0.05.
Results
Initially, 225 potential articles were identified. After assessing their titles and excluding those not men-tioning any information pertinent to hypertension, BP, or medication adherence studies, 130 remained and their abstracts read. Of the 47 articles retrieved for full-text review, 32 were excluded for the following reasons:
not an interventional study,25-27
studied participants with a different
disease not relevant to review,28-32 did
not include pharmacists in the study
interventions,33 presented
pharma-ceutical interventions and outcomes investigating neither adherence nor BP,34-37 presented pharmaceutical interventions and outcomes
inves-tigating BP but not adherence,38-53
investigated medication adherence outcome in the intervention group only and baseline adherence was
not measured,54 and not studies but
reviews.13,55 A total of 15 articles were
included as full-text in our systematic
review.14-20,56-63
Table 1 details some character-istics of the included studies. One study tested different interven-tions in three distinct intervention
groups.16 In this study the authors
attributed the simplest interven-tion (provider educainterven-tion) to the control group and the remaining interventions (“provider education and alert” and “provider education and alert and patient education”) to two intervention groups. Another study included two pharmacist-intervention groups, designated as a high-intensity intervention and a low-intensity intervention. We considered the low-intensity group, in which the only pharmacist inter-vention was measurement of BP and
patient counseling to contact their physician whenever BP was above normal, as the control group.
Medication management, educa-tional interventions directed to the patient, and more-frequent follow-up appointments or contacts were the most frequently used pharma-cist interventions. The number of pharmacist interventions per study ranged from two to five. After BP val-ues and medication adherence out-comes, which were evaluated in all tudies, patient quality of life was the
Table 1.
Characteristics of Studies Evaluating Pharmacists’ Interventions in Hypertension Treatmenta
Ref. Study Designb Setting (Country) InterventionPharmacist c
Frequency of Pharmacist–Patient Interaction in Intervention Group 14 15 16 17 18 19 20 56 57 58 59 60 61 62 63 RCT RCT Cluster RCT Cluster RCT SGCT SGCT SGCT RCT SGCT Non-RCT RCT RCT RCT RCT RCT
Community-based primary care clinics (United States)
Army medical center (United States) Hospital-based clinics (United States) Community-based clinics (United States) University clinics (United States) Primary-care clinics and community
pharmacies (United States)
Clinic in university teaching hospital (Brazil) Community pharmacy (Nigeria)
Community pharmacies (United Kingdom) Aircraft carrier (United States)
Community pharmacies (Canada) Medical clinic (Brazil)
Medical clinic (United States) Community pharmacies (Thailand) Medical clinic (United States)
Community pharmacies (United States)
A, B, C B, D C A, C A, B, C, E, F, G A, B, C, E A, B, C, F A, B, C, E A, B A A, B, C, F A A, B, C, E A, B A, B A, B, C, E Mean, 7.2 times in 12 mod Every 2 moe >3 times in 6 mof Mean ± S.D., 6.8 ± 1.6 times in 9 mog 5 times in 9 moh Mean, 10.5 times in 12 moh Monthlyh Every 2 moi Every 2 wkh Mean, 5.8 times in 9 moj Monthlyf Monthlyi Monthlyi Monthlyi 4 times in 3 mok
aMedication adherence and blood pressure were measured in all studies. Other measured outcomes included quality of life, self-measurement of blood pressure,
alcohol moderation, exercise, salt restriction, smoking cessation, number of antihypertensive drugs, adverse drugs effects, hypertension-related knowledge, patient satisfaction, resource utilization, low-density-lipoprotein cholesterol concentration, and intensification of antihypertensive regimen.
bRCT = randomized clinical trial, SGCT = single-group clinical trial.
cIn all studies, pharmacists’ interventions included medication management (e.g., drug therapy monitoring or adjustment, simplification of antihypertensive regimens,
resolution of adverse drug reactions). A = educational interventions directed to the patient (e.g., hypertension education, lifestyle education and counseling), B = scheduling more-frequent follow-up appointments or contacts, C = educational interventions and alerts directed to health care professionals, D = providing improved administration systems (e.g., medication event monitoring system, blister packs), E = instituting self-monitoring and recording of blood pressure, including education, encouragement, and validating blood pressure monitor, F = providing medication reminders, including education and counseling tips (adherence aid tools) and appointment reminders (e.g., telephone based, computer based), G = pharmacist clinical visit attendance.
dInteraction in the control group occurred a mean of 4.9 times in 12 months.
eInteraction in the control group occurred at baseline and at the midpoint and end of the study. fInteraction in the control group occurred with the same frequency as in the intervention group. gInteraction in the control group occurred a mean ± S.D. of 5.5 ± 1.3 times in 9 months. hPatients at baseline served as their own controls.
iInteraction in the control group occurred at baseline and at the end of the study. jInteraction in the control group occurred 4 times in 9 months.
kInteraction in the control group occurred 3 times in 3 months.
most evaluated outcome, present in
6 of the 15 included studies.14,18-20,60,62
Table 1 also details the pharmacist– patient interaction in control and intervention groups of included studies. The most common fre-quency of pharmacist–patient in-teraction in the intervention group was between monthly and every two months, and the purpose of the interaction was to provide pharma-cist interventions. The pharmapharma-cist– patient interaction in the control group involved mostly baseline,
intermediate, and endpoint assess-ment of described outcomes.
Article quality scores, sample size, duration of follow-up, losses to follow-up, and outcomes sensitive to pharmacist interventions are shown in Table 2. The mean ± S.D. article quality score was 67.5% ± 10.6% (range, 50–76%), which was consid-ered fair. The mean ± S.D. sample size was 218.7 ± 331.7 patients (me-dian, 111 patients; range, 26–1341 patients). The follow-up period of the studies evaluated ranged from
two weeks to 12 months, with an av-erage duration of 6.7 ± 10.6 months. Losses to follow-up ranged from 3.4% to 48.5% (mean ± S.D., 18.9% ± 15.3%). Article quality scores did not increase from 2000 to 2008 (y
= 596.848 – 0.264x, r2 = 0.006, p =
0.790, where y = article quality score and x = publication year). Sixty-one percent of the outcomes (28/46) were categorized as sensitive to the phar-macist interventions.
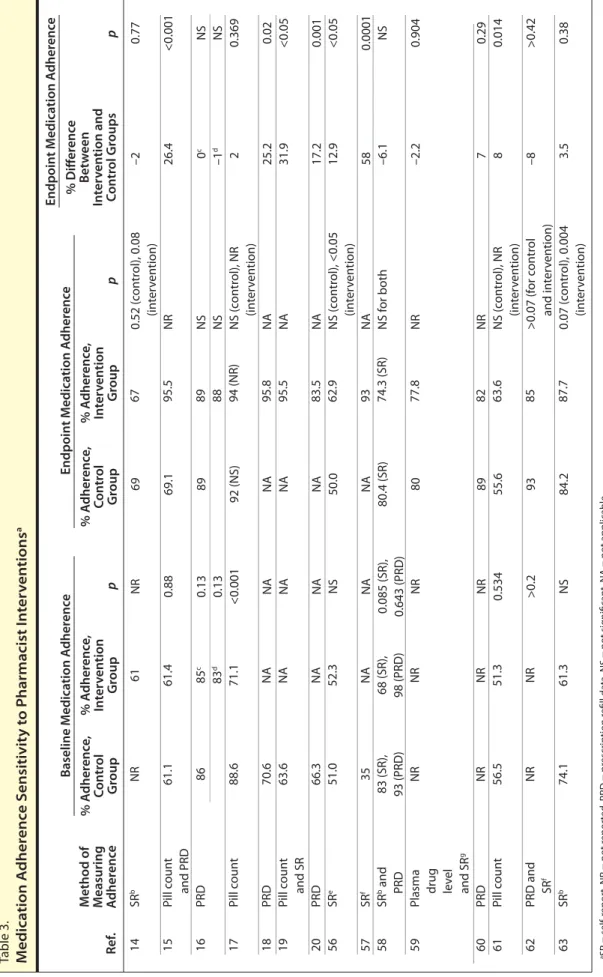
Effect on medication adherence and BP control. Adherence was
mea-sured in different ways, including self-report (through questionnaire or direct questioning), pill counts, analysis of prescription refill data, and plasma levels of hydrochlorothi-azide. Various criteria for adherence were used in the studies, making a pooled analysis inappropriate (Table 3). Baseline medication adherence to antihypertensive drugs ranged from 35% to 88.6%, and medication adherence at study end ranged from 50% to 95.8%, which points to an increase in medication adherence due to pharmacist interventions. In fact, 7 of 16 intervention groups demonstrated a significant improve-ment in medication adherence when compared with the control groups. Differences in adherence rates at study end between pharmacist inter-vention groups and control groups varied from 8% to 58% in studies with positive sensitive outcomes. Although 5 studies revealed that pharmacist interventions had a nega-tive effect on patients’ treatment ad-herence compared with the control group, which ranged from –1% to –8%, these negative results were not significant. One study found an ab-normally high increase in treatment adherence rate (increase of 58% from baseline); however, no comparison group was used in this study, and the follow-up period was only two weeks. The correlation between article qual-ity scores and impact of pharmacist interventions was –0.680 (p = 0.004)
for medication adherence. This ob- Table 2. Article Qualit
y S cor es , Sample Siz e, Dur ation of F ollo w -up , and L osses t o F ollo w -Up of S elec ted S tudies a Ref . Q ualit y Sco re , % n D ur ation of Follo w -up (mo ) No . (%) Pts L ost t o Follo w -up 14 15 16 17 18 19 20 56 57 58 59 60 61 62 63 76 69 76 67 50 57 52 67 56 74 82 67 82 78 59 463 159 1341 179 103 48 40 282 26 111 71 41 235 56 125 230 83 1017 101 103 48 40 167 26 41 d 34 20 118 27 64 191 (41.3) 13 (8.2) 366 (27.3) 19 (10.6) 50 (48.5) 4 (8.3) 16 (40.0) 102 (36.2) 4 (15.4) 11 (9.9) 7 (9.9) 5 (12.2) 8 (3.4) 3 (5.4) 8 (6.4) O ut comes S ensitiv e to Pharmacist Inter ven tions 233 76 324 78 . . . c . . . c . . . c 115 . . . c 59 d 37 21 117 29 61 12 6 6 9 9 12 5 6 0.5 (2 wk) 9 6 6 6 6 3 SBP Adher enc e, SBP SBP b SBP , DBP A dher enc e, SBP , DBP A dher enc e, SBP , DBP A dher enc e, SBP , DBP A dher enc e, SBP A dher enc e, SBP SBP None DBP Adher enc e, SBP , DBP SBP , DBP SBP , DBP aSBP = sy st olic blood pr essur e, DBP = diast olic blood pr essur e. bPr ovider educa
tion and aler
t and pa tien t educa tion in ter ven tion g roup . cPa tien ts ser ved as their o wn c on tr ols . dPa tien ts a
t the end of the study (the ar
ticle does not men
tion the number of pa
tien
ts enr
olled in each g
roup a
t the beg
inning of the study).
In ter ven tion Gr oup C on tr ol Gr oup
Table 3. Medica tion A dher enc e S ensitivit y t o P harmacist I n ter ven tions a Ref . M ethod of M easuring A dher enc e p 14 15 16 17 18 19 20 56 57 58 59 60 61 62 63 SR b Pill c oun t and PRD PRD Pill c oun t PRD Pill c oun t and SR PRD SR e SR f SR b and PRD
Plasma drug lev
el and SR g PRD Pill c oun t PRD and SR f SR b NR 61.1 86 88.6 70.6 63.6 66.3 51.0 35 83 (SR), 93 (PRD ) NR NR 56.5 NR 74.1 67 95.5 89 88 94 (NR) 95.8 95.5 83.5 62.9 93 74.3 (SR) 77.8 82 63.6 85 87.7 NR 0.88 0.13 0.13 <0.001 NA NA NA NS NA 0.085 (SR), 0.643 (PRD ) NR NR 0.534 >0.2 NS 69 69.1 89 92 (NS) NA NA NA 50.0 NA 80.4 (SR) 80 89 55.6 93 84.2 0.52 (c on tr ol), 0.08 (in ter ven tion) NR NS NS NS (c on tr ol), NR (in ter ven tion) NA NA NA NS (c on tr ol), <0.05 (in ter ven tion) NA NS f or both NR NR NS (c on tr ol), NR (in ter ven tion) >0.07 (f or c on tr ol and in ter ven tion) 0.07 (c on tr ol), 0.004 (in ter ven tion) % A dher enc e, C on tr ol Gr oup % A dher enc e, In ter ven tion Gr oup Baseline M edica tion A dher enc e Endpoin t M edica tion A dher enc e p % A dher enc e, C on tr ol Gr oup % A dher enc e, In ter ven tion Gr oup Endpoin t M edica tion A dher enc e –2 26.4 c 0 d–1 2 25.2 31.9 17.2 12.9 58 –6.1 –2.2 7 8 –8 3.5 0.77 <0.001 NS NS 0.369 0.02 <0.05 0.001 <0.05 0.0001 NS 0.904 0.29 0.014 >0.42 0.38 aSR = self-r epor t, NR = not r epor ted , PRD = pr escr iption r efill da
ta, NS = not sig
nifican t, NA = not applicable . bM or isk y questionnair e. cPr ovider educa
tion and aler
t in ter ven tion g roup . dPr ovider educa
tion and aler
t and pa tien t educa tion in ter ven tion g roup . eHor ne ’s M edica tion A dher enc e R epor t S
cale used in questionnair
e and with dir
ec t questioning b y phar macist. fComplianc e questionnair e. gDáder method b y means of a phar mac other ap y hist or
y and using phar
macist ’s dir ec t questioning . p % Diff er enc e B et w een In ter ven tion and C on tr ol Gr oups 61 61.4 85 c 83 d 71.1 NA NA NA 52.3 NA 68 (SR), 98 (PRD ) NR NR 51.3 NR 61.3
servation suggests that higher quality scores are associated with a lesser ef-fect on medication adherence. All of the 4 single-group controlled trials evaluated (with no contemporary comparison control group) reported a significant increase in medication adherence. The remaining 3 stud-ies, which were RCTs, that reported a significant increase in medica-tion adherence had more-frequent follow-up with the intervention group. Six other studies also adopted more-frequent follow-up without a significant increase in medication adherence. In 5 of these 6 studies, the endpoint adherence rate was high (>80%) in the control group, pos-sibly making it difficult to achieve a further increase in the intervention group. Indeed, all 7 studies with a high adherence rate at study end-point (>80%) in the control group
Table 4.
Effects of Pharmacist Interventions on Blood Pressure (BP) Controla
Ref. SBP 14 15 16 17 18 19 20 56 57 58 59 60 61 62 63 5.0 (<0.001) 7.3 (0.001) –0.3 (NS)b 6.0 (<0.001)c 11.6 (<0.001) 16.7 (0.02) 18.6 (<0.05) 14.3 (<0.001) NR NR HI: 8.3 (0.01) LI: –4.4 (NS) 5.0 (0.063) 10.1 (0.069) 5.7 (0.001) 14.1 (<0.001) 4.6 (0.041) 1.0 (0.235) 1.4 (0.216) 1.3 (NS)b 3.3 (NS)c 3.3 (0.005) 12.2 (0.04) 9.1 (<0.05) 10.8 (<0.001) NR NR HI: 2.5 (0.28) LI: –2.5 (NS) 2.0 (0.281) 6.7 (0.022) 2.5 (0.029) 14.8 (<0.001) 3.2 (0.014) 44.0 NR 42.0 52.9 NR 0 NR 17.1 42.0 HI: 42.0 LI: NS NS 22.0 57.2 30.0 12.0 (diabetic pts) 30.0 62.0 NR 59.5 89.1 NR 41.0 NR 35.7 73.0 HI: 69.0 LI: NS NS 44.0 66.1 81 91.0 (diabetic pts) 42.0 0.003 NR 0.003 <0.001 NR <0.05 NR <0.05 0.02 0.073 0.895 NS >0.1 0.061 <0.001 <0.001 0.45 2.1 (1.4–3.0) NR 2.0 (1.5–2.7) 7.2 (3.2–15.6) NR 12.2 (4.6–32.5) NR 2.7 (1.5–4.7) 3.7 (1.2–11.9) 3.1 (0.8–12.4) NS NS 2.8 (0.7–10.8) 1.5 (0.9–2.5) 9.8 (2.8–34.1) 70.0 (5.6–882.2) 1.7 (0.8–3.5) DBP Difference in BP in Intervention vs. Control Group, mm Hg (p) % Pts With Controlled BP at End of Study p Control
Group Intervention Group OR (95% CI)
aSBP = systolic blood pressure, DBP = diastolic blood pressure, OR = odds ratio, CI = confidence interval, NR = not reported, HI = high income, LI = low income,
NS = not significant.
bProvider education and alert intervention group.
cProvider education and alert and patient education intervention group.
found that pharmacist interventions had a nonsignificant effect on medi-cation adherence. All other stud-ies but 1 revealed that pharmacist interventions had a positive effect on medication adherence, with a mean difference in adherence rates at endpoint between intervention and control groups of 22.2%.
Likewise, various criteria were used to report BP outcome, making it inappropriate to pool data from all included studies, though the range of results from individual studies are presented (Table 4). Of the 15 studies evaluated, 2 did not measure SBP or DBP, 7 studies described a significant improvement in both SBP and DBP, 4 described a significant improve-ment in SBP alone, and 1 study noted a significant improvement in DBP alone. Significant improvements in SBP and DBP ranged from –5.0 to
–18.6 mm Hg and from –1.0 to –12.2 mm Hg, respectively.
Three of the included studies did not describe the percentage of par-ticipants with controlled BP at the end of the study. Seven studies found a significant increase in the percent-age of participants with controlled BP at the end of the study when comparing intervention and control groups, which ranged from 17.5% to 51.0%. The authors of each study classified BP as controlled using the national or international guidelines applicable at the time of the study (in most studies, BP was considered controlled when SBP was < 140 mm Hg and DBP was < 90 mm Hg). In 11 studies, we were able to calculate the odds ratio for the rate of patients achieving controlled BP at endpoint in the intervention group compared with the control group, and a range
of 1.46–12.18 was obtained, with a mean ± S.D. value of 4.43 ± 3.6.
Of the 7 studies that found a sig-nificant improvement in both SBP and DBP, 42.9% were single-group controlled trials (with no contem-porary comparison control group). Thus, we analyzed the correlation between article quality scores and the impact of pharmacist interventions on SBP and DBP. This correlation was –0.599 (p = 0.018) for SBP and –0.659 (p = 0.007) for DBP. These observations suggest that higher quality studies are associated with a lesser effect on BP control.
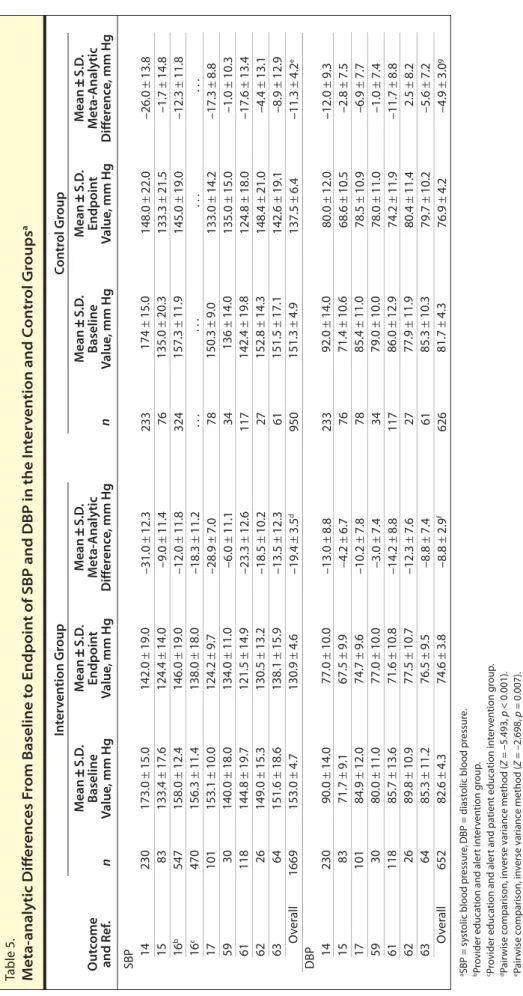
A total of 8 controlled trials were included in the meta-analysis (Table 5). The remaining 7 studies were not included because the data were not
extractable56,58,60 and a comparison
contemporary control group was not
used.18-20,57
Effects on SBP. Sensitive
out-comes were reported in 11 of 13 studies evaluating SBP. It was pos-sible to include only 8 studies for the meta-analysis of SBP outcomes. A funnel plot (data not shown) did not rule out the possibility of publication bias; therefore, we applied the
trim-and-fill method,64 which increased
the difference in SBP change between intervention and placebo from 4.9 to 5.6 mm Hg (p < 0.001). However, the
Begg–Mazumdar23 statistic was very
small and nonsignificant (t < 0.001,
p = 1.0). The Q statistic for
hetero-geneity of effects was not significant
(c2 = 0.741, p = 0.99); therefore, we
considered the study results to be combinable.
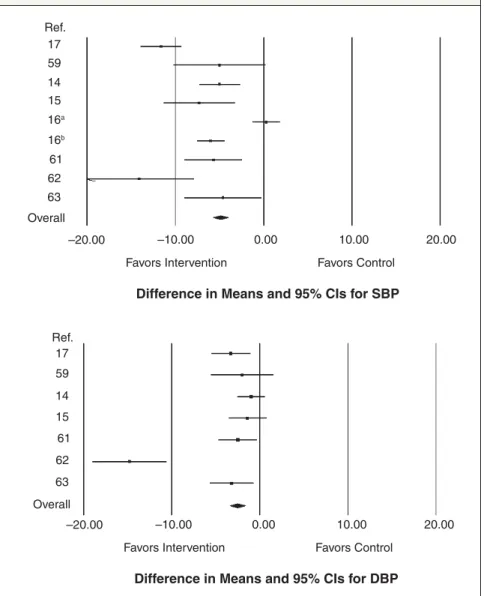
The meta-analytic mean ± S.D. baseline and endpoint SBPs in the pharmacist intervention group were 153.0 ± 4.7 and 130.9 ± 4.6 mm Hg, respectively, producing a clinical and statistical weighted difference of –19.4 ± 3.5 mm Hg (p < 0.001). A significant difference was also ob-served in the mean ± S.D. SBP from baseline (151.3 ± 4.9 mm Hg) to endpoint (137.5 ± 6.4 mm Hg) in the control group, with a meta-analytic
difference of –11.3 ± 4.2 (p = 0.007). Meta-analytic differences from base-line to endpoint of both groups were calculated and are presented in Fig-ure 1. The meta-analytic mean ± S.D. difference in SBP from baseline to endpoint between intervention and control groups was –4.9 ± 0.9 mm Hg (p < 0.001).
Effects on DBP. Sensitive outcomes
were reported in 8 of 13 studies evalu-ating DBP. It was possible to include only 7 studies for the meta-analysis of DBP evaluation. The funnel plot was similar to that for SBP (data not shown). Use of the trim-and-fill method increased the difference between intervention and placebo from 2.6 to 3.3 mm Hg (p < 0.001).
However, the Begg–Mazumdar23
sta-tistic did not detect publication bias (t = –0.09, p = 0.76). The Q statistic found no heterogeneity of effects
(c2 = 2.23, p = 0.90), so the results
were considered combinable.
The meta-analytic mean ± S.D. baseline and endpoint DBPs in the pharmacist intervention group were
82.6 ± 4.3 and 74.6 ± 3.8 mm Hg,
respectively, producing a clinical and statistical weighted difference of –8.8 ± 2.9 mm Hg (p = 0.002). However, a nonsignificant difference was ob-served in DBP from baseline (81.7 ± 4.3 mm Hg) to endpoint (76.9 ± 4.2 mm Hg) in the control group, with a meta-analytic difference of –4.9 ± 3.0 mm Hg (p = 0.103). Meta-analytic differences from baseline to endpoint of both groups were calculated and are presented in Figure 1. Pharmacist intervention reduced the DBP of the intervention group an additional 2.6 ± 0.9 mm Hg when compared with the control group (p < 0.001).
Discussion
The majority of the studies in-cluded in our analysis were RCTs. Although the mean quality of these RCTs was considered good (qual-ity score, 72.3%), the mean qual(qual-ity of all the studies evaluated was fair (quality score, 67.5%). It is not
fea-sible to blind hypertensive patients in pharmaceutical intervention models, as this process of blind-ing is assessed in one item of the
Downs and Black22 quality checklist.
By removing this item, the average quality of all articles included would increase to over 70%. However, 6 studies in which patients were not randomized to intervention groups, which are assessed by two items of the Downs and Black quality check-list, prevented a further increase of the overall quality score.
Although 88% of the interven-tions tested (14 of 16 in 15 studies) resulted in significant improvements in treatment outcomes (SBP, DBP, or percentage of participants with controlled BP at the end of the study), only 44% of the interventions (7 of 16 in 15 studies) were associated with significant increases in medication adherence. These results were higher than those obtained by Machado et
al.,13 who found that 76.6% and 38.5%
of studies analyzed reported improve-ment in treatimprove-ment outcomes and in medication adherence, respectively, though they did not address BP con-trol specifically. Differences obtained in the systematic review of Machado
et al.13 and in our review reflect a
trend toward improved medication adherence and treatment outcomes obtained with the most recent studies, which included more interventions involving physician–pharmacist
col-laboration.14,16-20 In both systematic
reviews, all studies that found a sig-nificant increase in medication adher-ence also demonstrated a significant improvement in treatment outcomes, revealing that medication adherence is a key factor (though not the only one) for achieving BP control.
Drug therapy adjustments may have contributed to improvements in BP control in studies where medica-tion adherence rates did not signifi-cantly change. Some studies suggest-ed that antihypertensive msuggest-edications are frequently not intensified when BP remains uncontrolled (clinical
in-Table 5. Meta-analytic Diff er enc es F rom Baseline t o Endpoin t of SBP and DBP in the I n ter ven tion and C on tr ol Gr oups a O ut come and Ref . n SBP 14 15 16 b 16 c 17 59 61 62 63 O ver all DBP 14 15 17 59 61 62 63 O ver all 230 83 547 470 101 30 118 26 64 1669 230 83 101 30 118 26 64 652 173.0 ± 15.0 133.4 ± 17.6 158.0 ± 12.4 156.3 ± 11.4 153.1 ± 10.0 140.0 ± 18.0 144.8 ± 19.7 149.0 ± 15.3 151.6 ± 18.6 153.0 ± 4.7 90.0 ± 14.0 71.7 ± 9.1 84.9 ± 12.0 80.0 ± 11.0 85.7 ± 13.6 89.8 ± 10.9 85.3 ± 11.2 82.6 ± 4.3 142.0 ± 19.0 124.4 ± 14.0 146.0 ± 19.0 138.0 ± 18.0 124.2 ± 9.7 134.0 ± 11.0 121.5 ± 14.9 130.5 ± 13.2 138.1 ± 15.9 130.9 ± 4.6 77.0 ± 10.0 67.5 ± 9.9 74.7 ± 9.6 77.0 ± 10.0 71.6 ± 10.8 77.5 ± 10.7 76.5 ± 9.5 74.6 ± 3.8 174 ± 15.0 135.0 ± 20.3 157.3 ± 11.9 . . . 150.3 ± 9.0 136 ± 14.0 142.4 ± 19.8 152.8 ± 14.3 151.5 ± 17.1 151.3 ± 4.9 92.0 ± 14.0 71.4 ± 10.6 85.4 ± 11.0 79.0 ± 10.0 86.0 ± 12.9 77.9 ± 11.9 85.3 ± 10.3 81.7 ± 4.3 –31.0 ± 12.3 –9.0 ± 11.4 –12.0 ± 11.8 –18.3 ± 11.2 –28.9 ± 7.0 –6.0 ± 11.1 –23.3 ± 12.6 –18.5 ± 10.2 –13.5 ± 12.3 –19.4 ± 3.5 d –13.0 ± 8.8 –4.2 ± 6.7 –10.2 ± 7.8 –3.0 ± 7.4 –14.2 ± 8.8 –12.3 ± 7.6 –8.8 ± 7.4 –8.8 ± 2.9 f 233 76 324 . . . 78 34 117 27 61 950 233 76 78 34 117 27 61 626 M ean ± S.D . Baseline Value , mm Hg M ean ± S.D . Endpoin t Value , mm Hg In ter ven tion Gr oup C on tr ol Gr oup n M ean ± S.D . Baseline Value , mm Hg M ean ± S.D . Endpoin t Value , mm Hg 148.0 ± 22.0 133.3 ± 21.5 145.0 ± 19.0 . . . 133.0 ± 14.2 135.0 ± 15.0 124.8 ± 18.0 148.4 ± 21.0 142.6 ± 19.1 137.5 ± 6.4 80.0 ± 12.0 68.6 ± 10.5 78.5 ± 10.9 78.0 ± 11.0 74.2 ± 11.9 80.4 ± 11.4 79.7 ± 10.2 76.9 ± 4.2 –26.0 ± 13.8 –1.7 ± 14.8 –12.3 ± 11.8 . . . –17.3 ± 8.8 –1.0 ± 10.3 –17.6 ± 13.4 –4.4 ± 13.1 –8.9 ± 12.9 –11.3 ± 4.2 e –12.0 ± 9.3 –2.8 ± 7.5 –6.9 ± 7.7 –1.0 ± 7.4 –11.7 ± 8.8 2.5 ± 8.2 –5.6 ± 7.2 –4.9 ± 3.0 g M ean ± S.D . M eta-A nalytic Diff er enc e, mm Hg M ean ± S.D . M eta-A nalytic Diff er enc e, mm Hg aSBP = sy st olic blood pr essur e, DBP = diast olic blood pr essur e. bPr ovider educa
tion and aler
t in ter ven tion g roup . cPr ovider educa
tion and aler
t and pa tien t educa tion in ter ven tion g roup . dPair wise c ompar ison, in verse v ar ianc e method ( Z = –5.493, p < 0.001). ePair wise c ompar ison, in verse v ar ianc e method ( Z = –2.698, p = 0.007). fPair wise c ompar ison, in verse v ar ianc e method ( Z = –3.025, p = 0.002). gPair wise c ompar ison, in verse v ar ianc e method ( Z = –1.632, p = 0.103).
ertia).65,66 By addressing suboptimal medication regimens, pharmacists may have contributed to changing unsuccessful regimens, searching for those regimens that would be more likely to succeed. However, it is also possible that the several methods used to measure adherence, some of which were unreliable, may have contributed to the inconsistency in adherence-rate differences between
control and intervention groups. Large high-quality trials that use reliable methods of measuring ad-herence are needed to investigate the relationship between adherence and BP reduction.
SBP and DBP were definitely sensitive to pharmacist interven-tions, as we found that baseline to endpoint reductions in these out-comes were significantly influenced
in intervention groups compared with control groups. These results also differ from those obtained
by Machado et al.,13 whose review
showed that only SBP was sensitive to pharmacist interventions.
Almost all the interventions that were effective for medication adher-ence or BP control improvements were complex, including combina-tions of medication management, educational programs directed at the patient, scheduling of more-frequent follow-up appointments, medication reminders, counseling, self-monitoring of BP, and other forms of additional supervision or attention. We were not able to find a pattern of types or numbers of interventions that predicted success. Methods for improving antihyper-tensive adherence and BP control were generally labor-intensive (and therefore expensive) and not pre-dictably effective. However, many intervention programs did lead to improved adherence or treatment outcomes. In 10 studies, we were able to calculate the odds ratio for the rate of patients achieving targeted BP at endpoint in the intervention group when compared with the control group, and a range of 1.46–12.18 was obtained, with a mean ± S.D. value of 4.43 ± 3.6. These values imply that achieving controlled BP at the end of the study was more likely in the intervention group and are in accordance with the values obtained
by Carter et al.67 In addition,
stud-ies with the largest effect sizes (i.e., the largest reductions in SBP or DBP from baseline to endpoint) had higher mean baseline SBP and DBP values (Table 5). Thus, the clinical impact of pharmacist interventions in hypertensive patients is expected to be more pronounced in high-risk patients. Moreover, it is possible that some pharmacist intervention programs put more emphasis on bet-ter communication and empathetic reinforcement, as these actions build trust, are potent motivators, and tend
Figure 1. Meta-analytic differences in improvement of systolic blood pressure (SBP) and diastolic blood pressure (DBP) (mm Hg) between patients receiving a pharmacist intervention and patients in control groups. Negative estimates favor the intervention group over the control group in the reduction of SBP or DBP in hypertensive patients. The squares represent the difference in improvement between groups, with 95% confidence interval (CI). 17 59 14 15 16a 16b 61 62 63 Overall –20.00 –10.00 0.00 10.00 20.00
Favors Intervention Favors Control
Difference in Means and 95% CIs for SBP Ref. 17 59 14 15 61 62 63 Overall –20.00 –10.00 0.00 10.00 20.00
Favors Intervention Favors Control
Difference in Means and 95% CIs for DBP Ref.
aProvider education and alert intervention group.
to improve outcomes.1 Motivation improves when patients have positive experiences with and trust in their health care staff. More studies are needed to assess the role of commu-nication and empathetic reinforce-ment skills of pharmacists and other health care personnel on patient mo-tivation and outcomes improvement. Our study had several limitations. Comparing the different studies included in this review was difficult due to marked heterogeneity in terms of research designs, interven-tions, duration of follow-up, meth-ods to measure medication adherence, and reporting of clinical outcomes. Some studies demonstrated poor methodological quality, particularly with regard to the presence of a con-temporary comparison control group, randomization, blinding of outcomes assessment, and losses to follow-up. In two studies, the duration of follow-up was too short (three months or less), which is considered inadequate to
classify adherence rates accurately25,68
and to demonstrate persistent positive
clinical findings.69
Adherence was measured and cal-culated in various ways, which made a pooled analysis inappropriate. For
example, in one study,58 the baseline
adherence measured by the Morisky
et al.70 questionnairewas 83% and
68% in the control and intervention groups, respectively. When using refill-data analysis, the baseline ad-herence of the same patients was 93% and 98% in the control and interven-tion groups, respectively. Medica-tion adherence was usually assessed unblinded to allocation status, which constitutes a potential source of bias. Without an agreement on criteria to measure and define medication ad-herence, it is not surprising that the effect of most interventions on ad-herence and BP was variable, making it difficult to examine the relation-ship between medication adherence and subsequent BP control.
We were not able to include sev-eral studies in our meta-analysis of
SBP and DBP in the intervention and control groups, because some studies either did not report these data or did not use a comparison or control group. One other limitation is based on the quality of pharmacist interventions made. It is possible that the same pharmacist intervention led to different results, depending on the empathetic reinforcement and motivation provided by the health care personnel that have contact with hypertensive patients. Therefore, some degree of variation of results is expected in clinical pharmacy practice. Another limitation is our literature search was conducted us-ing the main electronic databases freely available in our research cen-ter, leaving out important databases like International Pharmaceutical Abstracts and EMBASE. We tried to circumvent this limitation by hand searching bibliographies of all retrieved articles to identify ad-ditional publications of pharmacist interventions on patient medica-tion adherence. Finally, a chance of publication bias cannot be ruled out based on funnel plot analyses and the trim-and-fill method, though our search criteria were intended to capture all published articles evaluat-ing pharmacist interventions on both antihypertensive medication adher-ence and BP control. Publication bias occurs when authors are more likely to submit, or editors accept, positive rather than null (negative or incon-clusive) results. A search performed for unpublished data would have helped to minimize the occurrence of publication bias.
Conclusion
A literature review and meta-analysis showed that pharmacist in-terventions can significantly improve medication adherence, SBP, DBP, and BP control in patients with es-sential hypertension. Interventions were complex and multifaceted and included medication management in all analyzed studies.
References
1. Chobanian AV, Bakris GL, Black HR et al. Seventh report of the Joint National Committee on Prevention, Detection, Evaluation, and Treatment of High Blood Pressure. Hypertension. 2003; 42:1206-52.
2. Collins R, Peto R, MacMahon S et al. Blood pressure, stroke, and coronary heart disease. Part 2, short-term reduc-tions in blood pressure: overview of randomised drug trials in their epidemi-ological context. Lancet. 1990; 335:827-38.
3. Godley P, Pham H, Rohack J et al. Op-portunities for improving the quality of hypertension care in a managed care setting. Am J Health-Syst Pharm. 2001; 58:1728-33.
4. Whitworth JA. 2003 World Health Orga-nization (WHO)/International Society of Hypertension (ISH) statement on man-agement of hypertension. J Hypertens. 2003; 21:1983-92.
5. Schroeder K, Fahey T, Ebrahim S. How can we improve adherence to blood pressure-lowering medication in ambula-tory care? Systematic review of random-ized controlled trials. Arch Intern Med. 2004; 164:722-32.
6. Krousel-Wood M, Thomas S, Muntner P et al. Medication adherence: a key factor in achieving blood pressure control and good clinical outcomes in hyperten-sive patients. Curr Opin Cardiol. 2004; 19:357-62.
7. Munger MA, Van Tassell BW, LaFleur J. Medication nonadherence: an un-recognized cardiovascular risk factor.
MedGenMed. 2007; 9:58.
8. Dowell J, Jones A, Snadden D. Exploring medication use to seek concordance with ‘non-adherent’ patients: a qualitative study. Br J Gen Pract. 2002; 52:24-32. 9. Ebrahim S. Detection, adherence and
control of hypertension for the preven-tion of stroke: a systematic review. Health
Technol Assess. 1998; 2:i-iv,1-78.
10. Psaty BM, Koepsell TD, Yanez ND et al. Temporal patterns of antihypertensive medication use among older adults, 1989 through 1992. An effect of the major clinical trials on clinical practice? JAMA. 1995; 273:1436-8.
11. Caro JJ, Speckman JL, Salas M et al. Effect of initial drug choice on persistence with antihypertensive therapy: the importance of actual practice data. CMAJ. 1999; 160:41-6.
12. Hepler CD, Strand LM. Opportunities and responsibilities in pharmaceutical care. Am J Hosp Pharm. 1990; 47:533-43. 13. Machado M, Bajcar J, Guzzo GC et al.
Sensitivity of patient outcomes to phar-macist interventions. Part II: systematic review and meta-analysis in hypertension management. Ann Pharmacother. 2007; 41:1770-81.
14. Hunt JS, Siemienczuk J, Pape G et al. A randomized controlled trial of team-based care: impact of physician- pharmacist collaboration on
uncon-trolled hypertension. J Gen Intern Med. 2008; 23:1966-72.
15. Lee JK, Grace KA, Taylor AJ. Effect of a pharmacy care program on medication adherence and persistence, blood pres-sure, and low-density lipoprotein cho-lesterol: a randomized controlled trial.
JAMA. 2006; 296:2563-71.
16. Roumie CL, Elasy TA, Greevy R et al. Im-proving blood pressure control through provider education, provider alerts, and patient education: a cluster random-ized trial. Ann Intern Med. 2006; 145: 165-75.
17. Carter BL, Bergus GR, Dawson JD et al. A cluster randomized trial to evaluate physician/pharmacist collaboration to improve blood pressure control. J Clin
Hypertens. 2008; 10:260-71.
18. Lai LL. Community pharmacy-based hypertension disease-management pro-gram in a Latino/Hispanic-American population. Consult Pharm. 2007; 22:411-6.
19. De Souza WA, Yugar-Toledo JC, Bergsten-Mendes G et al. Effect of pharmaceutical care on blood pressure control and health-related quality of life in patients with resistant hyperten-sion. Am J Health-Syst Pharm. 2007; 64:1955-61.
20. Aguwa CN, Ukwe CV, Ekwunife OI. Ef-fect of pharmaceutical care programme on blood pressure and quality of life in a Nigerian pharmacy. Pharm World Sci. 2008; 30:107-10.
21. Turnbull F. Effects of different blood-p re s s u re - l ow e r i n g re g i m e n s o n major cardiovascular events: results of prospectively-designed overviews of ran-domised trials. Lancet. 2003; 362:1527-35. 22. Downs SH, Black N. The feasibility of
creating a checklist for the assessment of the methodological quality both of randomised and non-randomised studies of health care interventions. J Epidemiol
Community Health. 1998; 52:377-84.
23. Begg CB, Mazumdar M. Operating char-acteristics of a rank correlation test for publication bias. Biometrics. 1994; 50: 1088-101.
24. Cochran WG. The combination of esti-mates from different experiments.
Bio-metrics. 1954; 10:101-29.
25. Green BB, Ralston JD, Fishman PA et al. Electronic communications and home blood pressure monitoring (e-BP) study: design, delivery, and evaluation frame-work. Contemp Clin Trials. 2008; 29:376-95.
26. Weycker D, Edelsberg J, Vincze G et al. Blood pressure control in patients initiat-ing antihypertensive therapy. Ann
Phar-macother. 2008; 42:169-76.
27. Dean SC, Kerry SM, Cappuccio FP et al. Pilot study of potential barriers to blood pressure control in patients with inad-equately controlled hypertension. Fam
Pract. 2007; 24:259-62.
28. Irons BK, Lenz RJ, Anderson SL et al. A retrospective cohort analysis of the clinical effectiveness of a
physician-pharmacist collaborative drug therapy management diabetes clinic.
Pharmaco-therapy. 2002; 22:1294-300.
29. Simpson SH, Johnson JA, Biggs RS et al. Greater effect of enhanced pharmacist care on cholesterol management in pa-tients with diabetes mellitus: a planned subgroup analysis of the Study of Car-diovascular Risk Intervention by Phar-macists (SCRIP). Pharmacotherapy. 2004; 24:389-94.
30. Ellis SL, Carter BL, Malone DC et al. Clinical and economic impact of ambula-tory care clinical pharmacists in manage-ment of dyslipidemia in older adults: the IMPROVE study. Pharmacotherapy. 2000; 20:1508-16.
31. Fischer LR, Scott LM, Boonstra DM et al. Pharmaceutical care for patients with chronic conditions. J Am Pharm Assoc. 2000; 40:174-80.
32. Bucci C, Jackevicius C, McFarlane K et al. Pharmacist’s contribution in a heart function clinic: patient perception and medication appropriateness. Can J
Car-diol. 2003; 19:391-6.
33. Pickering TG. Home blood pressure monitoring: a new standard method for monitoring hypertension control in treated patients. Nat Clin Pract
Cardio-vasc Med. 2008; 5:762-3.
34. Lewis NJ, Bugdalski-Stutrud C, Abate MA et al. The medication assessment program: comprehensive medication assessments for persons taking multiple medications for chronic diseases. J Am
Pharm Assoc. 2008; 48:171-80.
35. Tinelli M, Bond C, Blenkinsopp A et al. Patient evaluation of a community phar-macy medications management service.
Ann Pharmacother. 2007; 41:1962-70.
36. Lowey A, Moore S, Norris C et al. The cost-effectiveness of pharmacist-led treatment of cardiac risk in patients with type 2 diabetes. Pharm World Sci. 2007; 29:541-5.
37. Cote I, Moisan J, Chabot I et al. Health-related quality of life in hypertension: impact of a pharmacy intervention programme. J Clin Pharm Ther. 2005; 30:355-62.
38. Erhun WO, Agbani EO, Bolaji EE. Positive benefits of a pharmacist-managed hyper-tension clinic in Nigeria. Public Health. 2005; 119:792-8.
39. Carter BL. [Improving blood pressure control with physician/pharmacist col-laboration.] Vnitr Lek. 2009; 55:389-94. In Czech.
40. Green BB, Cook AJ, Ralston JD et al. Effectiveness of home blood pressure monitoring, Web communication, and pharmacist care on hypertension control: a randomized controlled trial. JAMA. 2008; 299:2857-67.
41. McLean DL, McAlister FA, Johnson JA et al. A randomized trial of the effect of community pharmacist and nurse care on improving blood pressure manage-ment in patients with diabetes mellitus: Study of Cardiovascular Risk Interven-tion by Pharmacists—Hypertension
(SCRIP-HTN). Arch Intern Med. 2008; 168:2355-61.
42. Isetts BJ, Schondelmeyer SW, Artz MB et al. Clinical and economic outcomes of medication therapy management services: the Minnesota experience. J Am
Pharm Assoc. 2008; 48:203-11.
43. Bunting BA, Smith BH, Sutherland SE. The Asheville Project: clinical and eco-nomic outcomes of a community-based long-term medication therapy manage-ment program for hypertension and dyslipidemia. J Am Pharm Assoc. 2008; 48:23-31.
44. Von Muenster SJ, Carter BL, Weber CA et al. Description of pharmacist inter-ventions during physician-pharmacist co-management of hypertension. Pharm
World Sci. 2008; 30:128-35.
45. Rozenfeld Y, Hunt JS. Effect of patient withdrawal on a study evaluating phar-macist management of hypertension.
Pharmacotherapy. 2006; 26:1565-71.
46. McConnell KJ, Zadvorny EB, Hardy AM et al. Coronary artery disease and hypertension: outcomes of a pharmacist-managed blood pressure program.
Phar-macotherapy. 2006; 26:1333-41.
47. Borenstein JE, Graber G, Saltiel E et al. Physician-pharmacist comanagement of hypertension: a randomized, comparative trial. Pharmacotherapy. 2003; 23:209-16. 48. Garcao JA, Cabrita J. Evaluation of a
pharmaceutical care program for hyper-tensive patients in rural Portugal. J Am
Pharm Assoc. 2002; 42:858-64.
49. Godley P, Nguyen A, Yokoyama K et al. Improving hypertension care in a large group-model MCO. Am J Health-Syst
Pharm. 2003; 60:554-64.
50. Okamoto MP, Nakahiro RK. Pharmaco-economic evaluation of a pharmacist-managed hypertension clinic.
Pharmaco-therapy. 2001; 21:1337-44.
51. Reid F, Murray P, Storrie M. Implementa-tion of a pharmacist-led clinic for hyper-tensive patients in primary care—a pilot study. Pharm World Sci. 2005; 27:202-7. 52. Hennessy S, Leonard CE, Yang W et al.
Effectiveness of a two-part educational intervention to improve hypertension control: a cluster-randomized trial.
Phar-macotherapy. 2006; 26:1342-7.
53. Murray MD, Harris LE, Overhage JM et al. Failure of computerized treatment suggestions to improve health outcomes of outpatients with uncomplicated hypertension: results of a randomized controlled trial. Pharmacotherapy. 2004; 24:324-37.
54. Santschi V, Rodondi N, Bugnon O et al. Impact of electronic monitoring of drug adherence on blood pressure control in primary care: a cluster 12-month ran-domised controlled study. Eur J Intern
Med. 2008; 19:427-34.
55. Machado M, Bajcar J, Guzzo GC et al. Sensitivity of patient outcomes to pharmacist interventions. Part I: system-atic review and meta-analysis in diabetes management. Ann Pharmacother. 2007; 41:1569-82.
56. Blenkinsopp A. Extended adherence support by community pharmacists for patients with hypertension: a randomised controlled trial. Int J Pharm Pract. 2000; 8:165-75.
57. Brouker ME, Gallagher K, Larrat EP et al. Patient compliance and blood pressure control on a nuclear-powered aircraft carrier: impact of a pharmacy officer. Mil
Med. 2000; 165:106-10.
58. Chabot I, Moisan J, Gregoire JP et al. Pharmacist intervention program for control of hypertension. Ann
Pharmaco-ther. 2003; 37:1186-93.
59. De Castro MS, Fuchs FD, Santos MC et al. Pharmaceutical care program for patients with uncontrolled hypertension. Report of a double-blind clinical trial with am-bulatory blood pressure monitoring. Am
J Hypertens. 2006; 19:528-33.
60. Mehos BM, Saseen JJ, MacLaughlin EJ. Effect of pharmacist intervention and initiation of home blood pressure monitoring in patients with uncontrolled hypertension. Pharmacotherapy. 2000; 20:1384-9.
61. Sookaneknun P, Richards RM, Sanguan-sermsri J et al. Pharmacist involvement in primary care improves hypertensive patient clinical outcomes. Ann
Pharma-cother. 2004; 38:2023-8.
62. Vivian EM. Improving blood pressure control in a pharmacist-managed hyper-tension clinic. Pharmacotherapy. 2002; 22:1533-40.
63. Zillich AJ, Sutherland JM, Kumbera PA et al. Hypertension outcomes through blood pressure monitoring and evalu-ation by pharmacists (HOME study). J
Gen Intern Med. 2005; 20:1091-6.
64. Duval S, Tweedie R. Trim and fill: a simple funnel-plot-based method of test-ing and adjusttest-ing for publication bias in meta-analysis. Biometrics. 2000; 56:455-63.
65. Milchak JL, Carter BL, James PA et al. Measuring adherence to practice guide-lines for the management of hyperten-sion: an evaluation of the literature.
Hypertension. 2004; 44:602-8.
66. Carter BL, Ardery G, Dawson JD et al. Physician and pharmacist collaboration to improve blood pressure control. Arch
Intern Med. 2009; 169:1996-2002.
67. Carter BL, Rogers M, Daly J et al. The potency of team-based care interventions for hypertension: a meta-analysis. Arch
Intern Med. 2009; 169:1748-55.
68. Christensen DB, Williams B, Goldberg HI et al. Assessing compliance to antihy-pertensive medications using computer-based pharmacy records. Med Care. 1997; 35:1164-70.
69. McDonald HP, Garg AX, Haynes RB. In-terventions to enhance patient adherence to medication prescriptions: scientific review. JAMA. 2002; 288:2868-79. 70. Morisky DE, Green LW, Levine DM.
Concurrent and predictive validity of a self-reported measure of medication ad-herence. Med Care. 1986; 24:67-74.