1
Sand bypass and updrift beach evolution after jetty construction at an
ebb-tidal delta
E. Garel (1,2*), C. Sousa (1), Ó. Ferreira (1)
Author personal copy
(1)
CIMA (Centre for Marine and Environmental Research), Universidade do Algarve, Campus de
Gambelas, 8005 - 139 Faro, Portugal.(2)
now at CCMAR (Centre of Marine Sciences), Universidade do Algarve, Campus de Gambelas, 8005 - 139 Faro, Portugal.
(*)
Corresponding author: E. Garel ([email protected]; tel: + 351 289 800 900 ext. 7899)
Abstract
The evolution of an ebb-tidal delta (Guadiana, South Portugal) and its updrift beach after jetty construction (in 1972-74) is analysed based on 24 ortho-rectified aerial photographs (1940-2012) and 13 bathymetric maps (1969-2014). The objectives are to evaluate the re-establishment of the sand bypassing process and if the disruption of the historical delta may affect the updrift beach evolution. Post-jetty progradation of the updrift beach resulted from two large accretion events. The second (largest) event (110 m progradation in 1985-1994) was due to beach attachment of a shoal produced by the erosion of a broad shallow area relict of the historical delta. The reworking of sand from this relict area also enables the individualisation of a lateral updrift bar simultaneously with the new ebb shoal proper formation. Both morphological features were close to (volume) equilibrium in 1995, indicating that most of the sand was transported towards the downdrift side of the inlet at that time. This study shows that erosion of the historical delta may enhance significantly the updrift shoreline progradation and may promote the re-establishment of sand bypassing after jetty construction.
Keywords: Mixed-energy tidal inlet; Guadiana; ebb shoal; lateral bar; morphology; shoal
2
1. INTRODUCTION
Ebb-tidal deltas are dynamic features with varying morphology resulting from the complex interplay between waves, tides, sediment supply and sometimes river discharge (Boothroyd 1985; Chang 1997; de Swart and Zimmerman 2009; FitzGerald 1996; FitzGerald et al. 2002; Hayes 1980). These interactions often produce large morphological modifications over the course of seasons to decades, characterized typically by cyclical changes in the position of the inlet channel and by the development and migration of shoals (e.g., Burningham and French 2006; Cheung et al. 2007; Cooper et al. 2007; Elias and van der Spek 2006; FitzGerald 1984; FitzGerald et al. 2002; Gaudiano and Kana 2001; Hume and Herdendorf 1992; Oertel 1977; Siegle et al. 2004). These spatial and temporal morphological variations can render navigation hazardous. As such, the position of the inlet is often stabilised by jetties that disrupt the dynamic equilibrium between the ebb-tidal delta morphology and the prevailing hydrodynamic conditions (Komar 1996; Kraus 2009; Oost et al. 2012). Inlets typically respond to jetty construction with the collapse of the ebb-tidal delta due to the long-term abandonment of tidal currents (wave-induced onshore transport is no longer countered by ebb-tidal currents), and with the development of a new ebb shoal (Buijsman et al. 2003; Hansen and Knowles 1988; Kraus 2006; Pope 1991), referred to as the “ebb shoal proper” (Kraus 2000). The later (ebb shoal, hereafter) develops seaward in the stream of the estuarine ebb jet due to the confinement of the flow at the inlet. The growing of the ebb delta may be accompanied with the development of complex morphological features resulting from preferred sand transport pathways over the delta (see Carr and Kraus 2001). It is only when the ebb delta reaches a mature state characterised by a relatively stable overall morphology, that all the littoral drift is bypassed, i.e., transported from the updrift to the downdrift side of the inlet (Kraus 2000).
At settings where there is a dominant longshore transport direction, erosion (progradation) is typically observed along the downdrift (updrift) beach after jetty construction (Galgano 2007; Kraus 2009). Sand deficit downdrift is due to a combination of: sand retention along the updrift jetty, in particular immediately after inlet stabilisation; the storing of sand in deeper water, where it is less frequently reworked by waves; and erosion over the ebb delta following its collapse, hence offering less protection to wave action at the coast (Buijsman et al. 2003; Kaminsky 2007). Updrift progradation is typically due to impoundment of the littoral drift against the (updrift) jetty (Bruun 1995; Dean and Work 1993; Hapke et al. 2013).
Observations spanning several decades have shown however, that the geomorphic evolution of ebb-tidal deltas after jetty construction must be considered at multiple temporal and spatial scales when assessing the shoreline’s response to artificial structures (e.g., Byrnes and Hiland 1995; Elias et al. 2003; Garel et al. 2014). After jetty construction, for example, the downdrift part of the swash platform becomes dominated by onshore wave-induced transport because the (confined) inlet channel has become stabilized. Wave-induced erosion of the historical delta may result in the formation and landward migration of shoals that ultimately weld to the downdrift coast (Gaudiano and Kana 2001; Kana et al. 1999). As a result, downdrift progradation may be observed at these sites during decades after inlet stabilisation, in opposition to expectations, due to bypassing processes inherited from the pre-jetty morphology (Bruun 1995; Garel et al. 2014; Kana and McKee 2003). This accretion process involving a large contribution of cross-shore transport to the shoreline evolution after inlet stabilisation is not well-documented along updrift beaches adjacent to jetties, and there is not a clear notion of how sand bypass is affected. Those two aspects are the main topics of this study, i.e., to determine, after jetty installation, (1) the potential contribution of cross-shore transport processes to the evolution of an updrift beach, and (2) the re-establishment of sediment bypassing. The post-jetty morphologic evolution of a collapsing ebb-tidal delta experiencing a dominant direction of longshore sediment transport (the Guadiana) and the position of its updrift beach are examined based on aerial photographs and bathymetric maps. The results are of interest
3
for the improvement of both conceptual models and management actions at inlets and adjacent coasts.
2. BACKGROUND TO THE AREA
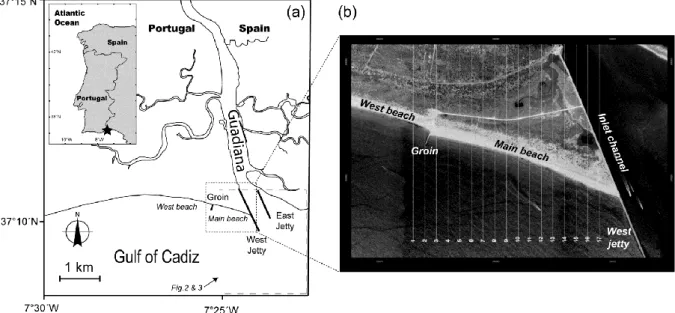
The study area encompasses the ebb delta of the Guadiana estuary, at the southern border between Spain and Portugal, and its adjacent 2.5 km beach located on the updrift (Portuguese) side (Figure 1). The tidal regime in the area is semi-diurnal with a mean range of 2 m (Garel and Ferreira 2013). Offshore wave climate is dominated by W-SW wave direction (71% occurrence) and SE sea waves (23% of occurrences) of moderate energy, with yearly average significant wave height and peak period of 1 m and 8.2 s, respectively (Costa et al. 2001). According to these hydrodynamic parameters and referring to the terminology of Hayes (1979), the Guadiana is a mixed-energy, tide-dominated inlet (Morales 1997). Wave’s conditions produce a dominant eastward littoral transport in the area.
Figure 1. a) General location map of the study area; the dashed rectangle indicates the location of the maps presented in Figures 2 and 3; b) positions of the transects (1 to 17) selected to determine the temporal evolution of the high water line along the updrift coast (aerial photograph from 2005).
Before construction of the jetties, the ebb delta of the Guadiana was characterised by the presence of a large sandy shoal system, the O’Bril bank, accumulating the littoral drift on the western margin of the estuary mouth (see Figure 2, 1969). Under the course of decades, the bank was undergoing cyclical periods of eastward growth, rotation towards the eastern margin, and breaching that induced the discontinuous bypass of a large volume of sand (Garel et al. 2014; Gonzalez et al. 2001). This evolution corresponds to the conceptual model of ebb-tidal delta breaching proposed by FitzGerald et al. (2000) for those tidal inlets that have a stable river mouth position but whose main channel migrates cyclically downdrift because of longshore transport. A pair of parallel jetties (2,040 m and 1,350 m in length at west and east, respectively) was built in 1972–1974 to stabilise the Guadiana inlet and to improve its navigability. No channel dredging was performed concurrently with jetty installation. At the same time, a 250 m-long groin was constructed, at 1,800 m from the inlet on the Portuguese side, to restrain sand accumulation due to littoral transport against the western jetty. For convenience in this study, the updrift beaches at west of the groin and between the groin and the jetty are referred to as the West beach and Main beach, respectively (Figure 1).
4
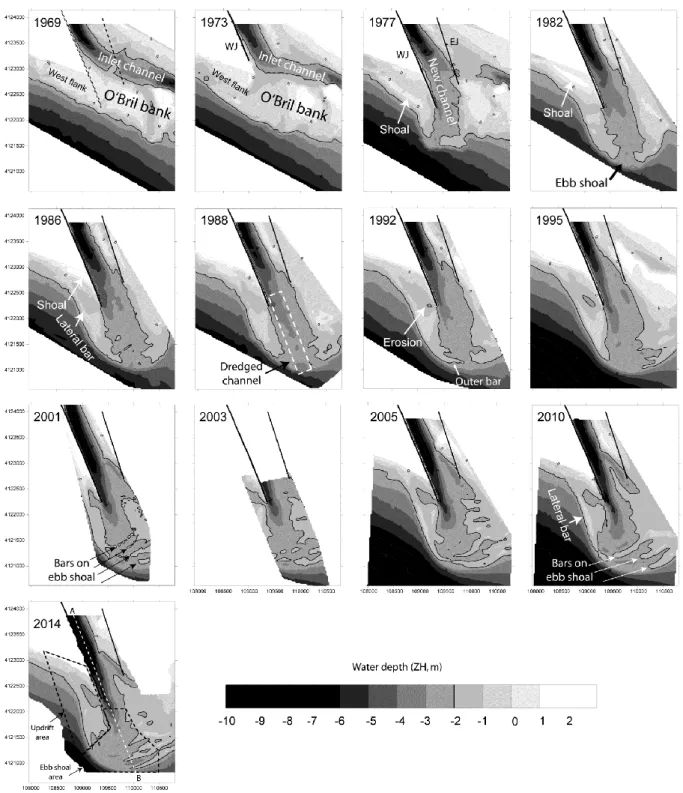
Figure 2. Bathymetric maps of the study area from 1969 to 2014. Grey scale: light is shallower and dark is deeper water depths. The thick contour line is -2 m. Reference is Hydrographic Zero (ZH, 2 m below mean sea level). The areas used for the ebb shoal and lateral updrift bar volume computations (Figure 7) are outlined on the 2014 map, together with the location of the along channel cross sections presented in Figure 4 (white dashed line, section A-B). WJ: West Jetty; EJ: East Jetty.
Garel et al. (2014) have described the post-jetty evolution of the downdrift coast, together with the collapse of the eastern sector of the historical ebb delta. This study shows that the downdrift area is still largely controlled by the dynamics of shoals that are relict of the O’Bril bank, and thus by the pre-jetty (bank breaching) bypassing process. Furthermore, an ebb shoal has typically formed in the confine of the jetties after their construction. The development of this feature makes navigation hazardous at low tide and dredging operations were conducted in 1986 and at the beginning of 2015 to improve navigability. On the updrift side, Gonzalez et al. (2001) analysed the evolution of the
5
Portuguese coast (adjacent to the west jetty) from 1945 to 1999 based on 11 aerial photographs (but without considering submerged structures). Their study revealed a large beach accretion since jetty construction, attributed to accumulation of the littoral drift against the west jetty. They further estimated a littoral transport rate of 180,000 m3/yr, in line with regional estimates from other sources (between 100,000 and 300,000 m3/yr; see Gonzalez et al., 2001 and references therein). River-borne material is also supplied to the ebb delta during period of high river inflows, at a (very approximate) rate of 100,000 m3/yr (Portela 2006); however, this source has been drastically reduced with the closure in 2002 of a large dam (the Alqueva) near the estuary head (Garel and Ferreira 2011; Garel et al. 2009).
3. MATERIAL AND METHODS
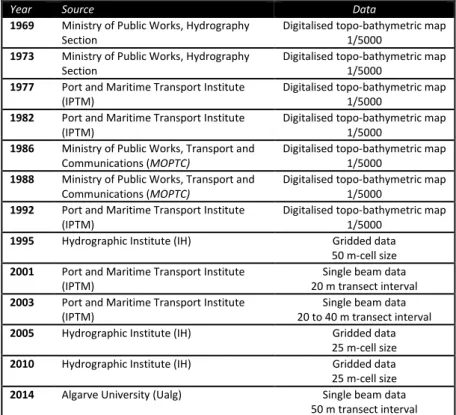
The morphological evolution of the Guadiana ebb delta was analyzed based on 13 bathymetric maps, extending over the southern and western portion of the ebb delta (Table 1). This area includes the stabilised inlet channel, the newly formed ebb shoal, and the adjoined updrift lateral area. The maps range from 1969 (before jetty construction) to 2014, with a time interval between 2 and 6 years (3.75 years on average). However, the maps from 2001 and 2003 do not cover the area at west of the channel, as such the maximum time interval is 10 years (between 1995 and 2005) for this area. All maps were gridded at 25m cell-sizes and referred to the Portuguese Hydrographic Zero (ZH, 2 m below mean sea level) using the Surfer mapping software. Bathymetric difference maps were produced between successive grids in order to highlight the morphological evolution of the system. Only vertical differences larger than 1 m were considered in order to identify the main erosion/accretion patterns and to avoid artefacts produced by (unknown) distinct horizontal and vertical accuracies between the maps.
Table 1. List and attributes of the bathymetric maps used in the present study.
Year Source Data
1969 Ministry of Public Works, Hydrography Section
Digitalised topo-bathymetric map 1/5000
1973 Ministry of Public Works, Hydrography Section
Digitalised topo-bathymetric map 1/5000
1977 Port and Maritime Transport Institute (IPTM)
Digitalised topo-bathymetric map 1/5000
1982 Port and Maritime Transport Institute (IPTM)
Digitalised topo-bathymetric map 1/5000
1986 Ministry of Public Works, Transport and Communications (MOPTC)
Digitalised topo-bathymetric map 1/5000
1988 Ministry of Public Works, Transport and Communications (MOPTC)
Digitalised topo-bathymetric map 1/5000
1992 Port and Maritime Transport Institute (IPTM)
Digitalised topo-bathymetric map 1/5000
1995 Hydrographic Institute (IH) Gridded data 50 m-cell size
2001 Port and Maritime Transport Institute (IPTM)
Single beam data 20 m transect interval
2003 Port and Maritime Transport Institute (IPTM)
Single beam data 20 to 40 m transect interval
2005 Hydrographic Institute (IH) Gridded data 25 m-cell size
2010 Hydrographic Institute (IH) Gridded data 25 m-cell size
2014 Algarve University (Ualg) Single beam data 50 m transect interval
The evolution of the updrift coast was studied based on 24 ortho-rectified vertical aerial photographs ranging from 1940 to 2012 (Table 2) using ArcGIS. The exact dates (day, month) of the photographs were generally not available. The images were rectified using the orthophotograph
6
from 2005 as a reference to reduce the spatial shifts resulting from the coordinate projection (de Mers 2008). The Ground Control Points (GCPs) were selected preferentially along the coastline to minimize distortions in this area. Following Morton et al. (2004), the total error (σ, 3.53 m at
maximum) was computed based on the pixel size (σPS) and associated Root Mean Square error (σRMS)
of each rectified image (see Garel et al. 2014).
Table 2. List and attributes of the ortho-rectified vertical aerial photographs used in the study. B&W is black and white; GCP no. is the number of ground control points; RMSE is root mean square error. The total error is computed from the pixel size and RMSE. * refers to images already ortho-rectified in the selected projection system (from the Portuguese Geophysical Institute, IGP).
year Color/b&w Pixel size (m) GCP no. RMS (m) Total error (m)
1940 b&w 0.9 7 1.10 1.42 1958 b&w 1.5 5 2.03 2.52 1969 b&w 2 5 2.86 3.49 1972 b&w 0.5 6 3.49 3.53 1976 b&w 1.5 11 2.62 3.02 1977 b&w 1.36 5 1.00 1.69 1978 b&w 1 8 1.67 1.95 1980 b&w 2.3 8 0.60 2.38 1985 b&w 2 5 1.17 2.32 1986 b&w 0.5 7 0.76 0.91 1987 b&w 1.75 9 1.51 2.31 1991 b&w 1.74 7 0.34 1.77 1994 b&w 1.81 8 0.42 1.86 1996 color 2.5 10 1.67 3.01 1999 color 0.5 21 0.59 0.77 2000 color 1 14 1.22 1.58 2001 color 0.5 14 0.60 0.78 2005 color 0.5 * * 0.50 2006 color 0.5 * * 0.50 2007 color 0.5 * * 0.50 2008 color 0.1 * * 0.10 2010 color 0.5 7 0.34 0.60 2011 color 0.5 11 0.48 0.69 2012 color 0.5 10 0.34 0.60
7
The rectified images were then used to identify the position of the High Water Line (HWL), defined as the tonal contrast between the wet intertidal beach and the dry supratidal beach (Dolan and Hayden 1983; Morton 1979). Because the HWL position is sensitive to short term sea level variations, such as storms, tidal range or run up, care must be taken with its interpretation regarding coastal advance or retreat through time. Only the large HWL variations (20 m, at least) were considered to be significant in this study.
For the quantification of advance and retreat rates, the position of the HWL for each rectified image was determined along 17 parallel transects (Tr) with a 100 m interval (Figure 1). The transects were oriented North-South, rather than perpendicular to the coast, to also report sand accumulation along the west jetty. The HWL position along the y-coordinate (d) was then corrected from the coastal orientation (15º) to obtain the final HWL position (=d.cos15) along each transect. Two transects (Tr. 1 and 2) were located immediately at west of the groin (West beach), allowing to evaluate the local effect of this structure on the HWL position. The 1976 image was the first one available after jetty construction, and was taken as reference (zero). For the other images, positive and negative values stand for HWL advance or retreat, respectively, with respect to its position in 1976. The averaged HWL position of beach portions (i.e., considering several transects) was computed as the mean of each of the considered transects.
4. RESULTS
4.1. EBB DELTA RESPONSE TO JETTY CONSTRUCTION
The confinement of the ebb flow induced by the jetties built in 1972-74 at the Guadiana inlet induced the scouring of a new inlet channel through the O’Bril bank (Figure 2). Most of this artificial bank breaching was completed in 1982. A large part of the scoured material deposited further south, forming an ebb shoal migrating seaward. Dredging in 1986 increased the depth and seaward extension of the inlet channel, cutting through the ebb shoal (compare 1986 and 1988 in Figure 2). The ebb shoal was already redeveloped in 1992, displaying a large shallow outer bar. Then, the ebb shoal evolution was characterized by the development of several sub-parallel bars. These features are well identified from 2001 onwards reaching less than 2 m (ZH) water depth locally (Figure 2). After jetty installation, strong erosion also took place updrift of the west jetty, over a broad shallow area that constituted part of the (seaward flank of the) O’Bril bank (for location, see the map of 1973; see also the position of the jetties on the map of 1969; Figure 2). This erosion has produced a shore-parallel shallow shoal (above 0 m, ZH) migrating landward, that attached (or nearly) to the updrift beach in 1986 (Figure 2, 1977 to 1986). Erosion of the broad near shore shallow area has also produced a lateral updrift bar (> – 2 m, ZH), migrating seaward together with the ebb shoal; this feature was well individualised from the shallow West flank of the O’Bril bank from 1986 onwards (Figure 2). At the same time, the shallow area near the west jetty (for location, see 1992 in Figure 2) was getting deeper as the lateral updrift bar was developing into the preferential pathway for sand. This set of observations shows that both the ebb shoal and updrift lateral bar result mainly from redistribution (seaward) of a large sand supply that was part of the O’Bril bank. They are not new morphologic features produced by the deposition of sand from an external source (such as littoral transport or estuarine export).
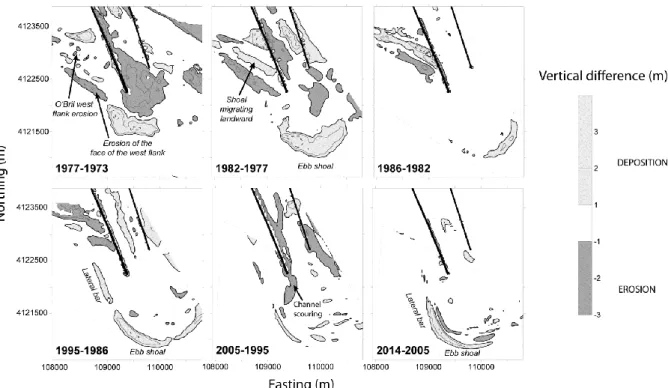
With the exception of a large scouring of the inlet channel that occurred between 1995 and 2005, the bathymetric difference maps show that most of the morphological changes at the study area occurred during the first decade after jetty construction (Figure 3). Afterwards, the evolution of the system was relatively slow in relation to the depletion of the main sediment source constituted by the O’Bril bank. Since then, sand deposited mostly along the outer delta, outlined by the horseshoe-shaped area constituted by the updrift lateral bar and ebb shoal. This relatively narrow deposition area results from an enhanced structural expression of these two morphological features as the system migrates in deeper water, rather than overall vertical accretion (Figure 2). More specifically,
8
this localised deposition area underlines (1) the narrow, offshore, lateral updrift bar that individualised from the broad, near-shore, shallow lateral complex (i.e., the flank of the O’Bril bank), and (2) the development of large sub-parallel sand bars over the migrating ebb shoal (see Figure 2).
Figure 3. Vertical difference maps indicating the areas with more than 1 m of erosion (dark grey) and
deposition (light grey). For the top raw (1973 to 1986), the time interval between the compared maps is 2 to 5 years; it is set to 9 to 10 years for the bottom raw (1986-2014) because morphological changes were at a lower rate during this period.
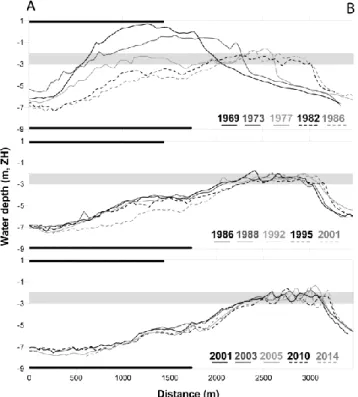
The along channel bathymetric profiles confirm that the ebb shoal acquired rapidly its overall morphology, around 1982-1986 (Figure 4), due to the large sand supply from the O’Bril bank. Between 1986 and 2001, the bathymetry of the ebb shoal was relatively smooth, with an average depth of -2 to - 3 m (ZH); in 2014, the water depth was similar in average, although with a higher variability due to the presence of (crests and troughs of) sand bars. These sub-parallel bars started to develop around 2003 along the selected cross-section, and reached 1.50 m in height and 200-400 m in wavelength, with no clearly predominant cross profile asymmetry. They seem to be very dynamic features as they exhibit variable position and size both spatially and temporally. Also, they probably achieve a maximum size relatively quickly after formation (a couple of years or less) since the largest bar of the time series was observed in 2005 (Figure 4; see also Figure 2). The largest bar of each bathymetric profile is located preferentially at the external (seaward) border of the ebb shoal (Figure 4). These characteristics indicate that these bars are breaker-bars formed under wave action (see Grasmeijer and L. C. van Rijn 1998). These features have also been described at other similar settings such as the Shinnecock ebb shoal (see Figure 3 in Buonaiuto and Bokuniewicz 2008), although their (large) dimension and number seem particular to the Guadiana ebb shoal. Importantly, the shallow water depth over the ebb shoal (and thus the need for dredging) is not due to a general vertical growing of the shoal but to the development of these breaker-bars.
The bathymetric profiles also evidence a quite stable water depth at the inlet channel from 1986 onwards, except for the large scouring (more than 1.5 m, locally) that occurred between 1995 and 2001 (Figure 4). This erosive event results probably from several very large floods that took place at the end of the 90s’ in the Guadiana river basin, in particular in January 1996 and in February 1998, when the (daily average) river discharge reached up to 10,000 m3/s, about the double of the second
9
highest discharge measured since 1950 (see Figure 10 in Garel et al. 2014). In average, the inlet scoured about 400 m seaward between 1986 and 2014 (order of 15 m/yr). This is more than the migration of the ebb shoal, estimated about 250 m for the same period (order of 10 m/yr), which is therefore getting narrower through time. Again, this narrowing expresses the enhanced morphological expression of the structures that developed in response to the jetty construction as they migrate in deeper water.
Figure 4. Evolution of a bathymetric cross-section along the inlet channel (A-B) between 1969 and 2014. The location of the cross-section is shown in Figure 2 (2014). The grey area indicates water depths between 2 and 3 m (referred to ZH). The thick black lines on top and bottom of each graph indicate the extension of the east and west jetty, respectively
4.2. PROGRADATION OF THE UPDRIFT COAST
Before jetty construction, the HWL was prograding along the studied beaches (Figure 5a), as described previously by Gonzalez et al. (2001). This progradation was due to the trapping of the littoral drift by the inlet and to the related growth of the West flank of the O’Bril bank. The average accretion rate until 1969 was about 1.5 m/yr and 4.5 m/yr for the West and Main beaches, respectively. The HWL was however stable or even retreating during the years preceding inlet stabilisation (Figure 5). The construction of the jetties and groin in 1972-74 was associated to a resumption of progradation at both beaches.
The HWL advance at the West beach was about 70 m between 1972 and 2012 (Figure 5a), at an overall rate similar than before groin construction. Accumulation against the groin was relatively small and short-lived (about 50 m, in between 1972 and 1977; Figure 5a). This progradation was followed by a ~30 m retreat in 1980-1985, the HWL advancing again up to its 1980 position in 1985-87. After a long period (18 years) of stability, a third episode of progradation took place in 2005-2007 (40 m). Therefore, the HWL position in 2005 was similar to the one in 1977. This evolution clearly shows that from 1977 (or earlier) the groin was filled with sand to capacity, and the littoral drift was effectively transported from the West beach to the Main beach.
10
Figure 5. Average evolution of the HWL (m) referred to its position in 1976: a) at the West beach (grey) and Main beach (black) from 1940 to 2011; the light grey rectangle indicates the period of construction of the jetties and groin; no data was available at the West beach in 1986; b) for several (averaged) transects: transects 3-4 (solid black), 5-8 (solid grey), 9-10 (light grey), 11-13 (dashed grey) and 14-17 (dashed black), from 1972 to 2011. Note that (a) and (b) have distinct vertical and horizontal axes. HWL advance is positive and retreat is negative.
At the Main beach, a significant post-jetty HWL advance of ~180 m in 20 years (i.e., ~9 m/yr) resulted principally from two periods of rapid accretion (Figure 5a): (1) 50 m in 1976-1978, right after jetty construction; and, (2) 110 m in between 1985 and 1996. The beach has been relatively stable since then, except for a third small (20 m) progradation in 2005-2007. These (three) progradation events were also recorded at the West beach, although of smaller amplitude and duration, apart from the last event (larger HWL advance at the West beach; Figure 5a).
Figure 6. Ortho-photographs showing the position of the shoreline and submerged structures between in 1976, 1980, 1985, 1986, 1987 and 1991.
11
The first progradation event at the Main beach was localised near the jetty (Figure 5b). It results from the infilling of a small basin of about 125,000 m2, trapped between the eastern spit of the beach and the jetty (Figure 6, 1976-1980). The dynamics of this spit has been described by Gonzalez et al. (2001). During this event, the western portion of the Main beach was stable (Figure 5b). The second progradation event was rather different as it affected the entire Main beach. Indeed, the HWL advanced 20-50 m for all transects in between 1985 and 1986 (Figure 5b). Then, the accretion was momentarily localised at east, against the jetty (Tr. 14-17, 1986-1987, on Figures 5b). However, this area was strongly eroded during the following years (1987-1991) while, at the same time, a large HWL advance was again observed along the westward portions of the beach (Figure 5b, Tr.3 to 13). This evolution indicates that sand accumulated against the jetty was redistributed westward during this period. In agreement, as sand was blocked by the groin, the HWL of the Main beach was located seaward from the one of the West beach in 1991 (Figure 6). This situation has maintained until 2005, when the third progradation event was observed at the West beach, but affected mainly the middle part of the Main beach (only Tr. 9 to 13 display a significant - i.e., >20 m -progradation of 30-35 m, Figure 5b).
5. DISCUSSION
5.1. CONTRIBUTION OF CROSS-SHORE TRANSPORT TO UPDRIFT PROGRADATION
Accretion is generally observed along updrift coasts in response to jetty construction where there is a dominant longshore transport direction (e.g., Hapke et al. 2013). This accretion is typically attributed to littoral drift accumulation against the jetty, such as the volume of sand accumulated is often used to determine regional littoral transport rates (U.S. Army Corps of Engineers 2002). At the Guadiana inlet, our data show a large sediment accumulation after jetty construction, in agreement with the results of Gonzalez et al. (2001). The detailed analysis presented here, integrating both aerial photographs and bathymetric maps, allows discussing the cross-shore contribution to this post-jetty shoreline evolution.
On the one hand, the large sand accumulation at the jetty started in 1976 only (and not earlier), because the littoral drift was impounded at the groin before, thus illustrating the significance of the longshore transport in the area. From that time, considering a low longshore transport rate estimate (100,000 m3/yr), a couple of years only is required for the littoral drift to fill up the small basin near the jetty with 2 m of sand (and for the HWL to advance to its position in 1980). It seems therefore reasonable that longshore transport has contributed significantly (or predominantly) to infill this basin between 1976 and 1980. On the other hand, the ~350,000 m2 broad and shallow near shore area adjacent to the west jetty, i.e. the western flank of the O’Bril bank, has been significantly eroded (more than 1 m, locally) right after jetty construction (see 1973 and 1977 on Figure 2; Figure 3, 1973-1977). This erosion is probably the result of various factors, including: wave reflection by the jetty; a reduction of the littoral drift due to retention against the groin (at least until 1977); and, enhanced exposure to wave action due to the scouring of the inlet channel (compare 1969 with 1973 and 1977 on Figure 2). The eroded material from this area could have contributed to the well developed shore-parallel shoal which is identified on the 1977 bathymetry (Figure 2) and on the ortho-photographs of 1976 and 1980 (Figure 6). However, this feature migrated landward (200-250 m between 1976 and 1980) and was as such more likely the result of the strong erosion (> 1 m) of the large area (150,000 m2) located immediately seaward (seaward face of the bank flank; Figure 3). Thus, it is strongly suspected that cross-shore transport of sand (from the western flank of the bank near the beach) has also contributed to the progradation of the HWL near the jetty in 1976-1980. Consequently, the alongshore transport rate computed by Gonzalez et al. (2001) based on accumulation at supratidal areas from 1974 to 1980 might be overestimated. These authors noted however, that they considered an average dune high of 4 m above mean sea level, probably lower than in reality, such as their longshore rate represents a low estimate. This could explain why their value is in general agreement with other regional estimates.
12
The cross-shore contribution to HWL advance is more obvious during the second progradation event at the Main beach (1985-1994). From 1980 onwards, the NW tip of the nearshore bar was sweeping the west sector of the Main beach as it was migrating landward (Figure 6). As described along the Guadiana downdrift coast (Garel et al. 2014) and at other settings (e.g., Gaudiano and Kana 2001; Kana et al. 1999), the attachment point of the bar to the beach formed a bulge limited by eroded areas (1980, Figure 6). Typically, this feature develops locally because of wave refraction around the attaching bar, resulting in convergent sand transport along the beach located in the lee of the bar (FitzGerald 1988; Kana et al. 1999; Kana et al. 1985). This process was first discussed by FitzGerald and Hayes (1980) who called it the “tombolo effect”. The main effect in terms of progradation is when the shoal attaches completely to the beach. The bathymetric maps (1977 to 1988, Figure 2) and photographs (1985 to 1991, Figure 6) document such progradation along the Main beach, produced by the attachment of the bar. This process has lead to the unexpected (seaward) position of the Main beach in comparison with the West beach (1991, Figure 6). It took more than 15 years for the Main beach to recover a morphology which is in agreement with the dominant littoral transport direction, demonstrating the leading contribution of the cross-shore transport for this (second) progradation event.
The third progradation event, larger at the West beach than at the Main beach, suggests that large volumes of sand can be supplied sporadically to the area from the west. The period 2005-2007 was not a peculiar one in terms of number and intensity of storms (Almeida et al. 2011). This progradation event relates probably to the mode of longshore transport along this stretch of the coast (i.e., updrift of the Main beach). It suggests that there are sporadic inputs of large volume of sand that produce significant (> 20 m) and rapid (order of a year) beach progradation, locally. In particular, the observations of aerial photographs (unpublished data) shows the recurrence of shore sub-parallel shoals migrating eastward that eventually attach to the beaches (updrift of the study area). In any case, this progradation event is not linked to the erosion of the historical delta and associated cross-shore contribution which is under the scope of the present paper.
5.2. SAND BYPASSING RE-ESTABLISHMENT
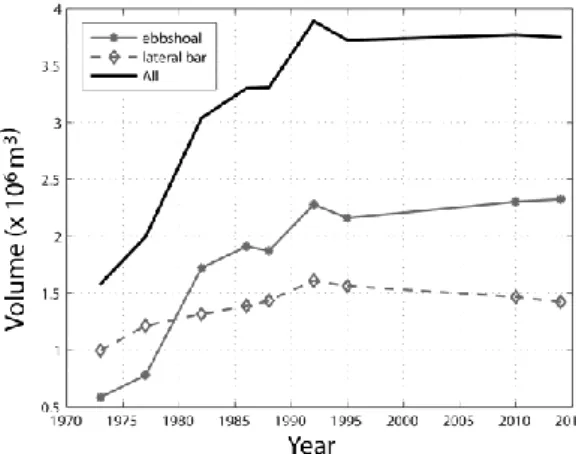
After inlet stabilisation, it usually takes decades for large ebb-tidal deltas to achieve a morphological equilibrium in agreement with the new hydrodynamic conditions. At these mature systems, sand is transported from the updrift to the downdrift coast of the inlet along the outer delta, often via bypassing bars localised on each side of the ebb shoal and connected to the (updrift and downdrift) beaches (see Carr and Kraus 2001; Kraus 2000). The ebb shoal is generally the first morphological feature to develop in response to jetty construction. Typically, this feature is produced by the accumulation of the littoral drift that deposits in the inlet channel and of the material resulting from the artificial breaching of the system (plus estuarine exports at some settings). Such development has been observed at the Guadiana ebb delta (Figure 2). The accumulated volume of sand at the modern ebb shoal through time is computed by comparing the bathymetry of 1969 with more recent ones with (Figure 7). Results show a rapid development until 1982, as previously observed, and a stabilisation of the ebb shoal volume around 2.3 Mm3 from 1995 onwards.
The temporal evolution of the ebb shoal volume indicates that a progressively larger fraction of the sediment input was transported off the shoal. Typically, this transported material produces the bypassing bars through the action of breaking waves and wave-induced currents (Kraus 2000; Kraus 2009). At the Guadiana ebb delta, however, the updrift lateral bar developed simultaneously with the ebb shoal, as they both result from the reworking of a large local sand supply constituted by the O’Bril bank. Volume computations confirm that the updrift bar grew in size right after jetty construction, rather than after the ebb shoal was developed sufficiently (Figure 7). The bar reached a maximum volume of 1.5 Mm3 in 1992 (i.e., also when the ebb shoal volume stabilised). At that time, the bar started to be well distinguished from the shallow lateral complex (West flank of the O’Bril
13
bank; Figure 2) thus constituting a preferred pathway for sand towards the ebb shoal. Before 1992, the water depth was shallow enough (<-1 m, ZH) for sand to be transported from the updrift beach into the inlet channel through the lateral complex (Figure 2), because the jetty did not cut entirely through the West flank of the O’Bril bank (see 1969, Figure 2). Part of the sand transported at the updrift beach by both longshore and cross-shore processes was therefore contributing to the development of the ebb shoal and updrift bar.
Figure 7. Volume of the ebb shoal (solid grey line), lateral updrift bar (dashed grey line) and ebb shoal plus lateral updrift bar (black solid line), computed as the bathymetric difference with the map of 1969. For the delimitation of the ebb shoal and lateral bar areas, see the 2014 map on Figure 2.
The total volume of the updrift bar and ebb shoal is remarkably stable (~3.7 Mm3) since 1995 (Figure 7). This indicates that both features have reached a morphology which is close to equilibrium and that most of the sand from the updrift beach is effectively transported to the downstream side of the inlet. Walton and Adams (1976) have shown that the equilibrium volume (Ve, m3) of the entire ebb shoal complex (ebb shoal, plus updrift and downdrift lateral bars) is approximately linearly proportional to the tidal prism (P, m3), with:
𝑉𝑒 = 8 × 10⁻⁵× (P × 35.3)1.23 (1)
Based on eq. (1) and considering the tidal prism at spring tide (38 106 m3; Garel, unpublished data; see also Morales, 1993), Ve is about 14 Mm3 at the Guadiana ebb delta. The time required to reach this equilibrium volume can be estimated from the longshore transport rate, using simplified conditions (see Kraus 2000). In particular, a linear form of bypassing is assumed, which seems to be verified at the updrift portion of the study area. This analytical approach indicates that 50 % only of the equilibrium volume would be achieved in 2027 if a longshore transport of 180,000 m3/yr is considered. With the addition of 100,000 m3/yr corresponding to potential estuarine exports (Portela 2006), 80% of this volume would be reached in 2055. Note that with lower Ve, such as 8 Mm3 corresponding to the tidal prism at neap tide (25 m3), a long time is still predicted for the ebb delta to reach equilibrium (e.g., 80 % of Ve in 2035). Since the updrift bar and ebb shoal have a stabilised volume, the growing of the delta should be observed on its eastern portion, in particular with the development of lateral downdrift structures. However, this area is characterised by the overall collapse of the old delta; in particular, between 1978 and 2010 accretion was restrained to the ebb shoal, while its adjacent downstream area was under severe (> 1 m) erosion (see Figure 4 in Garel et al., 2014). Combined with the results of the present study, this downdrift erosion suggests that bypassing was already re-established in 1995. It is possible that the breaker bars on top of the ebb shoal are presently developing into lateral downdrift bars due to the reworking of local sediment (similar to observations at the updrift side). In any case, the main point is that the volume of the entire ebb delta is already close to equilibrium. There is therefore a large discrepancy between the observed time required to reach this state (~20 years) and the predicted one considering littoral transport alone (> 50 years, at least). This indicates that at some settings, local
14
source supply from the collapsing delta should also be considered when evaluating the morphological response of the ebb delta to jetty construction. Through a rapid morphologic reorganisation of the delta in response to the post-jetty hydrodynamic conditions, this large source of material enables early re-establishment of sand bypassing, with important implications for the planning of coastal management strategies.
6. CONCLUSION
The present study shows that the erosion of ebb-tidal deltas and migration of their shoals in response to jetty construction might have a significant effect on the updrift coastline evolution. The availability of a large sand source inherited from the pre-delta morphology may lead to a significant contribution of cross-shore transport processes upon updrift beach progradation. In particular, the largest progradation observed along the Main beach at the study area was produced by the welding of a large shoal to the coast. The collapse of an old delta may therefore enhance updrift progradation, being in some cases more relevant than longshore transport in the process of sand accumulation against the updrift jetty. Consequently, the evaluation of longshore transport rate based on sand accumulation against jetty may be inadequate at ebb-tidal deltas where artificial bank breaching for inlet stabilisation has segregated large volume of sand on its updrift side. Such estimate should consider the evolution of the shoreline together with the dynamics of the morphological structures localised on the near shore area.
The erosion of the historical delta may also lead to the development of morphological features that would develop much slower - or not at all - without the availability of this large local near shore sand supply. In particular, the simultaneous development of an ebb shoal and lateral updrift bar, as observed in this study, is distinct from the typical morphological response of ebb-tidal delta to jetty construction. It is also found that the delta evolution is much faster than the computed one if sand inputs from alongshore transport solely are considered. As such, the pre-jetty delta morphology may promote the re-establishment of sand bypassing much earlier than predicted, with important implications with respect to the management of jettied inlets and their adjacent coasts. When jetties breach across broad systems, analytical models should include the local source of sand for the estimation of the volumetric evolution of the ebb-tidal delta. Future studies should explore how to account for these local sources when computing the volumetric evolution of the entire system.
Acknowledgments
The following institutions in Portugal are acknowledged for providing some of the bathymetric maps used in this study: Ministry of Public Works, Transport and Communications (MOPTC); Hydrographic Institute (IH); and, Port and Maritime Transport Institute (IPTM).
Bibliography
Almeida, L.P., Ó. Ferreira, M.I. Vousdoukas and G. Dodet. 2011. Historical variation and trends in storminess along the Portuguese South Coast. Nat. Hazards Earth Syst. Sci. 11: 2407-2417. Boothroyd, J.C., 1985. Tidal inlets and tidal deltas. In: R.A. Davis Jr. (Editor), Coastal Sedimentary
Environments. Springer-Verlag, New York, pp. 445-532.
Bruun, P. 1995. The development of downdrift erosion. Journal of Coastal Research 11: 1242-1257. Buijsman, M.C., G.M. Kaminsky and G. Gelfenbaum. 2003. shoreline change associated with jetty
construction, deterioration and rehabilitation at Grays Harbor, Washington. Shore & Beach 71: 15-22.
Buonaiuto, F.S. and H.J. Bokuniewicz. 2008. Hydrodynamic Partitioning of a Mixed Energy Tidal Inlet. Journal of Coastal Research 24: 1339-1348.
Burningham, H. and J. French. 2006. Morphodynamic behaviour of a mixed sand–gravel ebb-tidal delta: Deben estuary, Suffolk, UK. Marine Geology 225: 23-44.
15
Byrnes, M.R. and M.W. Hiland. 1995. Large-scale sediment transport patterns on the continental shelf and influence on shoreline response: St. Andrew Sound, Georgia to Nassau Sound, Florida, USA. Marine Geology 126: 19-43.
Carr, E.E. and N.C. Kraus, 2001. Morphologic Asymmetries at Entrances to Tidal Inlets, US Army Corps of Engineers.
Chang, H. 1997. Modeling Fluvial Processes in Tidal Inlet. Journal of Hydraulic Engineering 123: 1161-1165.
Cheung, K.F., F. Gerritsen and J. Cleveringa. 2007. Morphodynamics and Sand Bypassing at Ameland Inlet, The Netherlands. Journal of Coastal Research106-118.
Cooper, J.A.G., J. McKenna, D.W.T. Jackson and M. O'Connor. 2007. Mesoscale coastal behavior related to morphological self-adjustment. Geology 35: 187-190.
Costa, M., R. Silva and J. Vitorino, 2001. Contribução para o estudo do clima de agitação marítima na costa portuguesa, Proceedings of 2as Jornadas Portuguesas de Engenharia Costeira e Portuária. International Navigation Association PIANC, Sines, Portugal.
de Mers, M.N., 2008. Fundamentals of Geographical Information Systems. John Wiley & Sons, Inc. de Swart, H.E. and J.T.F. Zimmerman. 2009. Morphodynamics of Tidal Inlet Systems. Annual Review
of Fluid Mechanics 41: 203-229.
Dean, R.G. and P.A. Work. 1993. Interaction of navigation entrances with adjacent shorelines. Journal of Coastal Research 18: 91–110.
Dolan, R. and B. Hayden, 1983. Patterns and prediction of shoreline change. In: P.D. Komar (Editor), Handbook of Coastal Processes and Erosion. CRC Press, Boca Raton, Florida, pp. 123-149. Elias, E., M. Stive, H. Bonekamp and J. Cleveringa. 2003. Tidal inlet dynamics in response to human
intervention. Coastal Engineering Journal 45: 629-658.
Elias, E.P.L. and A.J.F. van der Spek. 2006. Long-term morphodynamic evolution of Texel Inlet and its ebb-tidal delta (The Netherlands). Marine Geology 225: 5-21.
FitzGerald, D.M. 1984. Interactions between the ebb-tidal delta and landward shoreline: Price Inlet, South Carolina. Journal of Sedimentary Petrology 54: 1303-1312.
FitzGerald, D.M., 1988. Shoreline erosional-depositional processes associated with tidal inlets. In: D.G.A.a.L. Weishar (Editor), Hydrodynamics and Sediment Dynamics of Tidal Inlets. Lecture Notes Coastal Estuarine Studies. Springer, New York, pp. 186-224.
FitzGerald, D.M. 1996. Geomorphic variability and morphologic and sedimentologic controls on tidal inlets. Journal of Coastal Research47-71.
FitzGerald, D.M., I.V. Buynevich, R.A. Davis Jr and M.S. Fenster. 2002. New England tidal inlets with special reference to riverine-associated inlet systems. Geomorphology 48: 179-208. FitzGerald, D.M. and M.O. Hayes, 1980. Tidal inlet effects on barrier island management. In: B.L.
Edge (Editor), Coastal Zone ‘80. American Society of Civil Engineers, New York, pp. 2355-2379.
FitzGerald, D.M., N.C. Kraus and E.B. Hands, 2000. Natural mechanisms of sediment bypassing at tidal inlets, US Army Corps of Engineers.
Galgano, F.A. 2007. Types and causes of beach erosion anomaly areas in the U.S. East coast barrier island system: stabilized tidal inlets. Middle States Geographer158-170.
Garel, E. and Ó. Ferreira. 2011. Effects of the Alqueva Dam on Sediment Fluxes at the Mouth of the Guadiana Estuary. Journal of Coastal Research SI 64: 1505-1509.
Garel, E. and Ó. Ferreira. 2013. Fortnightly Changes in Water Transport Direction Across the Mouth of a Narrow Estuary. Estuaries and coasts 36: 286-299.
Garel, E., L. Pinto, A. Santos and Ó. Ferreira. 2009. Tidal and river discharge forcing upon water and sediment circulation at a rock-bound estuary (Guadiana estuary, Portugal). Estuarine, Coastal and Shelf Science 84: 269-281.
Garel, E., C. Sousa, Ó. Ferreira and J.A. Morales. 2014. Decadal morphological response of an ebb-tidal delta and down-drift beach to artificial breaching and inlet stabilisation.
16
Gaudiano, D.J. and T.W. Kana. 2001. Shoal bypassing in mixed energy inlets: Geomorphic variables and empirical predictions for nine South Carolina inlets. Journal of Coastal Research 17: 280-291.
Gonzalez, R., J.M.A. Dias and Ó. Ferreira. 2001. Recent rapid evolution of the Guadiana Estuary mouth (southwestern Iberian Peninsula) Journal of Coastal Research Proceedings of International Coastal Symposium 2000: 516-527.
Grasmeijer, B.T. and L. C. van Rijn, 1998. Breaker Bar Formation and Migration, Coastal Engineering, pp. 2750-2758.
Hansen, M. and S. Knowles, 1988. Ebb-Tidal Delta Response to Jetty Construction at Three South Carolina Inlets. In: D. Aubrey and L. Weishar (Editors), Hydrodynamics and Sediment
Dynamics of Tidal Inlets. Lecture Notes on Coastal and Estuarine Studies. Springer New York, pp. 364-381.
Hapke, C.J., M.G. Kratzmann and E.A. Himmelstoss. 2013. Geomorphic and human influence on large-scale coastal change. Geomorphology 199: 160-170.
Hayes, M.O., 1979. Barrier island morphology as a function of tidal and wave regime. In: S.P. Leatherman (Editor), Barrier Islands form the Gulf of St. Lawrence to the Gulf of Mexico. Academic Press, NY, pp. 1-27.
Hayes, M.O. 1980. General morphology and sediment patterns in tidal inlets. Sedimentary Geology 26: 139-156.
Hume, T.M. and C.E. Herdendorf. 1992. Factors controlling tidal inlet characteristics on low drift coasts. Journal of Coastal Research 8: 355-375.
Kaminsky, G.M., Ferland, M.A., Cowell, P.J., Moritz, H.R., Ruggiero, P., 2007. Shoreface response to sediment deficit, Coastal Sediments '07, pp. 633-646.
Kana, T.W., E.J. Hayter and P.A. Work. 1999. Mesoscale sediment transport at Southeastern U.S. tidal inlets: Conceptual model applicable to mixed energy settings. Journal of Coastal Research 15: 303-313.
Kana, T.W. and P.A. McKee, 2003. Relocation of Captain Sams inlet-20 years later, Coastal Sediments ‘03. World Scientist, pp. 12.
Kana, T.W., M.L. Williams and D. Stevens, 1985. Managing shoreline changes in the presence of nearshore shoal migration and attachment. In: A.N. York (Editor), Proceedings Coastal Zone 1985, pp. 1277-1294.
Komar, P.D. 1996. Tidal Inlet Processes and Morphology Related to the Transport of Sediments. Journal of Coastal Research 23: 23-44.
Kraus, N., 2006. Coastal inlet functional design: anticipating morphological response. In: ASCE (Editor), Proceedings Coastal Dynamics 05, Barcelona, pp. 13.
Kraus, N.C. 2000. Reservoir model of ebb-tidal delta evolution and sand bypassing. Journal of Waterway, Port, Coastal, and Ocean Engineering 126: 305-313.
Kraus, N.C., 2009. Engineering of tidal inlets and morphologic consequences. In: Y.C. Kim (Editor), Handbook of Coastal and Ocean Engineering. World Scientific, Singapore, pp. 867-901. Morales, J.A. 1997. Evolution and facies architecture of the mesotidal Guadiana River delta (S.W.
Spain-Portugal). Marine Geology 138: 127-148.
Morton, R.A. 1979. Temporal and spatial variations in shoreline changes and their implications, examples from the Texas Gulf Coast. Journal of Sedimentary Research 49: 1101-1111. Morton, R.A., T.L. Miller and L.J. Moore, 2004. National Assessment of Shoreline Change - part 1
Historical shoreline changes and associated coastal land loss along the U.S. Gulf of Mexico, U.S. Geological Survey, St. Petersburg, Florida, U.S.A.
Oertel, G.F. 1977. Geomorphic cycles in ebb deltas and related patterns of shore erosion and accretion. Journal of Sedimentary Research 47: 1121-1131.
Oost, A.P., P. Hoekstra, A. Wiersma, B. Flemming, E.J. Lammerts, M. Pejrup, J. Hofstede, B. van der Valk, P. Kiden, J. Bartholdy, M.W. van der Berg, P.C. Vos, S. de Vries and Z.B. Wang. 2012.
17
Barrier island management: Lessons from the past and directions for the future. Ocean & Coastal Management 68: 18-38.
Pope, J., 1991. Ebb Delta and Shoreline Response to Inlet Stabilization, Examples from the Southeast Atlantic Coast, Proceedings, 1991 Coastal Zone, National Oceanic and Atmospheric
Administration, pp. 643-654.
Portela, L. 2006. Sediment delivery from the Guadiana estuary to the coastal ocean. Journal of Coastal Research1819-1823.
Siegle, E., D.A. Huntley and M.A. Davidson. 2004. Physical controls on the dynamics of inlet sandbar systems. Ocean Dynamics 54: 360-373.
U.S. Army Corps of Engineers, 2002. Longshore sediment transport. In: U.S. Army Corps of Engineers (Editor), Coastal Engineering Manual 1110-2-1100, Part III-Chapter 2, Washington, D.C. Walton, T.L. and W.D. Adams, 1976. Capacity of inlet outer bars to store sand. In: ASCE (Editor), 15th