THE GLOBAL AIRLINE INDUSTRY: AN ASSESSMENT OF
THE IMPACT OF LOW-COST CARRIERS ON THE
TECHNICAL EFFICIENCY OF FULL-SERVICE AIRLINES
Bernardo Almeida Pinho
Dissertation submitted as partial requirement for the conferral of
Master in Economics
Supervisor:
Prof. Henrique Monteiro, ISCTE Business School, Departamento de Economia
- Spine –
TH
E
G
LO
B
A
L
A
IR
LI
N
E
I
N
D
U
S
TR
Y
:
A
N
EFF
IC
IEN
C
Y
A
S
S
ESS
M
EN
T
B
er
n
ardo
Alm
ei
d
a
P
in
h
o
i
Abstract
Since the emergence of the first low-fare airline, Southwest Airlines, we have witnessed the spread of the low-cost phenomenon in different regions of the world. The simplicity, the low fares and the focus on core business (flying) have been the critical basis for their success, and the concern of traditional operators who see their market positioning threatened. To remain competitive, full-service operators have been forced to redefine their business model.
With great interest in the innovative nature of low-cost carriers, literature has covered inter-business model comparisons of efficiency, as well as on the analysis of the strategies carried out by full-service to adapting to the increased competition. However, there seems to be no study on the impact of low-cost operators on the technical efficiency of full-service airlines. Thus, this thesis aims to analyse the impact of the low-cost regional market share on the technical efficiency of full-service airlines domiciled in the same region. In order to pursue this analysis, a two-stage Data Envelopment Analysis was implemented. Initially, bootstrapped efficiency scores were estimated for a set of 137 passenger airlines. Subsequently, the estimated efficiency measures were used as a dependent variable in a truncated bootstrap regression to identify the determinants of the technical efficiency. Results suggest that larger low-cost market shares are associated with lower input uses for the same full-service carriers’ output levels based on that region. This relationship might be explained by the adoption of better management practices that approach the full-service model to the low-cost model.
Keywords: Two-stage Data Envelopment Analysis; Air transportation; Low-cost and
full-service carriers.
ii
Resumo
A criação da primeira companhia aérea de baixo-custo, a Southwest Airlines, impulsionou o desenvolvimento mundial de tantas outras no sector da aviação. A simplicidade, os preços baixos e o foco no principal objetivo da atividade (voar) têm sido a chave do seu sucesso e, simultaneamente, uma ameaça às companhias aéreas tradicionais. Inevitavelmente, os operadores de serviço-completo têm vindo a realizar mudanças no seu modelo de negócio para conseguirem manter-se competitivas.
Recentemente, alguns estudos têm-se focado na comparação entre os dois modelos de negócio e na análise das estratégias das transportadoras tradicionais ao aumento concorrencial. No entanto, parece não existir qualquer investigação acerca do impacto dos operadores de baixo-custo na eficiência técnica dos tradicionais. Assim, este estudo foca-se na relação entre a quota de mercado regional das transportadoras de baixo-custo e a eficiência técnica das companhias aéreas tradicionais sediadas nessa região. Para prosseguir esta investigação, foi implementada uma Análise por Envoltória de Dados de duas etapas. Inicialmente, foram estimadas as pontuações de eficiência técnica com métodos de bootstrap para 137 transportadoras de passageiros e, posteriormente, as pontuações foram usadas como variável dependente numa regressão bootstrapped truncada para identificar as fontes de eficiência. Os resultados sugerem que uma maior concentração de operadores de baixo-custo numa dada região está associada a uma menor utilização de recursos, por parte dos operadores tradicionais dessa região, para o mesmo nível de produção. Esta relação poderá ser explicada por práticas de gestão mais adequadas que aproximam o modelo tradicional do modelo de baixo-custo.
Palavras-chave: Análise por Envoltória de Dados de duas etapas; Transporte Aéreo;
Transportadores aéreos tradicionais e de baixo custo.
iii
Acknowledgements
Inevitably, these words are informal and not only related to my master thesis. They came about to thank all those who were directly involved in my complete college experience and to remember some lived experiences during that period.
First to my parents, who provided me access to excellent education and always gave me the choice to choose my path, as they were supporting me and trusting in my decisions. To my siblings, for lending me the laptop and making jokes about this thesis. To my grandmothers, for always being available to help.
To Bárbara, who had always stood by my side on the Entrecampos lunch route, on Telheiras Tuesdays, on the university parties with or without sentido de orientação, in Madrid or Helsinki, for text revisions and spreading confidence when most needed…
To my friend Afonso, hoping that these words will lead him to fulfil the promise of a trip to Madrid, as he proved to be a máno for life.
To my friend Duda, for all lifts, train journeys, celebrated masses and for emptying my wallet to drink coffee at Toni. To my friend Uva for all help, for sharing the
Tricampeonato and introducing Apache.
To all Antti Korppins, Lucinda, Luís and Mr Ambassador for sharing Finland experience.
To CVO, Canita and my athletes for friendship and giving me experience and expertise that I could not acquire in school.
To all my professors and ISCTE staff for gave me tools and better chances to follow a successful path.
The last, but for sure not the least, to my thesis supervisor, Professor Henrique
Monteiro, I would like to thank you for guiding me at this stage that ends a cycle of 5
years. Your splitting hairs style, fully availability to help and encouraging words were crucial to draw up this thesis with a seal of quality.
iv
Contents
1. Introduction ... 1
2. The Airline Industry ... 3
2.1. Market liberalisation... 3
2.2. The low-cost business model ... 9
2.3. International context: 2015 ... 11
3. Related Literature ... 15
3.1. Efficiency of the airline industry... 15
3.2. Developments in Data Envelopment Analysis ... 23
4. Database description ... 31
5. Methodology ... 33
5.1. Research question, hypotheses and objectives... 33
5.2. Inputs, outputs and explanatory variables ... 34
5.3. Efficiency scores estimation and sources of technical efficiency ... 36
5.3.1. Estimation of non-bias efficiency scores ... 38
5.3.2. Determinants of technical efficiency... 43
6. Empirical Results ... 47
7. Conclusion ... 59
8. References... 62
v
List of Figures
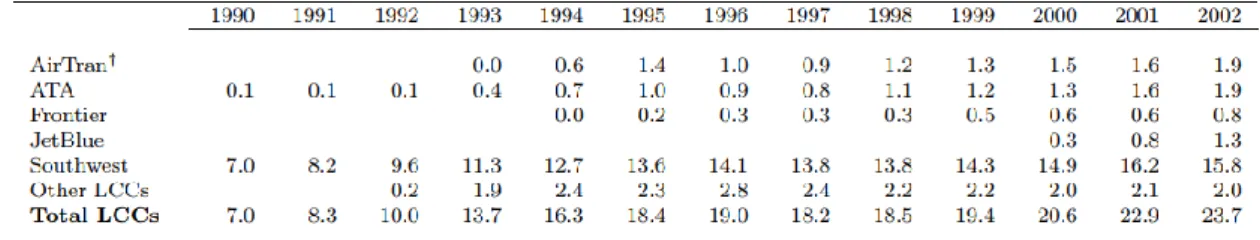
Figure 1: Low-cost Market Share in the US (% of total passengers) ... 3
Figure 2: Main Airline Alliances in 2015 ... 5
Figure 3: Hubs by Alliance in 2015 ... 6
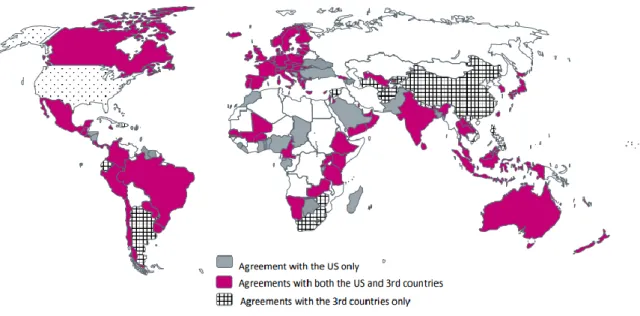
Figure 4: Bilateral Open-skies in 2016 ... 11
Figure 5: Percentage of Available Seats Offered by LCCs ... 12
Figure 6: Distribution of Operating Profit by Region 2010–2015 ... 14
Figure 7: CCR and BCC models ... 25
Figure 8: Data Envelopment Analysis Traditional Logic for a DMU performing its Activity ... 26
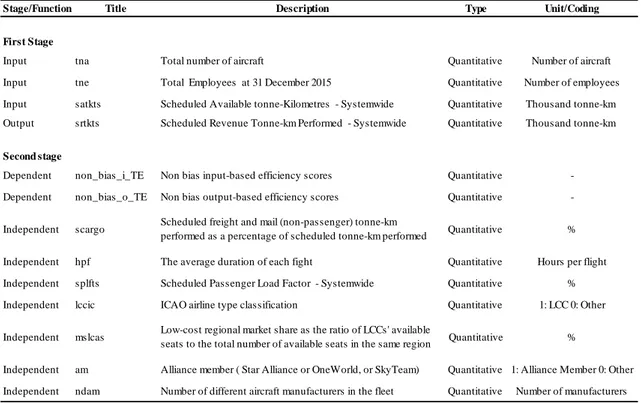
Figure 9: Description of the Variables used during the First and Second Stages ... 35
Figure 10: Descriptive Statistics ... 36
Figure 11: Descriptive Statistics of Second Stage Variables ... 44
Figure 12: Independence Tests P-values ... 48
Figure 13: Test of Returns to Scale in Input-based Technical Efficiency ... 49
Figure 14: Test of Returns to Scale in Output-based Technical Efficiency ... 49
Figure 15: Bootstrap bias estimate for original (non-corrected) technical efficiency scores ... 50
Figure 16: Weighted Averages according to the Business model adopted and the Region of Domicile ... 51
Figure 17: Matrix of Correlations between Covariates ... 53
Figure 18: The Impact of Low-Cost Market Share on the Technical Efficiency of FSCs ... 57
Figure 19: Description of Weighted Averages ... 70
Figure 20: Descriptive Statistics of Mean Normalised Input-Output Mix ... 71
Figure 21: Correlation matrix ... 71
Figure 22: Correlation between Weighted Load Factor and Efficiency scores... 76
Figure 23: First Input and Output-based models ... 76
vi
List of Tables
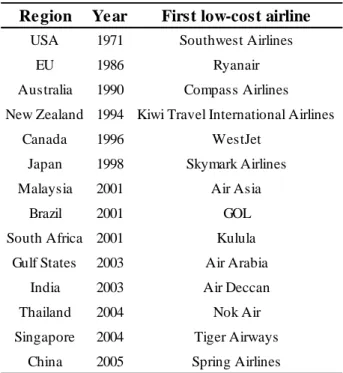
Table 1: The Beginning of Low-Cost Developments by Region ... 4
Table 2: Most Recent Mergers and Acquisitions in Passenger Airlines ... 7
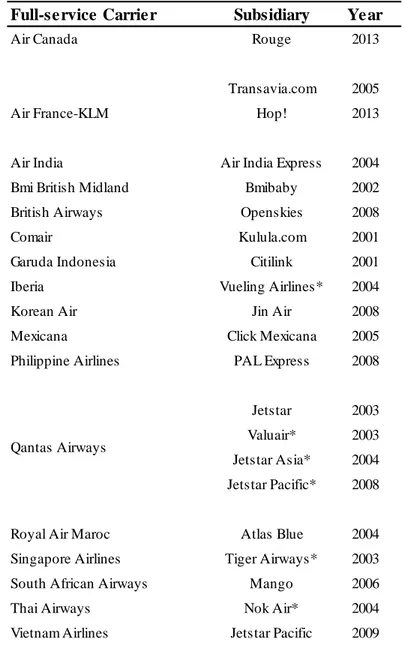
Table 3: Creation of Main Subsidiary Airlines ... 8
Table 4: Differences between Low-Cost and Full-Service carriers ... 10
Table 5: World Scheduled Systemwide Passenger and Freight Traffic by Region of Airline Domicile in 2015 ... 13
Table 6: Top 10 according to FTK and RPK (2015) ... 13
Table 7: Two Stage Efficiency Studies in the Airline Industry ... 29
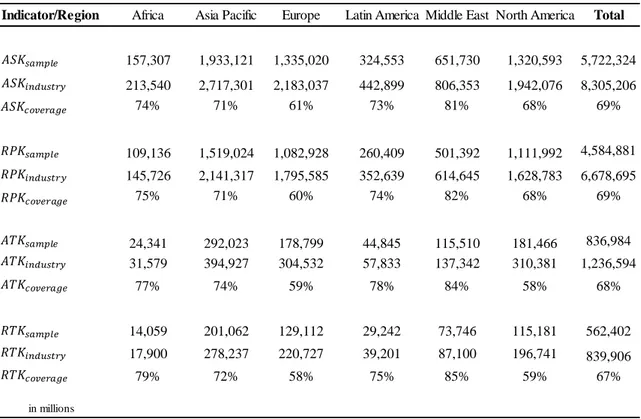
Table 8: Measuring Database Coverage ... 32
Table 9: Database according to the Business Model and Regional Characteristics ... 32
Table 10: Description of Second Stage Explanatory Variables ... 44
Table 11: List of Low-cost Carriers in the sample ... 67
Table 12: List of Full-service Airlines in the sample ... 68
Table 13: Description of Mean Normalised Input-Output Mix... 70
Table 14: Airline Ranking according to Technical Efficiency (non-bias input-based efficiency scores) ... 72
Table 15: Airline Ranking according to Technical Efficiency (non-bias output-based efficiency scores) ... 74
vii
List of Abbreviations & Glossary
This section presents a set of definitions and abbreviations, following the alphabetical order, frequently used throughout this thesis.
ATK – “Available Tonne Kilometres: The number of tonnes of capacity available for the carriage of revenue load (passenger and cargo) multiplied by the distance flown”
(ICAO, 2014)
ASK – “Available Seat Kilometres: The sum of the products obtained by multiplying the number of seats available for sale on each flight stage by the corresponding stage distance” (ICAO, 2014:20)
BCC - Banker, Charnes and Cooper (1984) CCR - Charnes, Cooper and Rhodes (1978) CRS – Constant Returns to Scale
DMU - Decision Making Unit DEA – Data Envelopment Analysis
Freight - Includes express and diplomatic bags but not passenger baggage FTK – Freight Tonne Kilometres
FSC – Full-Service Carrier
IATA – International Air Transport Association ICAO – International Civil Aviation Organization LCC – Low-cost Carrier
Mail – “Dispatches of correspondence and other objects carried on an aircraft, which have been dispatched by and intended for delivery to postal administrations”
(European Union, 1995)
NDEA – Network Data Envelopment Analysis NIRS – Non-Increasing Returns to Scale
viii
PLF – “Passenger Load Factor: The revenue passenger-Kilometres as a percentage of the available seat-Kilometres” (ICAO, 2014:22)
PTE – Pure Technical Efficiency
Revenue Load for 1 Revenue Passenger: When no data is available, 100kg is the
standard weight suggested by ICAO (70% for the passenger and 30% for its checked baggage) (ICAO, 2014)
RPK – “Revenue Passenger Kilometres: Sum of the products obtained by multiplying the number of revenue passengers carried on each flight stage by the corresponding stage distance” (ICAO, 2014:17)
RTK - Revenue Tonne Kilometres: The revenue load in tonnes multiplied by the distance
flown (ICAO, 2014)
SBM – Slacks-Based Measure
Scheduled flights – “Flights scheduled and performed according to a published timetable, or so regular or frequent as to constitute a recognizably systematic series which are open to use by the public; extra flights occasioned by overflow traffic from scheduled flights; and preparatory revenue flights on planned air services.”
(IATA, 2016:95)
Stage Length – The distance travelled by an aircraft from take-off to landing TE – Technical Efficiency
VRS – Variable Returns to Scale
WATS – World Air Transport Statistics
Weight Load Factor – “Tonne kilometres performed expressed as a percentage of tonne-kilometres available” (ICAO, 2014:29)
1
1. Introduction
What is globalisation? Are we living in a global world? The world is becoming smaller as the time goes by. People are becoming more and more connected through businesses, job market, migration, tourism, as with many other causes. Distance no longer exists virtually where the general access to the internet is guaranteed and physically is also vanishing as technology develops to provide greater and cheaper access and mobility. Many factors are responsible for this change, but none of this would happen if transport evolution were not fostering globalisation. Nevertheless, this phenomenon will keep on rolling as more developments are arising in the years to come. The Hyperloop will travel at over 1000 km per hour, offering a fuel-free service with much cheaper fares and faster travels than air transport. Maglev trains, self-driving smart cars and urban transport pods are also imminent to offer new means of transport for an increasing world population.
Air transport has been having a massive role in the change that we are currently living. For example, in 2016, airlines carried 3.696 billion passengers (The World Bank, 2017b) and freight around 196 billion of tonne-kilometres (The World Bank, 2017a), in line with the increasing trend in previous years. In the words of Tony Tyler, Director General and CEO of IATA, “There are 31.5 million seconds in a year. In 2015,
commercial airlines operated some 37.6 million flights. That means that on average, not a second went by when an aircraft was not landing or taking off somewhere in the world.”(IATA, 2016:3).
Particularly in this industry, a competitive environment is taking place with the emergence of low-cost operators with an innovative business model combining cheaper fares and quality service (Dobruszkes, 2006). These carriers have been bringing significant worldwide structural changes in this industry which are allowing them to be not only a cause but also an interesting consequence of globalisation (OECD, 2010). It was in this new nature of LCCs which is fighting FSCs market positioning that several studies had been carried out. In one hand, Barbot, Costa, and Sochirca (2008); Barros and Peypoch (2009); Lee and Worthington (2014) proved a relation between efficiency gains and the adoption of the low-cost model. On the other hand, Merkert and Morrell (2012); Pearson and Merkert (2014) preferred to focus their studies on the reactions taken by FSCs, such as mergers and acquisitions and subsidiary airlines, to compete with the growth of LCCs. However, none of the studies strived for measuring the widespread
2 impact of low-cost airlines on the efficiency of FSCs. Thus, this paper expects to contribute to the literature by performing an innovative study on the impact of the regional market share of low-cost on full-service airlines' technical efficiency based in the same region in 2015. At the same time, its relevance also lies in the extensive coverage that provides – 137 passenger airlines within the following worldwide regions: Africa, Asia Pacific, Europe, Latin America, Middle East and North America.
To perform this analysis, we implement a two-stage procedure based on Simar and Wilson (1998, 2000, 2007). In the first stage, we estimate non-bias technical efficiency scores for each airline by using Data Envelopment Analysis with a smooth heterogeneous bootstrap procedure. In the second step, non-bias estimates are regressed against some covariates to detect the sources of technical efficiency by using a bootstrapped truncated regression. By the end of this thesis, we expect to rank all airlines according to operational performance, compare regional technical efficiency, business models, as well understanding the sources of the technical efficiency of airlines. Finally, conclude if the market share of low-cost carriers affects full-service airlines’ efficiency domiciled in the same region.
The remainder of this investigation is organised into sections. Section 2 provides an overview of the global airline industry by looking to the process of global market liberalisation, to the features of the low-cost business model and the international context in 2015. The literature review is established in Section 3. Section 4 presents a description of the database, and the methodology for this study is described in Section 5. The results along with their discussion are available in Section 6, and Section 7 presents the main findings of this investigation.
3
2. The Airline Industry
2.1. Market liberalisation
This section aims to offer a historical review of the airline industry deregulation process before reporting on its current state since it is, to a large extent, the result of the development started in the 1970s.
It was in North America that the first market liberalisation wave appeared, driven by the emergence of the first world low-cost airline (Dobruszkes, 2006). The success of Southwest Airlines, a North American domestic operator created in 1973, inspired the conception of the US Airline Deregulation Act in 1978 which abolished the regulation of fares, routes and schedules in the whole US domestic market (Fu, Oum and Zhang, 2010), and this phenomenon quickly spread in the US (see Figure 1).
Figure 1: Low-cost Market Share in the US (% of total passengers)
Source: Ito and Lee (2003:4)
In 1995, the low-cost concept started its establishment in Europe with the emergence of Ryanair (Dobruszkes, 2006). A few years later, in November 1999, 44 African countries met in Ivory Coast to adopt the Yamoussoukro Decision where they agreed to implement an open skies air transport policy across the continent (Barros and Wanke, 2015). This intention was later reinforced by the Declaration on the Establishment of a Single African Air Transport Market signed in 2015. In South America, between 1991 and 1999, and in the Caribbean in 2008, deregulation initiatives were taken by the adoption of several agreements to harmonise local policies and to promote open air traffic and market access (ICAO Secretariat, 2016). It was also in 2008 that the Association of Southeast Asian Nations (ASEAN) adopted a Multilateral
4 Agreement on Air Services which supported air transport industry liberalisation in the region (Tan, 2010).
As we have noted, many regions in the world took steps to deregulate fares, routes and schedules in different time periods, but how are these decisions impacting the industry? The competitiveness generated by market liberalisation gave rise to structural changes in the airline industry in which the international spreading of the low-cost innovative business model, combining the focus on cost minimisation and the core activity of this business (flying) to provide lower fares, was the most relevant feature (see Table 1).
Table 1: The Beginning of Low-Cost Developments by Region
Source: Adapted from Gross and Lück (2016:6)
Traditional airlines, threatened by the emergence of low-cost carriers (LCCs), were forced to introduce some changes in their business models to remain in the market (OECD, 2010). One of the global steps that they took was the development of network alliances (see Figure 2) in which we can highlight Star Alliance, OneWorld, and SkyTeam (ICAO Secretariat, 2016). These alliance members transported more than 1.943 billion
Region Year First low-cost airline
USA 1971 Southwest Airlines EU 1986 Ryanair Australia 1990 Compass Airlines New Zealand 1994 Kiwi Travel International Airlines
Canada 1996 WestJet Japan 1998 Skymark Airlines Malaysia 2001 Air Asia
Brazil 2001 GOL South Africa 2001 Kulula
Gulf States 2003 Air Arabia India 2003 Air Deccan Thailand 2004 Nok Air Singapore 2004 Tiger Airways
5 passengers and represented 61.2% of the world total Scheduled Passenger–Kilometres in 2015 (IATA, 2016).
Figure 2: Main Airline Alliances in 2015
Source: Adapted from Gross and Lück (2016:6)
Looking for economies of density, maximise the use/capacity of the aeroplanes within a network of a given size (Dobruszkes, 2006), alliance members adopted the hub-and-spoke system presented in Figure 3. By implementing this system, all passengers excluding those whose origin or last stop is the hub, change for a second flight, transfer at the hub to their final destination (Cook and Goodwin, 2008). With this system, airlines benefit from cost savings through fewer aircrafts, flights with greater occupation, significant expansion of their network and the ease to create new routes that only require one new additional flight (Zanin and Lillo, 2013).
6 Figure 3: Hubs by Alliance in 2015
Alliance belongs each hub by the colour of the circle
Source: ICAO Secretariat (2016:20)
As a result of this competitive environment, a set of mergers and acquisitions, described in Table 2, was established in an attempt to stay competitive. Through these operations, airlines were hoping to leverage synergies on cost savings, outspread their networks, and increasing the yield through the reduction in the number of suppliers operating the same routes (Merkert and Morrell, 2012; ICAO Secretariat, 2016).
7 Table 2: Most Recent Mergers and Acquisitions in Passenger Airlines
Source: Adapted from Merkert and Morrell (2012); ICAO Secretariat (2016)
Me rging airline s Me rge d e ntity Ye ar
North America
Southwest Airlines/Morris Airlines Southwest Airlines 1993
AirTran Airways/Valujet AirTran Airways 1997
American Airlines/Reno Air American Airlines 1999
Delta Air Lines/Atlantic Southeast A. Delta Air Lines 1999
Delta Air Lines/Comair Delta Air Lines 1999
American Airlines/TWA American Airlines 2001
Republic Airways/Shuttle America Republic Airways 2005
US Airways/America West Airlines US Airways 2005
SkyWest/Atlantic Southeast Airlines SkyWest/ASA 2005
Delta Air Lines/Northwest Airlines Delta Air Lines 2009
Republic Airways/Midwest Airlines Republic Airways 2009
Republic Airways/Frontier Airlines Republic Airways 2009
United Airlines/Continental Airlines United Airlines 2010
Southwest Airlines/AirTran Airways Southwest Airlines 2011
US Airways/American Airlines American Airlines Group 2013-2015
Alaska Airlines/Virgin America Alaska Airlines 2016
Europe
British Airways/Delta Air Deutsche BA 1997
easyJet/GoFly easyJet 2003
Ryanair/Buzz Ryanair 2003
Air France/KLM Separate brands 2004
Lufthansa/Swiss Airlines Separate brands 2005
Lufthansa/SN Brussels Separate brands 2006
Air Berlin/LTU Air Berlin 2007
Lufthansa/bmi Separate brands 2009
Lufthansa/Austrian Airlines Separate brands 2009
Vueling/Clickair Vueling 2009
British Airways/Iberia International Airlines Group (IAG) 2011
Skyways/City Airlines Skyways 2011
Vueling International Airlines Group (IAG) 2012
Aer Lingus International Airlines Group (IAG) 2015
Asia/Pacific
Air India/Indian Airlines National Aviation Co. of India 2007
Kingfisher/Air Deccan Kingfisher 2008
China Eastern/Shanghai Airlines Separate brands 2009
South America
Copa/AeroRepublica Separate brands 2005
Avianca/TACA (in 2010 + AeroGal) Avianca-TACA 2009
Lan Airlines (+Aires in 2010)/TAM LATAM Airlines 2010
GOL/WebJet GOL 2011
8 Finally, one of the selected approaches taken by FSCs was also the creation of subsidiary airlines, airlines within airlines to diversify their supply. By using other brands (see Table 3), but offering a similar service to its low-cost competitors, FSCs were directly competing and, at the same time, avoiding the potential entrance of new firms in short-haul flights (Pearson and Merkert, 2014).
Table 3: Creation of Main Subsidiary Airlines
Source: Adapted from ICAO Secretariat (2016:28)
Full-service Carrier Subsidiary Year
Air Canada Rouge 2013
Transavia.com 2005 Hop! 2013
Air India Air India Express 2004 Bmi British Midland Bmibaby 2002 British Airways Openskies 2008 Comair Kulula.com 2001 Garuda Indonesia Citilink 2001 Iberia Vueling Airlines* 2004 Korean Air Jin Air 2008 Mexicana Click Mexicana 2005 Philippine Airlines PAL Express 2008
Jetstar 2003 Valuair* 2003 Jetstar Asia* 2004 Jetstar Pacific* 2008
Royal Air Maroc Atlas Blue 2004 Singapore Airlines Tiger Airways* 2003 South African Airways Mango 2006 Thai Airways Nok Air* 2004 Vietnam Airlines Jetstar Pacific 2009
* denotes minority shareholding Air France-KLM
9
2.2. The low-cost business model
Recently, LCCs have been pushing up such strong changes in the airline industry that it seems relevant to explore its way of working. The following overview focus on the primary low-cost model, on which the vast LCCs majority is still based on, as well on the recent changes to it.
The emergence of LCCs can be mainly explained by three factors: the cyclicality of the airline industry with a demand high dependent on the macroeconomic environment, costly tickets and worldwide market liberalisation processes (Dobruszkes, 2006). Low-cost airlines enjoy from a route system style different than the one traditionally used by FSCs which is, so far, the basis for their successful operation and recognition as an anti-cyclical product provider (Cook and Goodwin, 2008; IATA, 2006). By adopting a point-to-point scheme, which consists of direct flights independent of network connections, these airlines can have more flexibility in its flights’ schedule and, at the same time, make travel cheaper and faster due to quicker flights with higher occupation rates (Fageda, Suau-Sanchez and Mason, 2015). It is, of course, crucial to them to concentrate on short and medium haul routes generally operated within their continent of origin. For instance, Ryanair and EasyJet concentrate their principal operations in Europe, Southwest Airlines, and JetBlue flights are mostly in North and Central America (IATA, 2016). In contrast, as previously mentioned in Section 2.1, FSCs have been betting on hubs to increase their networks, reduce costs and provide more distant destinations as it is described in Figure
3.
Structuring flights mainly around secondary airports and maximising aircraft and staff productivities are also critical determinants to provide low-fares (ICAO, 2003). The use of secondary airports is particularly useful to save costs and reduce turnaround times given these landing fields tend to be cheaper and less crowded alternatives (Dobruszkes, 2006; Barbot, 2006). Also, as part of its business model, LCCs have been operating a single/few type fleet and pressing their staff to fly more and reduce rest time, even paying less than FSCs (Francis et al., 2006; Dobruszkes, 2006). Thus, economies of density in LCCs are achieved by maximising flying time for each aeroplane and, simultaneously, providing a budget on-board service (Francis et al., 2006; Dobruszkes, 2006). Some novelties were also introduced in airline distribution due to the low-cost model, such as reservations via the Internet and telephone, the online check-in, the advertising on board and additional premium services such as car rentals and hotel reservation. These changes
10 gave LCCs profit advantage for a period (Dobruszkes, 2006). Nowadays this is no longer a lead factor since FSCs also adopted it.
Similarly, as a result of the development of LCCs, we have been observing some changes, mainly in US and European operators, that are reinventing the original low-cost concept. The critical LCCs, such as Ryanair and Southwest Airlines, are now expanding their routes to largest airports, and some facilities that used to be secondary are now becoming the major ones as the Londoners Luton and Stansted (Dobruszkes, Givoni and Vowles, 2017). It will also be worthwhile to see the future developments of the most recent decisions taken by some European LCCs, as Ryanair and Norwegian, to enlarge their routes to long-haul flights between the Atlantic1.
In conclusion, Table 4 summarises full-service and low-cost business models’ characteristics to be clear to understand them.
Table 4: Differences between Low-Cost and Full-Service carriers
Source: Adapted from O’Connell and Williams (2005:260)
1 Available in http://metro.co.uk/2017/03/16/ryanair-to-offer-flights-to-new-york-6512888/.
Product features Low-cost carrier Full-service carrier
Brand One brand: low fare Brand extensions: fare+service Fares Simplified: fare structure Complex fare: structure+yield management Distribution Online and direct booking Online, direct, travel agent
Check-in Ticketless Ticketless, IATA ticket contract Airports Secondary (mostly) Primary
Connections Point-to-point Interlining, code share, global alliances Class segmentation One class (high density) Two class (dilution of seating capacity)
Inflight Pay for amenities Complementary extras Aircraft utilisation Very high Medium to high: union contracts
Turnaround time 25 min turnarounds Low turnaround: congestion/labour Product One product: low fare Multiple integrated products Ancillary revenue Advertising, on-board sales Focus on the primary product
Aircraft Single type: commonality Multiple types: scheduling complexities Seating Small pitch, no assignment Generous pitch, offers seat assignment Customer service Generally under performs Full service, offers reliability Operational activities Focus on core (flying) Extensions: e.g., maintenance, cargo
11
2.3. International context: 2015
Besides all world regions have been taking adequate measures to deregulate their air transport industries, the airline business faces different development stages across the globe (see Figure 4). Market liberalisation is, in some regions, a long-standing reality but for others is just an utopia2.
Figure 4: Bilateral Open-skies in 2016
Source: ICAO Secretariat (2016:3)
Obviously, this precludes that rivalry between LCCs and FSCs is not global homogeneous and, consequently, structural change is not worldwide uniform. In fact, world market share of RPK according to the business model was considerably unbalanced in 2015. Low-cost carriers represented 19% of the world RPK, and legacy operators had a 78% market share (IATA, 2016). The remaining value relates to the leisure airlines.
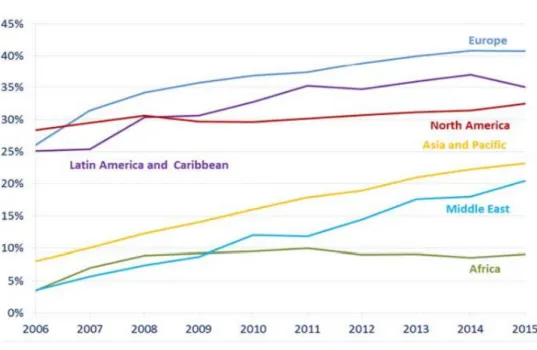
Although, there are some regions where the initiatives deployed have been acting by producing significant developments (see Figure 5). From 2006 to 2015, the market share of available seats offered by LCCs in Asia Pacific, Europe, and the Middle East had the largest increases across the globe. In Europe, after 15 percentage points (pp) rise between 2006 and 2015, 41% of the available seats are being supplied by low-fare airlines which is the largest regional low-cost market share in the world. The Middle East market
2 For a detailed introduction of air transport deregulation, check
https://www.icao.int/Meetings/a39/Documents/Overview_of_Regulatory_and_Industry_Developments_i n_International_Air_Transport.pdf .
12 share grew from 4% to 20% during the same period, and Asia Pacific’s increased from 8% to 23%. Although North America was the world leader in 2006, its growth was only four pp to 32% becoming the third low-cost global market share in 2015. Latin America and the Caribbean with a growth of 10 pp to 35% and Africa increment of 6 pp to 9% were intermediate growth performances between the previously analysed. Thus, the world market share of available seats provided by LCCs has grown from 21% to 30% during this period.
Figure 5: Percentage of Available Seats Offered by LCCs
Source: ICAO Secretariat (2016:27)
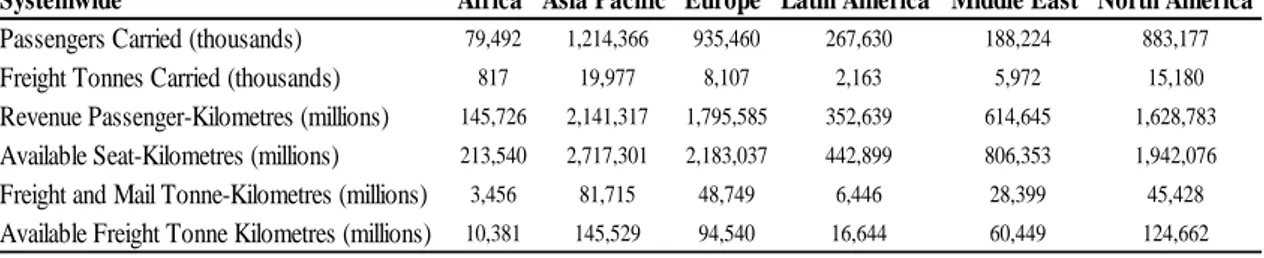
Turning now specifically to the world airline industry as a whole (see Table 5), in 2015 world airlines transported 3.561 billion passengers and 52.2 million freight tonnes (IATA, 2016). This record followed the significant positive trend registered in the previous years since in 2005, ten years before, airline operation only covered 2.139 billion passengers and 40.8 million tonnes (IATA, 2017). In this year, Asia Pacific airlines were the world leaders of air passenger and freight transportation. They moved around 1.214 billion passengers and 19,977 million freight tonnes that, together with Europe and North America operators, made available more than 82% of world seat-kilometres, and represent more than 80% of the world FTK and RPK.
13 Table 5: World Scheduled Systemwide Passenger and Freight Traffic by Region of
Airline Domicile in 2015
Source: Adapted from IATA (2016:35)
Air traffic was mainly concentrated within these regions, and in the links between them since more than 75% of the total RPK and FTK arose from flights in and across these regions (IATA, 2016). The Hartsfield-Jackson Atlanta International, the Beijing Capital, and the Dubai International were the airports handling more passengers, around 270 million passengers. Also, 12 million tonnes were moved in the top 3 cargo airports: the Hong Kong International, the Memphis International and the Pudong International (IATA, 2016). Naturally, the most prominent world operators, with the highest RPK and FTK were mainly originated in these regions. From Table 6, we can highlight that both tops are dominated by FSCs, although there are also two low-cost operators on the world RPK top-10, Southwest Airlines, and Ryanair.
Table 6: Top 10 according to FTK and RPK (2015)
Source: Adapted from IATA (2016:55-63)
Systemwide Africa Asia Pacific Europe Latin America Middle East North America
Passengers Carried (thousands) 79,492 1,214,366 935,460 267,630 188,224 883,177
Freight Tonnes Carried (thousands) 817 19,977 8,107 2,163 5,972 15,180
Revenue Passenger-Kilometres (millions) 145,726 2,141,317 1,795,585 352,639 614,645 1,628,783
Available Seat-Kilometres (millions) 213,540 2,717,301 2,183,037 442,899 806,353 1,942,076
Freight and Mail Tonne-Kilometres (millions) 3,456 81,715 48,749 6,446 28,399 45,428
Available Freight Tonne Kilometres (millions) 10,381 145,529 94,540 16,644 60,449 124,662
Rank Airline Millions of FTK Rank Airline Millions of RPK
1 Federal Express 15,799 1 American Airlines 320,813
2 Emirates 12,157 2 Delta Air Lines 302,512
3 United Parcel Service 10,807 3 United Airlines 294,970
4 Cathay Pacific Airways 9,935 4 Emirates 251,190
5 Korean Air 7,761 5 China Southern Airlines 189,186
6 Qatar Airways 7,660 6 Southwest Airlines 189,097
7 Lufthansa 6,888 7 Lufthansa 145,904
8 Cargolux 6,309 8 British Airways 140,780
9 Singapore Airlines 6,083 9 Air France 139,217
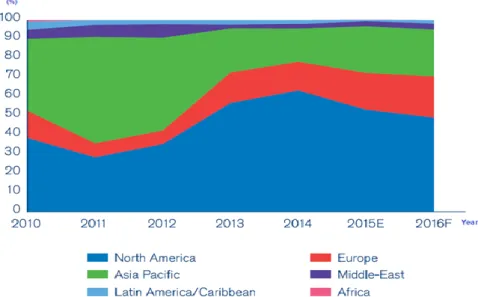
14 The distribution of the regional operating profit, between 2010 and 2015, described in Figure 6, followed the conclusions derived above since the significant three regions concentrate at least 90% of the world operating profit (IATA, 2017). In 2015, the highest share was from North American airlines, around 50% of the world amount. This positive signal for the North American industry is particularly interesting since it had a difficult time between 2001-2005 with a net aggregate loss of US$40 billion. The 9/11 attacks, the SARS virus and the emergence of LCCs triggered this crisis and forced US Airways, United Airlines, Delta, and Northwest to adopt cost-cutting measures and downsizing operations (Lee and Worthington, 2014). During the same period, Asia Pacific airlines had a 25% share in the same year, followed by European with a 20% share.
Figure 6: Distribution of Operating Profit by Region 2010–2015
Source: Adapted from IATA (2016:28)
It is important to note that, between 2010 and 2015, the world operating profit grew from 27.6 billion US$ to 61.1 billion US$ (IATA, 2017). During this period, the revenue of world airlines increased 28% achieving 720 billion US$ in 2015. Passengers transportation has been taking a leading role to generate income and, in 2015, represented 70% of the total amount, with cargo flights corresponding to 7% (IATA, 2017). On the expenditure side, we can denote a 22% increase reaching 659 billion US$ in 2015. Spending on fuel has been the most significant part of airline budget, and it raised 15% for this period, even with an average decrease of the crude oil price around 32% (IATA,
15 2017). In 2015, planes consumed 81 billion gallons, 175 billion US$, accounting for 26.5% of total expenses. Finally, fuel consumption, in the year concerned, produced 773 million tonnes of CO2 emissions (IATA, 2017).
3. Related Literature
3.1. Efficiency of the airline industry
As a result of the intense competition in this industry, where the growth of low- cost carriers is taking a serious role, and also of the current instabilities on the macroeconomic environment3 (Pearson and Merkert, 2014), studying efficiency is getting very attractive to the academic community. This curiosity is no less valid for full-service airlines, as a survival need, which have been adopting strategies to adapt to the recent low-cost growth, such as mergers and acquisitions (M&A), (Merkert and Morrell, 2012), and the creation of subsidiary airlines (Pearson and Merkert, 2014). However, it is nonetheless valid that studying airline efficiency is not new.
The first studies focused on the efficiency of the airline industry were based on the named Stochastic frontier analysis (SFA), the “econometric approach to efficiency
analysis”(Greene, 2008). SFA was introduced by Aigner, Lovell and Schmidt (1977);
Meeusen and Broeck (1977) and its application in the study of airline efficiency has become popular with Good, Nadiri and Sickles (1993). Good, Nadiri and Sickles (1993) used a Cobb-Douglas single output technology to carry out technical efficiency and productivity growth comparisons among the four most significant European carriers and eight American airlines using three alternative estimators: the generalised least square (GLS), the efficient instrumental variables (IV) and the within estimator. Data between 1976 and 1986 were analysed to identify potential efficiency gains of the European market liberalisation since this period coincided with the starting of a deregulation process in the US industry (see Section 2) and ends just prior the introduction of the first steps to deregulate the European market. Based on the geographical assessment, they concluded that European operators were nearly 15% less efficient than the American
16 carriers and if the gap was eliminated, European airlines would save $4.5 billion per year and reduce its employees by 42,000.
Coelli, Perelman and Romano (1999) used a translog production frontier to measure the efficiency of 32 international airlines between 1977 and 1990. The analysis was conducted under two alternative approaches. The first method assumed that shape of the production frontier was affected by environmental factors while the second accounted for direct environmental impact on the efficiency scores. The chosen environmental variables were representative of network conditions and geographical differences: the average stage length, the average load factor and the average aircraft size. Both approaches classified Asian-Oceanic airlines as being more technically efficient than European and North American airlines, and such disparities seemed to be the result of more favourable environmental conditions. Concerning to the methodology, both methods provided similar rankings, but with different technical efficiency scores.
Inglada et al. (2006) proceeded with the use of SFA by focusing their analysis between 1996–2000. This particular period reflected worldwide heterogeneous processes of liberalisation since it took into account a full-liberalised North American market, an almost entirely open European business and the Asian industry starting to deregulate. Two stochastic frontiers were estimated for cost and production functions to calculate economic (price) and technical efficiency scores. The evidence suggested very curious results on Asian airlines. Although they were operating in the less open market, these companies were the most efficient operators, which is in line with Coelli, Perelman and Romano (1999). It was therefore concluded that Asian industry was benefiting from the recent deregulation process.
More recently, Assaf (2009) executed a study focused on the technical efficiency of US airlines using a Bayesian random stochastic frontier model. The focus of this analysis was in 2003, 2005 and 2007 as an attempt to provide insights for private and public policy makers due to a severe period for the international airline industry where the oil price and the long-term influence of September 11 had a great responsibility. Results revealed that American airlines were not operating at the optimum level of scale and, at the same time, the average technical efficiency was decreasing to reach 69.02% in 2007.
17 Nowadays, Data Envelopment Analysis (DEA) is the most used approach to study efficiency in the airline industry. Unlike SFA, DEA is a non-parametric method whereby does not assume any functional form on the data to calculate efficiency estimations. Alternatively, efficiency is measured through a benchmarking process where a frontier, based on the efficient performers, is estimated, and the degree of inefficiency is measured according to the distance to the estimated efficient frontier. This method either assumes an input or output orientation that is, with the available technology, a firm is inefficient if, can increase its output level without increasing its input quantities, or may reduce its input levels without decreasing output (Coelli et al., 2005).
Barbot, Costa and Sochirca (2008) conducted an input-oriented efficiency, effectiveness and productivity comparison between low-cost and full-service airlines. With 2005 data, this study focused on 49 International Air Transport Association (IATA) members, from various regions around the world, and attempted to suggest which factors were responsible for efficiency differences among airlines. Main discoveries outlined that the vast majority of low-cost carriers were more efficient than full-service airlines and geography, as well the type of business model, might explain such disparities. Similarly, authors concluded that the most efficient airlines were operating in the US and Europe, although it seemed clear that North American carriers had lower efficiency inequalities than European operators.
In line with Barbot, Costa and Sochirca (2008), Barros and Peypoch (2009) focused on the efficiency gains of the low-cost model by using a two-stage DEA. The two-stage approach includes a first step which calculates traditional efficiency scores by solving a DEA model and, in the second stage, first step estimates are regressed against many hypothesised covariates to study efficiency drivers (Coelli et al., 2005). Thus, authors implemented an investigation to evaluate the operating performance of 27 airlines of the Association of European Airlines. Using data between 2000 and 2005, the authors estimated technical efficiency scores for both CRS, airlines operate at an optimal scale, and VRS, only compares airlines of similar sizes, scenarios by using physical and financial variables. In the second step, they looked for determinants of CRS efficiency scores with a bootstrap truncated regression. The second stage regression focused on the role of geographical and demographical factors, as well on the relevance of being an alliance member (Star Alliance, OneWorld, and SkyTeam), a low-cost carrier and a long-established carrier, to the technical efficiency of airlines. Primary conclusions revealed
18 significant efficiency differences on the sample despite accepting that European airlines were working at a notable scale efficiency and, by looking at the trend and its square, authors observed an efficiency improvement at a diminishing rate. From the second stage, it was concluded that the demographic dimension of the airline’s home country, belonging to an alliance (Star Alliance and OneWorld) and the adoption of a low-cost model were significant variables for the technical efficiency of air transporters.
Following the two-stage Data Envelopment Analysis (DEA), Greer (2009) implemented a study on the impact of unionisation on the technical efficiency of 17 US legacy airlines between 1999 and 2008. In the first stage, efficiency scores were estimated through an input-based measure, under constant returns, with inputs representing labour force, fuel consumption in gallons, as well seating capacity to produce Available Seat Miles. A Tobit regression analysis was undertaken in the second stage to assess sources of technical efficiency. On this basis, the average size of aircraft, the scale of hubs in the routes of airlines and the average stage length - the average distance travelled by each aircraft - were significant for the technical efficiency. Thus, unionised employees appeared to be not significant to the performance of airlines.
Also applying a two-stage model, Merkert and Hensher (2011) scrutinised the impact of fleet planning and strategic management decisions. In the first stage, bootstrapped and non-bootstrapped efficiency scores were calculated on 58 international airlines over the two fiscal years of 2007-2008 and 2008-2009. This approach followed an input orientation, under CRS and VRS since, according to the authors, output highly depends on the macroeconomic context. In the second phase, a series of random effects Tobit regressions investigated determinants of technical, allocative and cost efficiency using first-stage VRS DEA scores as a dependent variable. From these results, it was concluded that airline management should focus less on the distance travelled and the age of each aircraft, and more on other factors such as the number of different manufacturers in the fleet. Methodologically, in one hand, bootstrapping provided more accurate efficiency scores but, on the contrary, during the subsequent stage did not change the significance of explanatory variables, just changing results marginally.
Merkert and Morrell (2012) also interested in the competitive environment between full-service and low-cost operators, focused their paper to review literature and management perspectives in one of the strategies adopted by the FSCs to fight the growth of the low-cost model: airline mergers and acquisitions (M&A). The overall conclusion
19 of the study was that M&A benefits appeared to outweigh their potential cons. The authors pointed out, in one hand, that the main advantages of M&A were increases in efficiency and profitability, as well higher access to airports and aircraft which contributes to higher market share. On the other hand, it was clear that vital disadvantages came from different cultures of several companies, different IT systems and the risk of becoming too large to operate cost-efficiently (diseconomies of scale). Since diseconomies of scale were a disadvantage, this study also included an assessment of the scale efficiency of 66 international airlines during two fiscal years: 2007-2008 and 2008-2009. Results from bootstrapped efficiency scores pointed that optimal airline size ranges between 34 and 52 billion Available Seat Kilometres, and operating above 100 billion ASK, and surely over 200 billion ASK, was cost inefficiently.
The following year, Wu, He and Cao (2013) strived for the impact of wage levels and the share of international and cargo operations in the operational process of Chinese and non-Chinese airlines. In line with Barros and Peypoch (2009), input-based technical efficiency scores, under CRS, were regressed in a bootstrapped truncated regression. Outcomes pointed to the negative impact of internationalisation, and the positive significance of the level of salaries. However, the most innovative conclusion revealed an “inverted U-shaped relationship” (Wu, He and Cao, 2013:38) between cargo operation and technical efficiency, that is, at some level, increasing cargo revenue declined the performance of airlines.
Chang et al. (2014) promoted an innovative analysis by combining a slacks-based DEA measure (SBM-DEA) to study economic and environmental efficiency, with 2010 data, of 27 worldwide airlines. The authors used ATK with fuel consumption as inputs, and RTK as output to study input and output based CRS and VRS efficiency slacks, “additional improvements (increase in outputs and/or decrease in inputs) needed for a
unit to become efficient”(Emrouznejad, 2011), in two different models. In one hand, the
first model assumed an independent relation between the improvement of slacks and fuel consumption. On the other hand, the second model introduced a weak disposability assumption to better describe reality since the improvement of output slacks increased undesirable output usage, carbon emission. Thus, airlines were faced with a trade-off between improving output slacks and consuming fuel which affected environmental efficiency. Results of this paper considered Asian airlines to be more economic and environmental efficient than American and European operators, in line with Coelli,
20 Perelman and Romano, (1999); Inglada et al. (2006), with fuel consumption and diversified revenue structure, were inefficiency drivers.
Tavassoli, Faramarzi and Saen (2014) also draw, for the first time, a theoretical model combining the Slacks-based measure and the Network DEA: Slacks-based Network Data Envelopment Analysis (SBM-NDEA). The Network DEA has come about to incorporate the “internal structures” (Tavassoli et al., 2014:147) of airlines on the study of technical efficiency and service effectiveness. Their motivation came from the fact that shared input also takes a relevant role in the production process taken by airlines which is why it is pertinent to represent the transformations that occur in the network (processes and sub-processes), and not exclusively the traditional approach which only deals with initial inputs and final outputs. A case study was implemented to apply the proposed model to 2010 data of 11 Iranian airlines. Two different processes were considered: one for cargo, the other for passengers, and the number of employees was the shared input. Within both, it took place two distinct sub-processes: production and consumption. The aggregation of processes and sub-processes resulted in a single overall efficiency measure, through which it was concluded that Mahan Air was the most efficient airline.
The same approach was performed by Lozano and Gutiérrez (2014) to calculate input and output slacks of European airlines. This model attempted to better describe the production process of airlines, linking activities between the transformation of initial inputs in final outputs, where inputs are not all consumed. This process of airlines was divided into two: production and sales, and included fuel costs, wages and salaries, non-current assets and other operating expenses as inputs to produce Available Seat Kilometres (ASK) and Available Tonne Kilometres (ATK). On the other side, sales process used as inputs the production outcomes plus selling costs to obtain Revenue Passenger Kilometres (RPK) and Revenue Tonne Kilometres (RTK). Results reflected two distinct groups, one with high-level efficiency and another with slightly lower performance. In general, inefficiency came from sales and the efficiency improvement should focus on non-current assets, other operating costs and wages-salaries. On the side of outputs, RPK was considered the target variable. The authors concluded that airlines with the most significant possible improvements, mainly on wages and salaries, non-current assets, other operating expenses and RPK, were the same that were considered as
21 inefficient. Concerning to the methodology, it was confirmed that SB-NDEA had more discriminative power than the traditional technique.
In line with Barbot, Costa and Sochirca (2008); Barros and Peypoch (2009); Merkert and Morrell (2012), Pearson and Merkert (2014) continued with studies on the competition between FSCs and LCCs. Following Merkert and Morrell (2012), the study focused its analysis on a strategy taken by FSCs to the growth of the low-cost business model: airlines within airlines (see Table 3). The authors reviewed literature and airline data to analyse the creation of 67 subsidiary airlines. Conclusions revealed that 27 airlines did not work, and in the US, where this concept emerged, there were no airlines of this nature. Unlike in the US, subsidiary airlines had been successful in Asia-Pacific. Based on the Asian success, authors suggested a set of factors for effective subsidiary companies including the need for autonomy from its FSC, do not diverge from the low-cost model and more significant market presence. The focus in these recommendations would combat some problems that had been leading to the failure of these operators: lower operating revenue per RPK and load factor compared to the corresponding FSC.
Similarly, Lee and Worthington (2014) analysed the impact of the business model and the ownership on the technical efficiency of 42 international airlines. The authors used a two-stage procedure to estimate bootstrapped efficiency scores under VRS, and then regress them against a set of environmental variables to look for sources of technical efficiency. The second step allowed to conclude, by using two different dummy variables, that privately owned airline were better managed than public carriers, as well the positive impact of being a low-cost carrier due to the adoption of quality management and operations to remain competitive.
Merkert and Pearson (2015), in line with Lee and Worthington (2014), followed the two-stage DEA approach by assuming variable returns to scale to calculate bootstrapped efficiency scores and regress them against a set of covariates in a bootstrapped truncated regression. The authors innovated with a combined overall efficiency measure which included measures of the profitability of airlines, customer satisfaction, as well the RPK. The first phase settled that on average LCCs efficiency and charter operators were higher than the efficiency grades of full-service carriers in line with Barbot, Costa and Sochirca (2008). For its part, the subsequent step attempted to measure the impact of service level and profitability on the efficiency scores by applying four distinct models: original or bootstrapped efficiency scores combined with input or
22 output orientations. Results revealed, in one hand, that the projected efficiency measure was meaningful for both model orientations since they provided very similar efficiency ratings and, on the other hand, the bootstrap procedure allowed to have a more reliable efficiency measurement. Concerning the second-step, the ratio of the cabin workers to the total number of employees, representing the service level, was the single significant variable to positively explain the overall efficiency. Other variables such as the average fleet age were not considered significant given it represented the trade-off between customer satisfaction and profitability that is, investing in new aircraft positively affects customer satisfaction, and negatively the profitability of airlines.
To conclude, taking a closer look at each paper, it is easy to understand that DEA has been having a more critical task to perform recent efficiency studies in the airline industry. However, it does not seem to be consensual which orientation is most appropriate, as well as the returns to scale assumption which is more in line with the reality of this industry. Also, some contradictory conclusions emerge in the classification of the most efficient geographies. Nevertheless, there are some common facts. One of them is the most common inputs representing capacity, capital, labour, and fuel, while the most regular outputs characterise movements, revenues, and profits. Another fact is that recent approaches had been including a two-step technique with bootstrapping to identify efficiency sources, or the network DEA to increase the discriminatory power, in line with DEA studies in other industries (Emrouznejad and Yang, 2017). A large part of the studies investigate periods relating to market deregulation processes, with a more recent trend focusing on the competitive environment between low-cost and full-service carriers. However, there appears to be no evidence of an investigation focused on the direct impact of low-cost on FSC efficiency, except considering specific reactions taken by FSCs such as M&A and subsidiary airlines. In this way, it appears that a study with a broad sample would allow gauging some of the conclusions drawn on geographical comparisons, as well to answer some of the uncertainties presented about the scale in which companies operate. Similarly, the application of a two-stage DEA with the market share of low-cost, in a given region, being an independent variable would make it possible to fill a gap in the literature by verifying if the concentration of low-cost operators in a given region influences the technical efficiency of FSCs domiciled in that region.
23
3.2. Developments in Data Envelopment Analysis
DEA, a frontier method, was inspired by the non-parametric technique developed by Farrell (1957) to evaluate the overall productive efficiency of firms accounting for several inputs and a single output of all sorts. This technique was particularly innovative since did not merely restricted to a specific share of business processes, such as the average productivity of labour, and evaluated performance by not imposing any functional form on data. Alternatively, this measure proposed a comparative efficiency assessment directly from calculated information by estimating a fully efficient frontier based on the detected efficient entities and that therefore ranking inefficient units according to the distance to the efficient frontier. Farrell's (1957) pointed three different sorts of efficiency (Coelli et al., 2005): 1) The technical efficiency which focuses on the capacity of a firm to maximise its output; 2) the price (also know as allocative) efficiency which translates the optimal use of inputs, given their prices and the productive technology; 3) the overall (also know as economic) efficiency which represents a combination of both measures.
On the basis of Farrell (1957), Charnes, Cooper and Rhodes (1978) introduced DEA, a non-parametric linear programming procedure, through the commonly denominated CCR model which takes into account multiple inputs and outputs to measure the overall technical efficiency of Decision-Making Units (DMUs). This model adopted a constant returns to scale hypothesis (CRS) by assuming that DMUs are operating at an optimal scale and explains technical efficiency as the ratio of weighted outputs to weighted inputs by providing an efficiency score between 0 and 1 for all DMUs in the sample. Besides, this measure was hand-in-hand with Pareto optimality since “none of its
inputs can be decreased without either decreasing some of its outputs, or increasing some of its other inputs” and vice-versa (Emrouznejad, 2011). Thus, an efficiency score equals
to one indicates that a DMU is allocated on the efficient frontier and it is “weak” technical efficient. In the case of having no slacks - extra output increases and/or inputs decreases required to be efficient - a DMU is considered strong/Pareto technical efficient (Coelli et al., 2005). An efficiency measure below 1 indicates technical inefficiency since the unit is under the efficient frontier.
Later Banker, Charnes and Cooper (1984) upgraded the CCR model by proposing the BCC model which relaxed the CRS hypothesis, assuming that DMUs might be not
24 operating at an optimal scale to be efficient. Instead, they suggested a variable returns to scale hypothesis (VRS) which allows for increasing returns to scale (IRS) and decreasing returns to scale (DRS). This hypothesis was implemented through an extra convexity condition on the efficient frontier which envelops more the data set than the CCR efficient frontier (Thanassoulis, 2001). By introducing the VRS hypothesis, this model suggested an efficiency measure which only compares DMUs of similar sizes relying on the impact of scale efficiency.
Thereby, it is clear to understand that both measures focus on two distinct specific sorts of Farrell's (1957) technical efficiency (Coelli et al., 2005). CCR efficiency provides Farrell's (1957) technical efficiency score (TE) - pure technical efficiency and scale efficiency - and measures inefficiency by the relation of inputs and outputs as also the size of the DMU which means that a CCR efficient unit must operate with an efficient input-output mix as also with the optimal size. With regards to the BCC efficiency, it is a measure of Farrell's (1957) pure technical efficiency (PTE) without scale efficiency incorporated which betokens that a DMU can be BCC efficient without being scale efficient. A combination of both allows calculating scale efficiency (SE). Thus, scale efficiency is 𝐶𝐶𝑅− 𝑇𝑒𝑐ℎ𝑛𝑖𝑐𝑎𝑙 𝑒𝑓𝑓𝑖𝑐𝑖𝑒𝑛𝑐𝑦
𝐵𝐵𝐶−𝑃𝑢𝑟𝑒 𝑡𝑒𝑐ℎ𝑛𝑖𝑐𝑎𝑙 𝑒𝑓𝑓𝑖𝑐𝑖𝑒𝑛𝑐𝑦≤ 1 and represents how close is a DMU from
its optimal size (Coelli et al., 2005).
To illustrate the difference between the two efficiency measures, we can look to DMUs B, D and S cases in Figure 7. The CCR efficient frontier is represented by the dotted line which passes through B from the origin, and the BCC model frontier comprises the bold line connecting A, B and C. So, it is feasible to claim that both models might present different efficiency scores for the same DMU if its relative location changes from one model to other. At the same time, it is no less valid that both models can present the same efficiency score for the same DMU.
25 Figure 7: CCR and BCC models
Source: Cooper, Seiford and Tone (2007:90)
From Figure 7, it is feasible to draw the following relations between both models: • DMU B has the same efficiency score under both measures. Under this
equality, we can state it is pure technical efficient (BCC-efficient) and is also technical efficient, operating with the optimal size (CCR-efficient); • DMU D is not allocated in any efficient frontier, so it is CCR and BCC
inefficient. Although, is further from CCR than the BCC given:𝑃𝑅
𝑃𝐷 ≥
𝑃𝑄
𝑃𝐷.
Under this inequality, we can claim that DMU is less pure technical inefficient (BCC-inefficient) than technical inefficient (CCR-efficient); • DMU S is pure technical efficient, although it is not technical efficient.
Given these circumstances, we can claim that DMU S it is technical inefficient since it is not operating scale efficiently.
Following Banker et al. (1984), Charnes et al. (1978) and Farrell (1957), Thanassoulis (2001) provides a more general definition of DEA. The author describes DEA as an attempt to understand how efficiently each decision-making unit (DMU) is processing its business (see Figure 8) by performing a transformation process using resources and getting outcomes. It compares each DMU to other homogeneous entities which produce the same outputs using the same inputs although in different quantities.
26 Figure 8: Data Envelopment Analysis Traditional Logic for a DMU performing its
Activity
Source: Own production
In most of DEA models, efficiency is calculated using a scalar measure, achieved through a linear programming model, which ranges between zero and one, or from one to positive infinity.
Following Farrell's (1957) contribution, a DMU performs its activity, i.e. its transformation process, by having control over resources or outcomes, either with an input orientation or output orientation (Cooper et al., 2007). Input-orientation checks whether a DMU can improve its performance by reducing its input levels, not dropping outputs, and maintaining its input mix. Output-based technical efficiency investigates if a DMU’s operation could be improved through the expansion of output levels while using the same level of resources and preserving its output mix. In the airline industry literature, there is no clear consensus about which orientation should technical efficiency follow. Studies as Assaf (2009), Barros et al.(2009) and Merkert et al. (2011) followed an output-orientation arguing airlines do not have so much flexibility to adjust inputs in the short-term, considering its as quasi-fixed. On the other side, Barbot et al. (2008) and Merkert et al. (2011) used an input-orientation rooted in the trust that output is significantly dependent on economic factors and often predetermined by long-term slot allocations contracts.
Nowadays, after significant developments, we can classify DEA models into radial and non-radial measures (Jahanshahloo et al., 2010). The radial models follow
X Vector Of Inputs Y Vector Of Outputs DMU transformation
process using the available technological set
27 Farrell (1957) and are the commonly known CCR and BCC representations. The non-radial representations include four types: the additive model, the multiplicative model, the range adjusted measure (RAM), and the slack-based measure (SBM).
Some studies have been performed by implementing SBM in the airline industry. Since this measure is based on the additive model, we will explain it beforehand. The additive model proposed by Charnes, Cooper, Golany, Seiford and Stutz (1985) combines input and output orientations in a single efficiency measure by simultaneously studying output shortfalls and input excesses. Nevertheless, this method does not provide an efficiency score, as also does not measure the depth of inefficiency. Instead, it only distinguishes between efficient and inefficient DMUs by the existence of slacks. Despite, this model has not frequently been used to study airlines’ efficiency.
Tone (2001) introduced the slacks-based measure (SBM) of efficiency. Contrary to the additive model, SBM calculates the depth of inefficiency through the measurement of slacks, under CRS or VRS, and provides a measure which varies between 0 and 1 where the one value is attributed to DMUs with no slacks. The most relevant studies using this technique to the airline industry were performed by Chang et al. (2014) with an SBM measure on the economic and environmental efficiency of 27 international airlines.
More recently, Färe and Grosskopf (2000) also provided new developments on DEA. Their Network DEA (NDEA) method adds to the traditional DEA logic, represented in Figure 8, the existence of several stages in DMUs’ transformation processes, not treating them as “black boxes” (Färe and Grosskopf, 2000:34). According to the authors, there are several stages, each of which consumes its set of inputs and originates its set of outputs aside from consuming and producing intermediate goods, which need to be part of the efficiency study. These intermediate goods can be inputs for some stages and can be outputs for others. Thus, the main advantage of this approach is that “it has more discriminating power than the single-process DEA approach and that
the targets and efficiency scores computed are thus more valid” (Emrouznejad et al.,
2014:75). Recently, this approach has been one of the most used to implement studies in airlines’ efficiency. Lozano et al. (2014) implemented an SBM network DEA to investigate the efficiency of production and sales processes of 16 European airlines. Tavassoli et al. (2014) used it to study the technical efficiency of 11 Iranian airlines decomposing their operational process as a combination of production and consumption.