ABSTRACT
RESUMO
Seleção de linhagens de feijão com alta produtividade de grãos
e alta concentração de cálcio e ferro
O melhoramento genético da qualidade nutricional do feijão representa vantagens mercadológicas e contribui para a sociedade em termos de fonte de alimento. O objetivo deste trabalho foi avaliar a variabilidade genética para a produtividade de grãos e para a concentração de cálcio e de ferro em grãos de linhagens de feijão obtidas por diferentes métodos de melhoramento. Para tanto, 136 linhagens F7 foram obtidas pelo método Genealógico e 136 linhagens F7 foramobtidas pelo método Descendência de uma Única Semente (SSD). As linhagens de feijão apresenta-ram variabilidade genética para produtividade de grãos, concentração de cálcio e de ferro em grãos independentemente do método de condução da população segregante. O método Genealógico permitiu obter maior número de linhagens com alta produtividade de grãos. A seleção usando o método SSD possibilitou a identificação de maior número de linhagens com alta concentração de cálcio e de ferro nos grãos. Correlação negativa de baixa magnitude foi observada entre a produtividade de grãos e as concentrações de cálcio (r = -0,0994) e de ferro (r = -0,3926). Várias linhagens apresentam superioridade genética para a produtividade de grãos e para concentrações de cálcio e de ferro nos grãos, e a seleção destas linhagens pode resultar em novas cultivares de feijão com alta qualidade nutricional.
Palavras-chave: Phaseolus vulgaris L., métodos de melhoramento, variabilidade genética, correlação de Pearson, qualidade nutricional.
Received: 14/09/2012; Approved: 20/11/2013.
1 Agronomyst Engineer, Doctor of Science. Departamento de Fitotecnia, Universidade Federal de Santa Maria, Avenida Roraima, 1000, Cidade Universitária, Bairro Camobi,
97105-900, Santa Maria, Rio Grande do Sul, Brazil. [email protected] (corresponding author); [email protected]
2 Agronomyst Engineer, Doctor of Science. Técnico Administrativo em Educação, Instituto Federal de Educação, Ciência e Tecnologia Farroupilha, Campus de São Vicente do
Sul, Rua 20 de Setembro, s/n, 97420-000, São Vicente do Sul, Rio Grande do Sul, Brazil. [email protected]
3Agronomyst Engineer, Master of Science. Universidade Federal de Santa Maria, Avenida Roraima, 1000, Cidade Universitária, Bairro Camobi, 97105-900, Santa Maria, Rio
Grande do Sul, Brasil. [email protected]
4Agronomyst Engineer. Universidade Federal de Santa Maria, Avenida Roraima, 1000, Cidade Universitária, Bairro Camobi, 97105-900, Santa Maria, Rio Grande do Sul, Brazil.
Nerinéia Dalfollo Ribeiro1, Evandro Jost2, Sandra Maria Maziero3, Lindolfo Storck1, Daniele Piano Rosa4
Selection of common bean lines with high grain yield and high grain
calcium and iron concentrations
Genetic improvement of common bean nutritional quality has advantages in marketing and can contribute to society as a food source. The objective of this study was to evaluate the genetic variability for grain yield, calcium and iron concentrations in grains of inbred common bean lines obtained by different breeding methods. For this, 136 F7 inbred lines were obtained using the Pedigree method and 136 F7 inbred lines were obtained using the Single-Seed Descent (SSD) method. The lines showed genetic variability for grain yield, and concentrations of calcium and iron independently of the method of advancing segregating populations. The Pedigree method allows obtaining a greater number of lines with high grain yield. Selection using the SSD method allows the identification of a larger number of lines with high concentrations of calcium and iron in grains. Weak negative correlations were found between grain yield and calcium concentration (r = -0.0994) and grain yield and iron concentration (r = -0.3926). Several lines show genetic superiority for grain yield and concentrations of calcium and iron in grains and their selection can result in new common bean cultivars with high nutritional quality.
INTRODUCTION
The human body requires many nutrients to keep its metabolic needs (Welch & Graham, 2004, White & Broadley, 2005). Diets with restriction of minerals result in nutritional deficiencies. Mineral deficiency is often observed in children and adults and affect approximately three billion people worldwide (FAO, 2011). The common bean (Phaseolus vulgaris L.) has a high mineral concentration in grains, especially calcium and iron (Mes-quita et al., 2007).
The calcium concentration in common bean grains showed genetic variability and values ranging from 0.30 to 2.80 g kg-1 dry matter (DM) were observed among 21 inbred lines cultivated in Brazil (Mesquita et al., 2007). Iron concentration varies among common bean cultivars and values ranging from 8.9 to 112.9 mg kg-1 DM were observed among 29 Andean and Middle American germoplasm evaluated in the United States (Akond et al., 2011). In general, the iron concentration in common bean grains of Middle American genotypes was 11.3% higher than the Andean genotypes (Talukder et al., 2010).
The existence of genetic variability enables the use of genetic breeding to increase the mineral concentration in common bean grains. Controlled crossing and selection among segregated progenies resulted in concentration increases of 33.6% in calcium (Jost et al., 2009a) and of 94.0% in iron (Jost et al., 2009b) of common bean grains in early generations. Intermediate to high values for narrow-sense heritability of calcium concentration in common bean grains was found by Jost et al. (2009a). The inheritance of iron concentration in common bean grains has been suggested to be quantitative (Blair et al., 2009, Blair et al., 2010, Cichy et al., 2009).
Knowledge of the association between grain yield and mineral concentration is very important for the common bean breeding. Weak positive correlation was observed between calcium and iron concentrations (r = 0.38) in common bean lines (Guzmán-Maldonado et al., 2003). The association between grain yield and the concentrations of calcium and iron in the common bean grains has not yet been investigated.
For the development of common bean cultivars with higher grain yield and higher nutritional quality to be effective, it is necessary to establish strategies for advancing segregating populations. Pedigree and Single-Seed Descent (SSD) methods have been used in the genetic breeding of common bean. These methods were effective in the selection of a greater number of lines with high grain yield, early cycle, anthracnose resistance and better grain type (Costa et al., 2002, Torga et al., 2010). However, the application of these methods in the selection for high mineral concentration in common bean grains is unknown. Thus, this study was designed to evaluate the
genetic variability for grain yield, and the concentrations of calcium and iron in grains of the inbred common bean lines obtained with the Pedigree and Single-Seed Descent (SSD) methods.
MATERIAL AND METHODS
The segregating populations evaluated in this study were obtained by Jost et al. (2009a, 2009b). For this, crosses were performed between contrasting parents for grain yield and concentrations of calcium and iron. The seeds of the F3 generations obtained of the different populations were used for the advanced generations in this study.
The segregating populations were advanced using the Pedigree and SSD methods. For the Pedigree method, the experiment began in the normal rainy season of 2007-2008. Seeds were sown in plots of one line, two meters long, with a total of approximately 10 plants. When harvested, the plants were individually labelled in order to assess grain yield. After obtaining the grain yield per plant, the grain yield per line was calculated. In the selection process, the 40 most productive lines were selected (from a total of 136 lines) and, from these lines, three or four plants with the highest individual grain yield were selected, giving a total of 136 F3 plants. The seeds of each plant selected were identified and individually stored in paper bags. Unfortunately, the test for calcium and iron concentrations is destructive hence selection cannot be performed.
Each F3 plant selected represented a seeded line of the F4 generation.The process was repeated in the normal rainy season of 2008-2009, adopting the same system of sowing and the same criteria for selection, resulting in 136 F4 progenies selected. In the dry season of 2009, the process was repeated and 136 F5 progenies were selected. In the winter of 2009, one generation of 136 F6 progenies was advanced in the greenhouse (F7 seeds).
The SSD method was carried out in a greenhouse, with F3 and F4 generations being obtained in 2008, and F5 and F6 generations in 2009. For each generation, one seed was harvested per plant to be seeded for the next generation. A total of 200 F3 plants were advanced, with the aim of getting 136 F6 plants. A larger number of plants were used in the beginning in order to compensate for any potential losses due to lack of germination or death caused by diseases or insect attack, which may arise from the progression of the generations. In the summer of 2009, the seeds of each F6 plant were harvested individually at maturity and 136 F6 progenies were obtained.
The 272 F7 inbred lines (136 from Pedigree and 136 from SSD methods) and 17 control cultivars were evaluated in the normal rainy season of 2009-2010, using a 17 x 17 simple lattice model. The control cultivars were the six parent cultivars (Pérola, TPS Bonito, BRS Expedito,
Minuano, Diamante Negro and IAPAR 44) and 11 cultivars registered for the cultivation in the south of Brazil (TPS Nobre, BRS Campeiro, FEPAGRO 26, Carioca, Macotaço, Iraí, Macanudo, Guapo Brilhante, Rio Tibagi, BRS Supre-mo and BRS Valente). Plots consisted of two rows 1 m long, spaced 0.50 m apart, with 15 seeds per meter.
The experiment was conducted in the experimental area of the Bean Breeding Program of the Plant Science Department, Federal University of Santa Maria. Santa Maria lies in the central depression region of the Rio Gran-de do Sul State, Brazil (lat 29º42’S, long 53º49’W and 95 m asl). The climate type is temperate, rainy, with well-distributed rainfall throughout the year and subtropical temperatures. The soil is typical alitic Argisol (Hapludalf) with the following chemical composition: pH (H20) = 5.5; organic matter = 20 g kg-1; phosphorus = 6.8 mg dm-3; potassium = 68 mg dm-3; calcium = 5.5 cmol
c dm -3; and magnesium = 2.7 cmolc dm-3.
The soil was prepared in the conventional system and fertilization was performed based on the chemical soil analysis. Cultural practices and insect and weed control to rule out competition were carried out whenever necessary. Disease control was not performed.
The plants were harvested and threshed by hand when mature. Agricultural machinery and equipment were not used in the harvesting and processing of grains to avoid the contamination of samples with heavy metals. The grains were dried in a drying and sterilization oven with forced air circulation (65-70 °C) until they reached an average moisture content of 13%. Then, the grain yield (kg ha-1) was determined.
A homogeneous sample of 50 g of grains per repetition was obtained for each line. For determination of mineral concentrations, samples of 10 g grains from each line were randomly collected from each repetition. Samples were ground in an analytical knife micromill to produce particles smaller than 1 mm.
The samples of the raw bean flour from each line were digested in 5 mL of a nitric-perchloric solution (HNO3 + HClO4 at a 3:1 ratio by volume). After 12 hours of cold digestion (no heat applied), the temperature was gradually elevated 30 °C every 30 minutes until it reached 180 °C. At the end of the digestion, when approximately 1 mL of the transparent solution remained, the sample was diluted by adding distilled water to a total volume of 50 mL. Approximately 20 mL of this dilution was removed and the determination of calcium and iron concentrations in grains was performed in an atomic absorption spectrophotometer using wavelengths of 422.7 nm and 248.3 nm, respectively.
Data were subjected to variance analysis considering the simple lattice design to verify the existence of variability among inbred lines. The values of variance
components and heritability were obtained considering random all the sources of variation. Considering that the inbred lines evaluated had a high level of endogamy, the genetic variation among the lines was additive, thus, the estimated heritability was equivalent to the narrow-sense heritability.
The averages of the 5, 10 and 20 superior lines, under both the Pedigree and SSD methods, were based on absolute values, with a ranking of the lines by method being initially carried out for each characteristic, with the mean of the best 5, 10 and 20 lines, classified as to characteristic, then being obtained. The Student t-test was run at 5% probability in order to compare the difference between the averages obtained for the different methods for each selection group. To identify the number of lines which were superior to each control, the number of lines that presented a mean absolute value superior to each of the controls was considered for each evaluated characteristic.
Linear correlation analyses between the grain yield and the concentrations of calcium and iron in each method were carried out using the Pearson method, based on 272 observations for each method, and in overall (578 observations). The significance of the linear correlation coefficient was verified using Student t-test. Analyses were performed using Microsoft Office Excel spreadsheets and Genes software (Cruz, 2006).
RESULTS AND DISCUSSION
The variance analysis showed significant effect of the inbred lines for each method of advancing segregating populations in relation to grain yield and calcium and iron concentrations, indicating different responses of the common bean lines obtained under each method. The existence of genetic variability for the three traits, regardless of the method, enabled success in the selection of superior lines by both the Pedigree and SSD methods. The variance in grain yield among the lines was significant for each method for advancing segregating populations (Table 1). In the Pedigree method, the mean grain yield of the lines was superior (1,343 kg ha-1) than that obtained under the SSD method (1,013 kg ha-1 - Table 1). In addition, lines with higher grain yield were found more often under the Pedigree method (Figure 1). Costa
et al. (2002) evaluated F6 lines obtained from different crosses and found that the Pedigree method made it possible to select a higher number of lines with high grain yield. Therefore, the selection that started in the F2 generation and was carried out in every generation was effective in selecting plants that were better adapted to the growing conditions. The ability to carry out selection in different environments and during the growing season is an advantage of this method.
The lines obtained under the SSD method showed a large genetic diversity for grain yield with values ranging from 50 to 3,368 kg ha-1;however, lines with lower grain yield were found more often in this method (Figure 1). Raposo et al. (2000) also observed more variation in grain yield among lines with high levels of endogamy obtained under the SSD method. This may occur because selection in the greenhouse is not carried out in the SSD method, so the higher genetic variability obtained in the F2 generation is preserved in segregating generations if lines are not lost because of germination problems.
Heritability estimates for grain yield was 70.17% (Pedigree method) and 72.79% (SSD method - Table 1), indicating that grain yield presented a low non-controllable influence, therefore being favorable for selection. Torga
et al. (2010) observed heritability estimates from 27% to
79.70% for grain yield when 100 F3:7 common bean lines were evaluated. The authors explained the high amplitu-de of variation by the occurrence of interactions between lines and environments.
The environmental variation coefficients (CVe) and genetic variation coefficients (CVg) for grain yield were high for segregating populations obtained under the two methods (Table 1). Although low experimental precision was obtained for grain yield, the higher number of evaluated lines allowed for better exploration of the genetic variability produced by the crosses. Similar variation coefficient values were observed for segregating populations of common bean evaluated in experiments conducted with a 14 x 14 simple lattice design (Aguiar et
al., 2000) and a 10 x 10 triple lattice design (Torga et al.,
2010). Preliminary evaluations of a large number of lines, normally use smaller plots, it is interesting that higher-intensity selection is generally applied because it contributes to increasing the genetic gain (Aguiar et al.,
2000). In this case, higher genetic variability compensates for the low experimental precision during the selection of superior lines. In present study the lines showed genetic variability for grain yield, despite the high variation coefficients.
The variance in calcium and iron concentrations in common bean grains was significant among the lines tested using both methods (Table 1). Calcium and iron concentrations also had greater variation in the lines obtained under the SSD method, with values ranging from 0.50 to 2.76 g kg-1 of dry matter (DM) and from 51 to 135 mg kg-1 DM, respectively (Table 1). These values were very similar to the calcium and iron concentrations observed in 21 common bean lines grown in Brazil (Mes-quita et al., 2007).
The higher mean calcium concentrations (1.41 g kg-1 DM) and the higher number of lines with superior calcium concentration (> 1.70 g kg-1 DM) were observed when the lines were obtained under the SSD method (Table 1, Figu-re 1). In the SSD method, the genetic variance (σ2
G = 0.05) was expressively greater than the environmental variance (σ2
E = 0.02). Thus, a high heritability estimate was observed for calcium concentration (h2r = 66.85%). In early generations, Jost et al. (2009a) found that the calcium concentration in common bean grains were more influenced by additive genetic effects, and obtained narrow-sense heritability values of intermediate (47%) and high (63.61%) magnitudes. When the additive variance is responsible for most of the genetic variance, the character can be fixed; in this case, more facility in carrying out selection is expected.
Transgressive segregation was observed for calcium concentration in F7 lines common bean grains. Similarly, transgressive segregation for calcium concentration was obtained to F2:3 families developed from a cross between
Table 1. Estimated mean squares of inbred lines (MSIL), mean values, ranges of minimum and maximum values, phenotypic variances (σ2 F), environmental variances (σ 2 E), genetic variances (σ 2 G), narrow-sense heritabilities (h 2r, %), environmental variation
coefficients (CVe), genetic variation coefficients (CVg) and CVg/CVe ratios obtained for grain yield and concentrations of calcium and iron in common bean grains from lines obtained using Pedigree and Single-Seed Descent methods (SSD)
Grain yield (kg ha-1) Calcium (g kg-1 of DM) Iron (mg kg-1 of DM) Pedigree S S D Pedigree S S D Pedigree S S D
MSIL 649775.67* 546136.78* 0.08* 0.15* 233.97* 288.32* Mean 1,343 1,013 1.37 1.41 79.57 85.95 Minimum 55 50 0.70 0.50 50 51 Maximum 3,170 3,368 2.20 2.76 129 135 Phenotypic variance (σ2 F) 324887.83 273068.39 0.04 0.07 116.99 144.16 Environmental variance (σ2 E) 96895.29 74310.33 0.01 0.02 64.27 85.63 Genetic variance (σ2 G) 227992.54 198758.05 0.02 0.05 52.71 58.52 Narrow-sense heritability (h2 r) 70.17 72.79 64.78 66.85 45.06 40.60 CVe (%) 32.77 38.03 12.02 16.02 14.25 15.22 CVg (%) 35.55 43.98 11.53 16.09 9.12 8.90 CVg/ CVe 1.08 1.15 0.96 1.00 0.64 0.58
* Significant at 0.05 probability by the F-test.
cultivated and wild common bean (Guzmán-Maldonado
et al., 2003). According to these authors, the existence of
transgressive variation, such as that observed for calcium concentration, should encourage plant breeders as it indicates that gene combination exists, which can result in enhanced performance of the characteristic in the absence of overdominance. To capitalize on transgressive segregation, individual lines at the extreme of the normal distribution must be chosen for further advance of generation and testing.
The higher mean iron concentration was also observed for the lines obtained under the SSD method (85.95 mg kg-1 DM - Table 1). The SSD method identified a large number of lines with iron concentration superior to 94 mg kg-1 DM
(Figure 1). Values similar to those of iron in grains of cultivated common bean lines were described previously by Jost et al. (2009b) and by Mesquita et al. (2007).
The environmental variance was more expressive than the genetic variance for iron concentration in both methods of advancing segregating populations (Table 1). Thus, intermediate heritability estimates were obtained for iron concentration in the lines obtained under the Pedigree (h2
r = 45.06%) and SSD (h 2
r = 40.60%) methods. Similarly, in early generations, Jost et al. (2009b) also detected a narrow-sense heritability of intermediate mag-nitude (50.60%) for iron concentration in common bean grains.
Iron concentration had continuous distribution in F7 lines and transgressive segregation was observed for both low and high values (Figure 1). Previous studies also showed that the iron concentration of common bean grains had continuous distribution among F2:3 lines (Guzmán-Maldonado et al., 2003), F7:11 lines (Blair et al., 2009), F5:7 lines (Cichy et al., 2009) and among F10 lines (Blair et al., 2010). These results confirm the hypothesis that inheritance of iron concentration in common bean grains is quantitative (Blair et al., 2009). Thus, the genetic selection for iron concentration can be difficult, because the effect of individual loci influencing this trait is difficult to isolate and characterize.
A method for selection of segregating populations will be more efficient if the magnitude of genetic gain for the same selection differential is higher (Raposo et al., 2000). Therefore, in addition to the lines’ mean performances, the probability of higher gain should be considered when choosing the method of selection. Thus, from the lines evaluated we obtained the means of the 5, 10 and 20 supe-rior ones (Table 2). The grain yield mean of the 5, 10 and 20 superior lines were higher under the Pedigree method. However, for calcium and iron concentrations, there was no significant difference for the lines obtained under the Pedigree and SSD methods. Similarly, Costa et al. (2002) detected that the selection methods of segregating populations differed in the identification of lines with high grain yield.
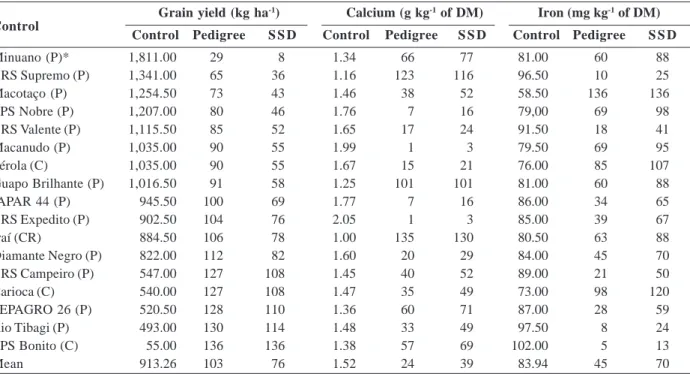
The number of lines where the mean performance exceeds, in absolute values, the mean of a cultivar previously selected as control (standard), can also be used to compare the efficiency of different methods of advancing segregating populations. The Pedigree method was efficient for the selection of a higher number of lines with high grain yield because 29 lines exceeded the best control for grain yield (Minuano, 1,811 kg ha-1 - Table 3). The SSD method had greater efficiency in obtaining lines with higher concentrations of calcium and iron. It was therefore possible to obtain only three lines with calcium concentration greater than the best control for calcium,
Figure 1. Frequency distributions of grain yield (kg ha-1),
calcium concentration (g kg-1 of dry matter) and iron
concentration (mg kg-1 of dry matter) observed in lines obtained
the cultivar BRS Expedito (2.05 g kg-1 of DM). BRS Expedi-to was considered a control cultivar because of the high calcium concentration in grains found in this study and also by Jost et al. (2009a). Thirteen lines showed higher iron concentration than the cultivar TPS Bonito. TPS Bo-nito was used as control for iron because of its high iron concentration in grains (102 g kg-1 DM).
An estimated low-magnitude negative correlation was found between grain yield and calcium concentration (r = -0.1025 using Pedigree and r = -0.0799 using SSD) and iron concentration (r = 0.3275 using Pedigree and r = -0.3959 using SSD - Table 4). Furthermore, the calcium and iron concentrations had a low positive correlation (r = 0.1134 using Pedigree and r = 0.1313 using SSD). Thus, the selection of common bean lines with high grain yield and high concentrations of calcium and iron in grains will be very difficult. Therefore, if the breeding program prioritizes the selection of lines with higher mineral concentration (calcium and iron) in grains, it can eventually
produce lines with low productive potential. Therefore, in early generations, the selection of the most productive progenies can be priority. The determination of mineral concentration is costly and is a very destructive selection technique. Therefore, the selection in advanced generations for higher concentrations of calcium and iron in grains seems to be the best strategy to use for the common bean-breeding program.
Table 3. Mean of each control, number of lines obtained using Pedigree and Single-Seed Descent (SSD) methods that were superior
the each control in absolute value, and general averages of the controls for grain yield and concentrations of calcium and iron in common bean grains
Grain yield (kg ha-1) Calcium (g kg-1 of DM) Iron (mg kg-1 of DM) Control Pedigree S S D Control Pedigree S S D Control Pedigree S S D
Minuano (P)* 1,811.00 29 8 1.34 66 77 81.00 60 88 BRS Supremo (P) 1,341.00 65 36 1.16 123 116 96.50 10 25 Macotaço (P) 1,254.50 73 43 1.46 38 52 58.50 136 136 TPS Nobre (P) 1,207.00 80 46 1.76 7 16 79,00 69 98 BRS Valente (P) 1,115.50 85 52 1.65 17 24 91.50 18 41 Macanudo (P) 1,035.00 90 55 1.99 1 3 79.50 69 95 Pérola (C) 1,035.00 90 55 1.67 15 21 76.00 85 107 Guapo Brilhante (P) 1,016.50 91 58 1.25 101 101 81.00 60 88 IAPAR 44 (P) 945.50 100 69 1.77 7 16 86.00 34 65 BRS Expedito (P) 902.50 104 76 2.05 1 3 85.00 39 67 Iraí (CR) 884.50 106 78 1.00 135 130 80.50 63 88 Diamante Negro (P) 822.00 112 82 1.60 20 29 84.00 45 70 BRS Campeiro (P) 547.00 127 108 1.45 40 52 89.00 21 50 Carioca (C) 540.00 127 108 1.47 35 49 73.00 98 120 FEPAGRO 26 (P) 520.50 128 110 1.36 60 71 87.00 28 59 Rio Tibagi (P) 493.00 130 114 1.48 33 49 97.50 8 24 TPS Bonito (C) 55.00 136 136 1.38 57 69 102.00 5 13 Mean 913.26 103 76 1.52 24 39 83.94 45 70
* P: black commercial group; C: carioca- type seeds; CR: cranberry-type seeds.
Control
Table 2. Grain yield and concentrations of calcium and iron of the 5, 10, and 20 superior lines in each method of advancing segregating
populations
Grain yield (kg ha-1) Calcium (g kg-1 of DM) Iron (mg kg-1 of DM) Pedigree S S D Pedigree S S D Pedigree S S D
Superior 5 2,553.40* 2,369.80 1.89ns 2.13 108.50 ns 117.50
10 2,438.10* 2,137.70 1.82 ns 2.02 103.15 ns 111.25
20 2,297.58* 1,905.30 1.74 ns 1.90 98.10 ns 106.25 * Significant at 0.05 probability by the t-test; ns = no-significant.
Lines
Table 4. Pearson linear correlation coefficients between grain
yield and concentrations of calcium and iron in common bean seeds, considering the inbred lines obtained by the methods of Pedigree and Single Seed Descent (SSD), and overall correlations
Pedigree S S D Overall (n=272) (n=272) (n =578)
Grain yield vs. calcium -0.1025* -0.0799 -0.0994* Grain yield vs. iron -0.3275* -0.3959* -0.3926* Calcium vs. iron 0.1134* 0.1313* 0.1228*
Several lines with higher grain yield and higher concentrations of calcium and iron than the control cultivars were obtained, independent of the method used for advancing segregating population. Many lines showed genetic superiority and their selection can result in new common bean cultivars with high agronomic performance and high nutritional quality. The availability of common bean cultivars with higher calcium and iron concentrations than those of the commercial cultivars has marketing advantages for farmers and can contribute to decrease chronic health problems and mineral deficiencies, since the common bean is grown in almost every tropical and subtropical country and, in many regions, it is possible to do three harvests a year.
CONCLUSIONS
The common bean lines used in this study present genetic variability for grain yield and concentrations of calcium and iron independently of the method of advancing segregating populations.
The Pedigree method allows obtaining a greater number of lines with high grain yield.
The Single-Seed Descent method allows the identification of a larger number of lines with high concentrations of calcium and iron in grains.
Several lines show genetic superiority for grain yield and concentrations of calcium and iron and their selection can result in new common bean cultivars with high nutritional quality.
ACKNOWLEDGEMENTS
We thank the Research Support Foundation of Rio Grande do Sul (FAPERGS) for the financial support and scholarships granted. The authors would also like to thank the National Council of Technological and Scientific Development (CNPq) and the Coordination for the Improvement of Higher Level Personel (CAPES) for the grants awarded.
REFERENCES
Aguiar AM, Ramalho MAP & Souza EA (2000) Comparação en-tre látice e blocos aumentados na avaliação de famílias segregantes em um programa de melhoramento do feijoeiro. Ciência e Agrotecnologia, 24:857-860.
Akond ASMGM, Crawford H, Berthold J, Talukder ZI & Hossain K (2011) Minerals (Zn, Fe, Ca and Mg) and antinutrient (phytic acid) constituents in common bean. American Journal of Food Technology, 6:235-243.
Blair MW, Astudillo C, Grussak MA, Graham R & Beebe SE (2009) Inheritance of seed iron and zinc concentrations in common bean (Phaseolus vulgaris L.). Molecular Breeding, 23:197-207.
Blair MW, Medina JL, Astudillo C, Rengifo J, Beebe SE, Machado G & Graham R (2010) QTL for iron and zinc concentration and content in a Mesoamerican common bean (Phaseolus vulgaris L.) population. Theoretical and Applied Genetic, 121:1059-1070.
Costa JGC, Rava CA & Zimmermann FJP (2002) Comparação da eficiência de métodos de seleção em gerações segregantes de feijoeiro-comum considerando a resistência à antracnose e o rendimento. Ciência e Agrotecnologia, 26:244-251.
Cichy KA, Caldas GV, Snapp SS & Blair MW (2009) QTL Analysis of seed iron, zinc and phosphorus levels in an Andean bean population. Crop Science, 49:1742-1750.
Cruz CD (2006) Programa Genes. Viçosa, Universidade Federal de Viçosa. 382p.
FAO - Food and Agriculture Organization of the United Nations (2011) Undernourishment around the world: counting the hungry: latest estimates. Disponível em: <ftp://ftp.fao.org/ docrep/fao/005/y7352e/y7352e01.pdf>. Acessado em: 29 de abril de 2012.
Guzmán-Maldonado SH, Martínez O, Acosta-Gallegos JA, Guevara-Lara F & Paredes-López O (2003) Putative quantitative trait loci for physical and chemical components of common bean. Crop Science, 43:1029-1035.
Jost E, Ribeiro ND, Maziero SM, Cerutti T & Rosa DP (2009a) Efeitos gênicos do teor de cálcio em grãos de feijão. Ciência Rural, 39:31-37.
Jost E, Ribeiro ND, Cerutti T, Poersch NL & Maziero SM (2009b) Potencial de aumento do teor de ferro em grãos de feijão por melhoramento genético. Bragantia, 68:35-42.
Mesquita FR, Corrêa AD, Abreu Lima RAZ & Abreu AFB (2007) Linhagens de feijão (Phaseolus vulgaris L.): composição quí-mica e digestibilidade protéica. Ciência e Agrotecnologia, 31:1114-1121.
Raposo FV, Ramalho MAP & Abreu AFB (2000) Comparação de métodos de condução de populações segregantes do feijoeiro. Pesquisa Agropecuária Brasileira, 35:1991-1997.
Talukder ZI, Anderson E, Miklas PN, Blair MW, Osorno J, Dilawari M & Hossain KG (2010) Genetic diversity and selection of genotypes to enhance Zn and Fe content in common bean. Canadian Journal of Plant Science, 90:49-60.
Torga PP, Santos JB, Pereira HS, Ferreira DF & Leite ME (2010) Seleção de famílias de feijoeiro baseada na produtividade, no tipo de grãos e informações de QTLs. Ciência e Agrotecnologia, 34:95-100.
Welch RM & Graham RD (2004) Breeding for micronutients in staple food crops from a human nutrition perspective. Journal of Experimental Botany, 55:353-364.
White PJ & Broadley MR (2005) Biofortifing crops with essential mineral elements. Trends in Plant Science,10:586-593.