WELL LOGGING APPLIED TO FERRUGINOUS KARST TERRAINS INVESTIGATION,
CARAJÁS – PA, BRAZIL
Calvin Cesar Ferreira
1, Marco Antonio S. Braga
1,
Maria Filipa Perez da Gama
1and Marcelo Roberto Barbosa
2ABSTRACT.Karst terrains and landforms (caves) are common features near N4EN iron mine, Carajás, Pará State, Brazil. These domains are associated to a combination of weathering plus dissolution processes in rocks. So, both processes lead to the development of a weathering profile. In N4EN mine, the dissolved rocks have ferruginous composition and may be associated to iron ore. Therefore, the weathering profile is composed by lateritic horizons. In Brazilian constitution, mining sites can’t operate nearby caves before performing a preliminary technical-scientific investigation. Because of this scenario, a pilot project was designed with the purpose to apply geological-geotechnical and geophysical (electroresistivity, ground penetrating radar and well logging) methods in karst investigation. This pilot methodology was first applied to N4EN-0026 cave, in N4EN mine, and its surroundings. This article is focused on interpretation of the well logging results and aims to: (1) analyse petrophysical properties (density and natural radioactivity) of rocks nearby N4EN-0026 cave; and (2) identify and explain trends for rock’s petrophysical properties. Therefore, within logging data it was feasible to calculate the average density of rocks, identify elements associated to density variation and prove the effectiveness of well logging providing quantitative information.
Keywords: applied geophysics, geophysical well logging, speleological geophysics, near surface geophysics.
RESUMO.Relevos e estruturas cársticas (cavidades) são estruturas comuns na mina de ferro N4EN, Carajás, Pará, Brasil. Tais regiões estão relacionadas a uma interação entre processos de alteração intempérica e dissolução. Na mina N4EN, as rochas alteradas têm composição ferruginosa e podem estar associadas ao minério de ferro. Desse modo, esta combinação resulta no desenvolvimento de um perfil de alteração, de composição laterítica. De acordo com a constituição brasileira, empreendimentos mineiros não podem atuar próximo de cavidades até que seja feita uma investigação técnico-científica. Portanto, foi proposto um projeto piloto destinado a pesquisa de terrenos cársticos através de uma abordagem geológica, geotécnica e geofísica (eletrorresistividade, radar de penetração e perfilagem geofísica). O primeiro alvo desta metodologia pioneira foi a cavidade N4EN-0026, na mina N4EN, e sua área de influência. Este artigo versa sobre a interpretação dos dados de perfilagem geofísica e tem por objetivo: (1) analisar propriedades petrofísicas (densidade e radioatividade natural) de rochas próximas à cavidade N4EN-0026; e (2) identificar e explicar o comportamento das propriedades petrofísicas. Através dos resultados de perfilagem geofísica pôde-se: calcular a densidade média das rochas, identificar causas para variações de densidade e atestar a aplicabilidade da perfilagem geofísica para obtenção de dados quantitativos.
Palavras-chave: geofísica aplicada, perfilagem geofísica, geofísica espeleológica, geofísica rasa.
Corresponding author: Calvin Cesar Ferreira
1Universidade Federal do Rio de Janeiro – UFRJ, Centro de Pesquisa em Geofísica Aplicada (CPGA), Av. Athos da Silveira Ramos, 274, sala G-058, Cidade Universitária, Ilha do Fundão, 21941-916, Rio de Janeiro, RJ, Brazil – E-mails: cc_ferreira@outlook.com, marcobraga@geologia.ufrj.br, filipa@geologia.ufrj.br
2Vale S.A. – Licenciamento Ambiental e Espeleologia, Planejamento e Desenvolvimento de Ferrosos, Rua Guamá, 60, Núcleo Urbano de Carajás, 68516-000, Parauapebas, PA, Brazil – E-mail: marcelo.roberto.barbosa@vale.com
INTRODUCTION
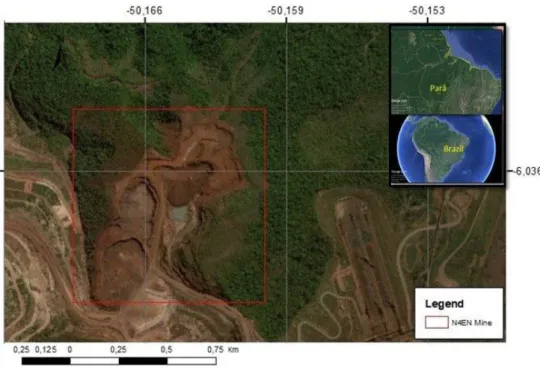
The N4EN iron mine is part of a mining complex owned by Vale S.A. located at Carajás Range, southeast of Pará State. (Fig. 1).
This region is known as Carajás Mineral Province where many deposits were discovered such as: Au, Cu, PGE, Mn and Ni. Also, in this region several caves were developed (Piló & Auler, 2009).
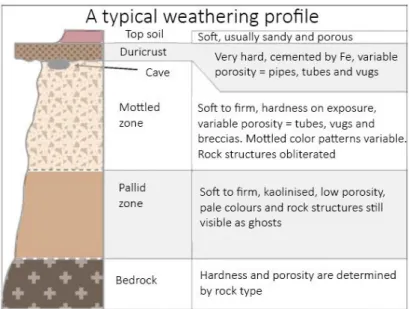
These caves were formed through dissolution processes under a weathering profile (Grimes & Spate, 2008), composed by lateritic rocks (Maurity & Kotschoubey, 1995). A general weathering profile may be composed of up to five horizons, from bottom to top: bedrock, pallid zone, mottled zone, duricrust and topsoil (Grimes & Spate, 2008) (Fig. 2).
The most important fluid for its dissolution is meteoric water. This fluid penetrates through joints, fractures or any kind of discontinuities. When this fluid interacts with rocks, it leaches out chemical particles from rocks and weakens its structure. This process occurs in the interface between mottled zone and duricrust, where dissolution is more intense. The outcome is generation of dissolution caves, similar to what occurs in N4EN mine.
Figure 3 shows a brief portrait of how many caves occurs in N4EN and its surroundings, highlighting cave N4EN-0026, which is one of the most studied in the region, having been chosen for a pilot project with geotechnical and geophysical studies.
Within this pilot project, the aim of this research is to: (1) investigate petrophysical properties (density and natural radioactivity) of rocks nearby cave N4EN-0026 and its surroundings through drilling and well logging data; (2) identify tendencies for rock’s densities; (3) evaluate the performance of drilling and well logging applied to karst investigations; and (4) verify the correlation between well logging data and other geophysical method. Details of these techniques are discussed in the methodology section. Other contributions to this project were discussed in Barbosa (2018); Barbosa et al. (2019); Ferreira et al. (2019); Gama (2019); Gama et al. (2019); and Prosdocimi (2019).
Well logging applied to ferruginous karst terrains investigation is a pioneer initiative. In speleological literature, there are study cases of investigations through potential field methods (gravity and magnetics), electrical methods, seismic and electromagnetic methods (GPR) (Hoover, 2003; Chalikakis et al., 2011; Martínez-Moreno et al., 2014). Furthermore, most of the case studies are in carbonate karst terrains.
Figure 2 – Draft illustrating the set of lithotypes in a typical weathering profile. Adapted from Grimes
& Spate (2008).
GEOLOGICAL SETTING
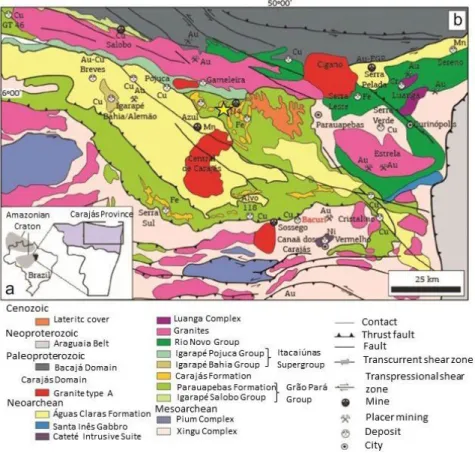
The rocks in this area belongs to Carajás Domain in Amazonian Craton. The most important stratigraphic unity for this research is the Carajás Formation, of Grão-Pará Group, Itacaiunas Supergroup (DOCEGEO, 1988; Tavares, 2015), Figure 4.
Carajás unity hosts banded iron formations, locally known as Jaspillites. This rock is described as intercalated bands composed by jasper and iron oxide, mainly hematite. Jaspillites are the original host of iron ore (Lobato et al., 2005; Pereira, 2009). However, their content in Fe isn’t feasible for exploration.
The exploited ore comes from hematitite. This Fe enriched rock is formed through alteration processes under jaspilites. Bibliography suggests that these processes has a hydrothermal signature, a supergenic signature or a contribution of both (Lobato et al., 2005). Anyhow, the main aspect is the removal of silica, which results in a rock with a higher content in Fe. In Carajás, there are two types of hematitite: friable hematitite and compact hematitite. The difference between them is the structure. Friable variety has a weak structure, therefore, a low mechanic
resistance, while the compact variety is more resistant, difficult to disaggregate.
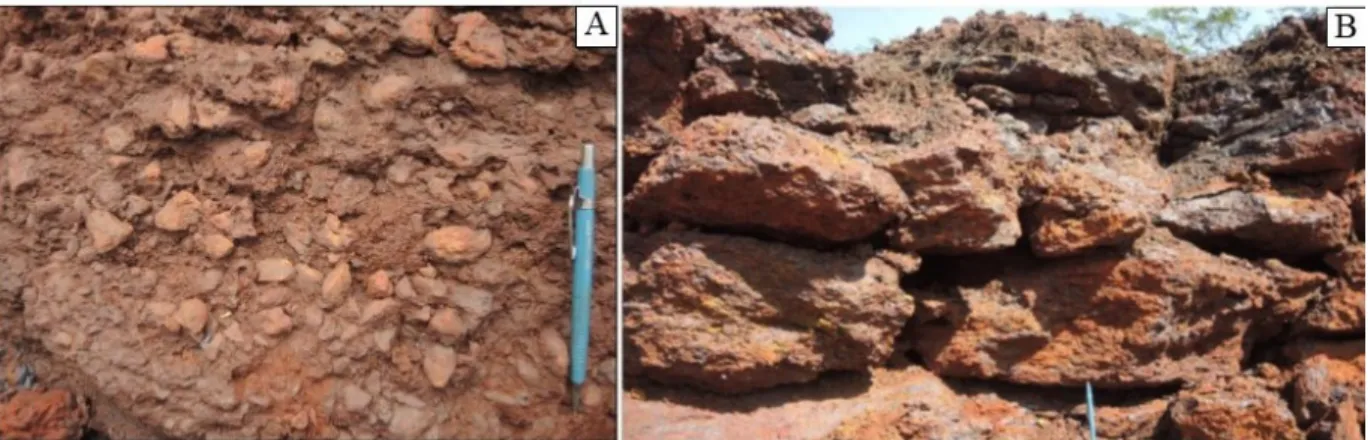
Lastly it is important to mention lateritic crust. According to Barbosa (2018) this horizon has three different lithotypes: lateritic detrital crust (Fig. 5A), ferruginous lateritic crust (Fig. 5B) and Fe-Al lateritic crust. Lateritic detrital crust is composed by poorly sorted angular to sub-rounded pebbles of iron oxides and hydroxides, with a silty sandy matrix. It is analogue to a conglomerate with massive structure and millimetre size voids. The ferruginous lateritic crust has hardened bands of iron oxides and hydroxides, cemented by goethite. This rock is composed by very coarse fragments of iron oxides and hydroxides, angular to sub-angular, similar to a breccia. Also these fragments may be placoid or rectangular shaped. And the Fe-Al lateritic crust has a laminated structure, composed by goethite, and small voids. These voids are developed in the lamination plans. Also, it may have a hardened cover with anastomosed aspect and high porosity. Yet, pisolithic and botryoidal structures may occur. Table 1 summarizes their description.
Table 1– List of lithotypes identified in each well and their features.
Lithotype Geological aspects Code Well
SN4-FD00069 SN4-FD00070 SN4-FD00071
Lateritic crust
Compact or partially compact rock, hydrated and cemented (iron oxides-hydroxides). Higly weathered. Color: grey reddish or red with dark brownish. Irregular or massive structure. May be fractured. High or medium porosity. Has dissolution caves, from cm to mm (wells 069 and 070). Mineralogy: hematite, goethite, limonite, martite and clay minerals. Localized at shallow depths.
LC X X X
Friable Hematitite
Friable and hydrated rock. Color: grey with dark orange or grey with dark brownish. Massive or laminated structure. High or medium porosity. Very fractured. May have layers of decomposed mafic. Mineralogy: hematite, magnetite, goethite and clay minerals. Localized at intermediary depths (about 7 to 20m or about 17 to 35m).
FH X X X
Contaminated Hematitite
Friable and very hydrated rock. Color: brown dark reddish. Has laminated structure. Very fractured with medium porosity. Mineralogy: clay minerals, goethite, hematite and magnetite. Localized at intermediary depths (5 to 15m).
CH X
Decomposed mafic
Friable, highly weathered and very hydrated rock. Color: red with dark grayish. Low porosity. Mineralogy: clay minerals and hematite. May be associated to friable hematitite. Localized at higher depths (about 20 to 35m).
DM X X
Figure 5 – Varieties of lateritic crust horizon in Carajás. A: detrital lateritic crust; B: ferruginous lateritic crust. Adapted from Barbosa (2018).
Under the lateritic crust horizon, there is the transition horizon or mottled zone. This horizon may have two lithotypes: lateritic banded iron formation and Fe-Al laterite. The first one is represented by greyish iron oxides and hydroxide bands intercalated with porous reddish iron oxides and hydroxide bands. These bands may be fractured or folded and cemented. The second lithotype may also have a laminated structure or a massive structure. This massive structure is composed by iron oxides and hydroxides fragments. In the case of massive structure, usually voids may occur, in a linear geometry.
The last horizon is the saprolite zone, previously banded iron formation. This rock is highly weathered. Composed by goethite and fragments of hematitite, banded iron formation and jaspilite. Occasionally may be described as a soil, therefore, original structures are scarce. These three horizons represent Carajás’s lateritic weathering profile. N4EN mine has a similar weathering profile (Fig. 6). In this paper, N4EN profile is studied through well logging.
METHODOLOGY
In the field, survey was divided in two stages. The first was a geological mapping, focused on acquisition of geotechnical data and pedological description. While the final stage represents the geophysical survey itself, with drilling and well logging. It is important to mention that drilling above the cave isn’t possible, due to operational risk to damaging or loosing equipment. Because of that, boreholes were positioned on a mining bench, near N4EN-0026 cave.
Well logging is an indirect investigation technique. Data is acquired through a pre-existing well (Telford et al., 1990; Ellis & Singer, 2007). In the field this technique has a tool kit, applied
to acquire petrophysical data. It’s main benefit is the possibility of using different tools to measure multiple physical parameters at once (Serra, 1983). By the end of a well logging survey, the product is a series of vertical logs. It exhibits continuously the variation of physical rock properties along the well. This research used a combination of three profiles: gamma ray, density and caliper.
Gamma ray logging
The aim of gamma ray log is to measure the medium’s natural radioactivity. It is a passive technique, so the medium doesn’t need to be artificially stimulated. Theoretically it is based on nuclear physics.
Gamma rays are the most important in this technique. Described as an emission of high level energy, low wavelength and high capacity to penetrate the medium (Serra, 1983; Ellis & Singer, 2007). It can be spontaneously produced by rocks, through minerals with the elements K, U and Th. The logging tool descends along the well and with a unique sensor, registers the amount of gamma radiation spontaneously emitted by rocks.
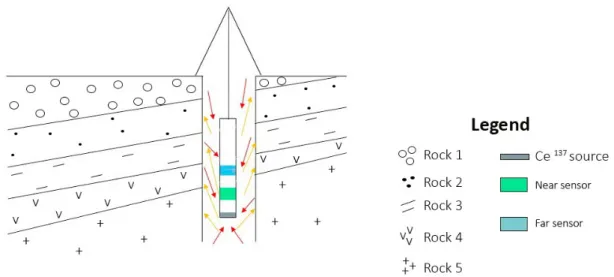
Density
This log is applied to measure the medium’s specific mass. Analogous to gamma ray log, it is based on nuclear physics. But in this case, it is focused in the interaction between gamma ray and the medium.
As stated before, gamma ray particles are the most important in density log, due to its penetration ability. During survey, the medium must be stimulated. To do so, the logging tool is equipped with a radioactive source of Cesium 137, inside a safety case. This case is attached to the bottom extremity of the
Figure 6 – Geological sketch from N4EN mine weathering profile. The picture shows a in situ bench, in N4EN mine, with the lateritic horizons. Adapted from Gonçalves
et al. (2016).
Figure 7 – Scheme illustrating the operation of data acquisition by density log tool.
logging tool (Fig. 7). Also, the logging tool has two sensors. Each of them is fixed far from the source, a short (near) sensor and a long (far) sensor. The different separations between sensors and source is for measurement of attenuation of gamma ray radiation along the well. Both sensors will register an answer, then the specific mass, that is, density, is calculated with a correction constant.
Caliper
The caliper log is applied for monitoring the diameter of wells. The toolkit is equipped with two pieces: a pivot and a spring. For a proper acquisition, the pivot must remain in touch with the borehole walls. So, the spring length accuses variations in the diameter of the well.
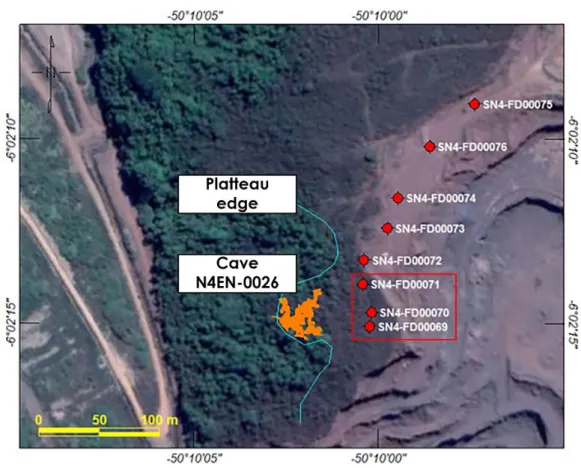
Figure 8 – Map with the location of the wells and the cave. The spots inside the rectangle represent the wells interpreted in this paper.
Source: Vale.
Survey was done with a single equipment. The three logging tools were attached to this equipment. By the end, eight wells were logged. Then, three wells were selected for interpretation in this paper: SN4-FD00069, SN4-FD00070 and SN4-FD00071 (Fig. 8). These wells were selected due to their proximity to cave N4EN-0026. Also, this location has been previously studied (Barbosa, 2018; Gama et al., 2019; Prosdocimi, 2019) and the results could help the drilling and logging interpretation of this research.
RESULTS
Lithotypes identified in drilling survey
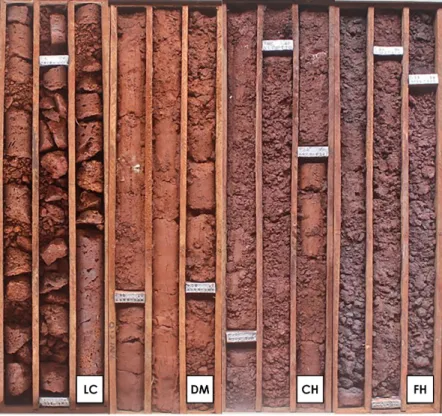
Drilling survey has recovered drill cores from each well. All the drills cores were described and four lithotypes were identified. Table 1 summarizes the main features of these four facies. Besides the rocks, description pointed to the occurrence of sections with no core recovery. This situation is reported in two wells: SN4-FD00069 and SN4-FD00070. Figure 9 presents the visual aspect of each facies. This set represents the typical lateritic weathering profile near N4EN mine.
Well logs interpretation
In this paper, well logs has two types of information: geological data, as drill core representation, and geophysical data. Geological dataset features were discussed in the previous topic. The thickness of each lithotype was inferred mainly from geophysical data with a contribution of geological data.
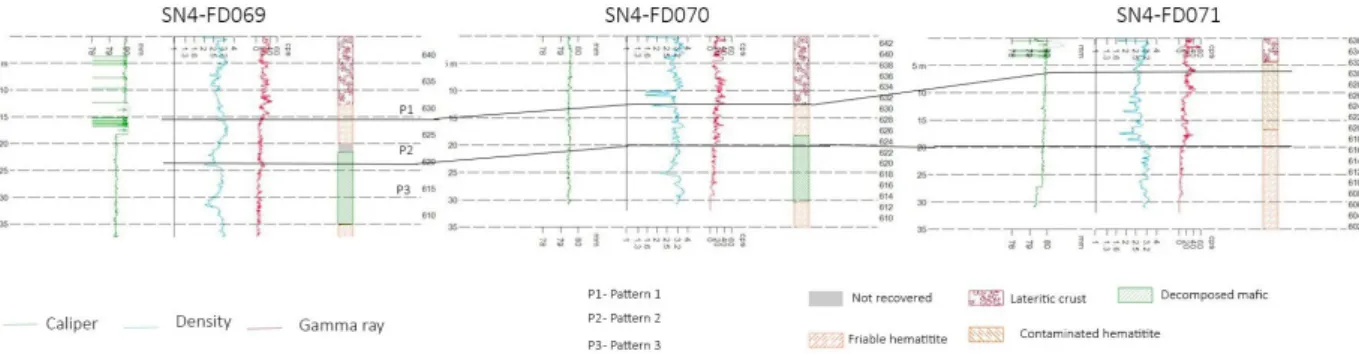
During interpretation, striplogs were analysed together (Fig. 13). Thereby, it was feasible to suggest three geophysical patterns, based on visual observation of the curves. Every pattern represents a different geophysical signature, it means that each pattern expresses a change in the curve’s visual behaviour. It is important to mention that the contour of geophysical patterns may be different of the lithological contacts presented in drill core sketch.
Density
This log exposes the behaviour of specific mass along the well. Its results can be influenced by rock’s mineralogy, state of fractures
Figure 9 – Example of lithotypes recovered in drill cores. LC: lateritic crust, DM: decomposed mafic, CH:
contaminated hematitite and FH: friable hematitite.
and state of compaction. Density curves analysis revealed that specific mass is heterogeneous. Through density log and drill core sketch (Fig. 13), it is possible to deduce which lithotypes are linked to highest or lowest values for specific mass.
Also, a series of boxplots graphs were developed in order to identify and analyse density trends. These charts were based on the absolute value measured. The sample space has 3342 density measures, for LC, DM, CH and FH, so databasegraphs were filtered to form clusters for each lithotype.
Pattern 1 is represented by lateritic crust (LC) in all wells. The boxplot graph in Figure 10 summarizes trends for lateritic crust’s density, including the three wells. Half of the measures have density between 2.66 and 2.91 g/cm³, i.e., interquartile range. And the median value for LC measures is 2.78 g/cm³. Visually, it seems that the range between 2.78 and 2.91 g/cm³ has a greater amount of measures.
The maximum and minimum values of specific mass are, respectively, 3.27 gm/cm³ and 2.31 g/cm³. However, due to the presence of outliers, these numbers does not represent the absolute maximum and minimum values measured. Below the minimum, eight outliers can be observed (red rectangle).
And above the maximum, four outliers can be observed (green rectangle). Both may be justified by lateritic crust’s features, such as: greater proportion of iron composition (hematite and martite) and compaction state clarifies positive outliers. On the other hand, the presence of dissolution caves (Table 1) could point to the negative outliers, evidenced by the spots under the minimum bar (Fig. 10).
The second pattern may represent the two varieties of hematitite (FH and CH). Therefore, absolute values of density measured from both varieties were merged. The result is the boxplot graph, in Figure 11. In this case, there aren’t outliers. So, the absolute maximum value measured is 3.49 g/cm³. And the absolute minimum value measured is 2.57 g/cm³. Half of the measures have density between 3.25 and 2.88 g/cm³, i.e., interquartile range. The median value for hematitite samples is 3.08 g/cm³. Visually the range between 3.08 and 2.88 g/cm³ has a larger cluster of measures.
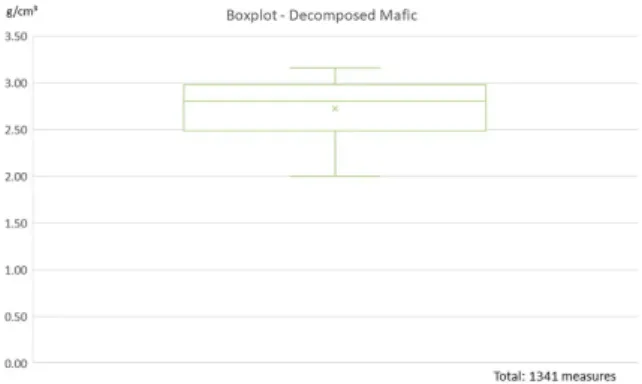
Pattern 3 presents two lithotypes, decomposed mafic (DM) and friable hematitite (FH), also identified in pattern 2. Figure 12 shows the boxplot for the decomposed mafic. Alike the hematites, DM measures doesn’t present outliers. Then, the
Figure 10 – Boxplot graph of lateritic crust (LC). The spots inside the green
rectangle represents positive outliers, while the others inside the red rectangle represent negative outliers.
Figure 11 – Boxplot graph of friable hematitite (FH) and contaminated hematitite
(CH). Outliers were absent.
Figure 12 – Boxplot graph of decomposed mafic (DM). Outliers were absent.
absolute maximum density measured is 3.16 g/cm³ and the absolute minimum density measured is 1.99 g/cm³. Half of the density measures are between 2.98 and 2.48 g/cm³. In this case, the median value is 2.80 g/cm³. It is important to perceive that most of the measures are between the median line and 2.48 g/cm³. Since DM is a friable rock, basically composed by clay minerals (Table 1), the predominance of density values above 2.8 g/cm³ is plausible.
Gamma ray
Gamma ray curve evaluates natural radioactivity of rocks. These results may be influenced mainly by the rock’s mineralogy. A preliminary analysis of the curves revealed that natural radioactivity tends to decrease with depth increasing along the
logs (Fig. 13). This trend can be observed in all wells and it is explained by the composition of the drilled rocks.
Lateritic crust is composed by hematite, goethite, limonite, martite and clay minerals (Table 1). It is located at shallow depths, therefore, more susceptible to exogenous processes. Both hematitites (friable and contaminated) contains hematite, magnetite, goethite and clay minerals. But, contaminated hematitite has a higher content in clay minerals, compared to friable hematitite. And decomposed mafic is constituted by clay minerals and hematite (Table 1).
Compositional differences between the described rocks, corroborates the contrasts identified by geophysical dataset. Thereby, the pattern 1 for the gamma ray log exposes rocks with higher natural radioactivity. Pattern 2 has a slight decrease in natural radioactivity in comparison to previous pattern. The lithotypes in pattern 2, both hematites, have a small content of
Figure 13 – Correlation of the three wells. After interpretation of striplogs, three geophysical patterns (P1, P2 and P3) were individualized.
potassium. Lastly, pattern 3 has the minor values of radioactivity. It is represented by decomposed mafic or friable hematite.
Striplogs examination
As commented, the pilot project applied geophysical methods. Besides drilling and well logging, there was a survey of electroresistivity method and electromagnetic method (Ground Penetrating Radar). These techniques were also applied to investigate cave N4EN-0026 and its surroundings.
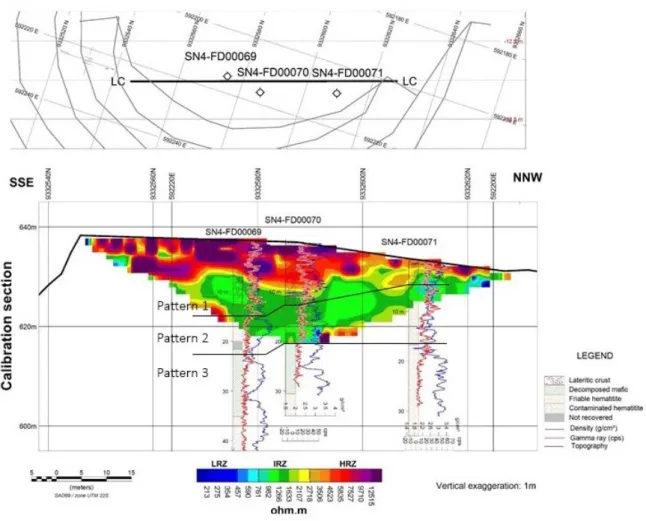
Electroresistivity survey performed a total of five electrical sections. These data were interpreted by Barbosa (2018), describing lateritic horizons according to their lithological and electrical resistivity contrasts (HRZ – high resistivity zone, IRZ – intermediate resistivity zone and LRZ – low resistivity zone). One of the sections, designated as “calibration section”, is near the drilled and logged wells interpreted in this paper. It is crucial to mention that both geophysical methods (electroresistivity and well logging) have different deepness of investigation. However, a database comparison stills useful.
Figure 14 illustrates the position of wells over calibration section. The calibration section contour reproduces the in situ topography. The contrasts identified by “calibration section” reminds the contrasts observed in well logging data. The results from electroresistivity section shows at least two different resistivity domains (high electroresistivity and intermediate resistivity). As well logging interpretation shows three different domains, based on density and natural radioactivity.
DISCUSSION
Through density log analysis and geological data, it was feasible to comprehend specific mass tendencies of the drilled rocks. The average density for hematitites is 3.06 g/cm³ (Fig. 11). On the other hand, the average density for decomposed mafic
is 2.72 g/cm³ (Fig. 12). And for lateritic crust, the average density is 2.78 g/cm³ (Fig. 10). Lima et al. (2013) perform a similar research, with the purpose to investigate petrophysical properties (density, porosity and compaction state) in rocks from Carajás region. In short, the author performed measures through laboratory tests. Three of their lithotypes match with the lithotypes here investigated: friable hematite, decomposed mafic and lateritic crust.
Regardless methodology differences, it was useful to compare (Table 2) average density results calculated in this paper and Lima et al. (2013). The best correlation is observed for decomposed mafic. Lateritic crust has a weaker correlation and hematite has the worst correlation. This behaviour can be explained by two hypotheses: (1) discrepancy between quantity of samples. The database used by Lima et al. (2013) is consisted by 19 measures. And the database used in this paper, is consisted by 3342 measures. (2) difference between acquisition conditions. In this paper, data came from continuous borehole measures, in natural conditions. While data used by the other author came from laboratory tests in plug samples, an environment with controlled conditions.
The database studied by this paper is consistent with the description of each lithotype. Decomposed mafic, for example, is a friable rock. Also highly weathered and composed primarily by clay minerals, so it is coherent to have a low specific mass, around 2.72 g/cm³. However, DM may be associated with FH. This explains local spots in all wells, with specific mass above 3.02 g/cm³ (Fig. 13). Also, this is evidenced by DM boxplot graph (Fig. 12), with solid predominance of measures under the median line, 2.72 g/cm³.
While hematitites and lateritic crust has high specific masses, due to its Fe enrichment. However, lateritic crust has some spots of low specific mass (Fig. 13) in all wells, for example,
Figure 14 – Comparison between electroresistivity calibration section and well logging interpretation. Electrical contrasts distinguish lateritic horizons, just as well
logging contrasts.
Table 2 – Lithotypes average density comparison.
Lithotypes average density (g/cm³)
Ferreira et al.(2019) Lima et al.(2013)
Hematite 3.06 5.01
Decomposed Mafic 2.72 2.84 Lateritic Crust 2.78 3.61
1.99 g/cm³ or 1.81 g/cm³. The negative outliers presented in the boxplot (Fig. 10) corroborates this observation. Perhaps this may occur due to dissolution caves (SN4-FD00069 and SN4-FD00070). Besides, it is highly weathered and has a high to medium porosity. In the case of the hematitites, both varieties are described as very fractured (Table 1) rocks, in all wells. The spots
with low specific mass may be associated with these fractured zones.
In all the wells, caliper log has very short variations. As a matter of fact, calliper results were not relevant during the cross check of the other logs (density and gamma ray) and geological data (drill core description). Therefore, calliper log was not
possible to positively evaluate drilling survey and certify the quality of the drilled rocks.
Small dissolution caves were described in the wells SN4-FD00069 and SN4-FD00070 (Table 1). These features are sized from millimetres to centimetres. Both of them are located in pattern 1, therefore, lateritic crust. Drill core data in well SN4-FD00069 exhibits a section with samples not recovered. Perhaps this section is composed by rocks more friable or highly fractured.
CONCLUSION
The well logging technique presents solid results. Along with drilling survey, enabled to recognize and identify the lithotypes from N4EN mine. Also, this combination enables to: recognize lithological contrasts in lateritic horizons, describe petrophysical properties and indicate areas with higher or low specific mass. Since N4EN mining operation is established near karst terrains, low specific mass areas may represent geological risk. This kind of information is key for operational security matters.
The comparison between gamma ray log and density log was essential to perceive contrasts in the wells and individualize the geophysical patterns. Thereby, it was verified a minor correlation between resistivity data, “calibration section”, and geophysical patterns interpreted from well logging data. So, pattern 1 is linked to a high resistivity zone, while patterns 2 and 3 are dominated by intermediate resistivity zones.
Despite the geological data, the focus in this paper was the geophysical data. The geophysical dataset produces an indirect interpretation with a quantitative approach, a portrait closer to reality. In contrast, geological data comes from description, observation, interpretation and criteria from the geoscientists, a qualitative approach. The results presented in this paper proves that the geophysical quantitative approach plus a statistical analysis are useful approaches when applied for karst terrains investigation.
ACKNOWLEDGMENTS
A special thanks to Vale S.A. for the financial incentive to this research and for authorizing the publishing of these results. Also, to the colleagues from Centro de Pesquisa em Geofísica Aplicada (CPGA-UFRJ), for the technical support during this research.
N4E, Carajás, PA, Brasil. Post Doctoral report on Geology, Centro de Pesquisa em Geofísica Aplicada, Universidade Federal do Rio de Janeiro, Brazil, 2018. 92 pp.
BARBOSA MR, BRAGA MA, GAMA MFP, PAULA RG, BRANDI IV & DIAS LSO. 2019. Electrical resistivity contrasts in the geotechnical assessment of iron caves, N4EN Mine, Carajás, Brazil. Geophysics, 85(1): B1-B7. CHALIKAKIS K, PLAGNES V, GUERIN R, VALOIS R, BOSCH FP. 2011. Contribution of geophysical methods to karst-system exploration: an overview. Hydrogeology Journal, 19(6): 1169-1180.
DOCEGEO. 1988. Revisão litoestratigráfica da Província Mineral de Carajás. Província Mineral de Carajás – Litoestratigrafia e Principais depósitos minerais. Equipe-Distrito Amazônia. In: 35º Congresso Brasileiro de Geologia. Annex to Belém, PA, Brazil. SBG. p. 11-56. ELLIS DV & SINGER JM. 2007. Well logging for Earth scientists. Springer, Dordrecht, 692 pp.
FERREIRA CC, BRAGA MB, BARBOSA MR, GAMA MFP, GUIMARÃES RP & BRANDI IV. 2019. Geophysical well logging applied to na iron cave investigation, Carajás – PA. In: 16thInternational Congress of the Brazilian Geophysical Society & EXPOGEF. Rio de Janeiro, RJ, Brazil. SBGf.
GAMA MFP. 2019. Investigação e monitoramento geofísico de cavidades naturais em minério de ferro. Master Dissertation on Geology. Universidade Federal do Rio de Janeiro, Brazil, 2019. 149 pp. GAMA MFP, BRAGA MA, BARBOSA MR, PAULA RG, GONÇALVES DF & BRANDI IV. 2019. Geophysics applied to the mapping of natural caves hosted in iron ore in Carajás (PA), Brazil. Brazilian Journal of Geophysics, 37(3): 249-262.
GONÇALVES DF, DE PAULA RG, BARBOSA MR, TELES C, MAURITY CW & MACAMBIRA JB. 2016. Lateritic terrains and the evolution of pseudokarstic features - case study in the iron ore mine N4E, Carajás Region – Pará, Brazil. In: 24th World Mining Congress. Rio de Janeiro, RJ, Brazil. Instituto Brasileiro de Mineração – IBRAM, 3: 242-251. GRIMES KG & SPATE A. 2008. Laterite karst. ACKMA Journal, 73: 49-52. HOOVER RA. 2003. Geophysical choices for karst investigations. In: YUHR LB, ALEXANDER JR EC & BECK BF (Eds.). Sinkholes and the Engineering and Environmental Impacts of Karst. ASCE, p. 529-538. LIMA PHA, SOARES JA, ROSA IBC, CARVALHO RF, BRAGA MA & SILVA MD. 2013. Petrofísica de Minério de Ferro. In: 13th International Congress of the Brazilian Geophysical Society & EXPOGEF. Rio de Janeiro, RJ, Brazil. SBGf.
LOBATO LM, ROSIÈRE CA, SILVA RCF, ZUCHETTI M, BAARS FJ, SEOANE JCS, RIOS FJ, PIMENTEL M, MENDES GE & MONTEIRO AM. 2005. A mineralização hidrotermal de ferro da Província Mineral de Carajás-Controle estrutural e contexto na evolução metalogenética da província. In: ADIMB/DNPM. Caracterização de depósitos minerais em distritos mineiros da Amazônia. Brasília: DNPM-CT/MINERAL-ADIMB, 21-92.
MARTÍNEZ-MORENO FJ, GALINDO-ZALDÍVAR J, PEDRERA A, TEIXIDO T, RUANO P, PEÑA JÁ, GONZÁLEZ-CASTILLO L, RUIZ-COSTÁN A, LÓPEZ-CHICANO M & MARTÍN-ROSALES W. 2014. Integrated geophysical methods for studying the karst system of Gruta de las Maravillas (Aracena, Southwest Spain). Journal of Applied Geophysics, 107: 149-162.
MAURITY CW & KOTSCHOUBEY B. 1995. Evolução recente da cobertura de alteração no Platô N1, Serra dos Carajás PA. Degradação, pseudocarstificação, espeleotemas. Boletim do Museu Paraense Emílio Goeldi. Série Ciências da Terra, 7: 331-362.
PEREIRA RMP. 2009. Geologia da região Sul da Serra Norte e características do minério de ferro do Depósito N8, Província Mineral Carajás. Master Dissertation on Geology. Universidade Federal de Minas Gerais, Brazil. 143 pp.
PILÓ LB & AULER A. 2009. Geoespeleologia das cavernas em rochas ferríferas da região de Carajás, PA. In: 39º Congresso Brasileiro de Espeleologia. Montes Claros, MG, Brazil. p. 181-186.
PROSDOCIMI GAS. 2019. Avaliação das relações lito-estruturais em cavidades ferríferas, com base em métodos geofísicos – estudo de caso: cavidade ferrífera da Província Carajás/PA. 2019. Master Dissertation in Geotechnics – Programa de Pós-graduação em Geotecnia. Escola de Minas. Universidade Federal de Ouro Preto, Brazil, 154 pp.
SERRA OE. 1983. Fundamentals of well-log interpretation. Netherlands, Springer, 424 pp.
TAVARES FM. 2015. Evolução geotectônica do nordeste da Província Carajás. Doctorate on Geology Thesis. Universidade Federal do Rio de Janeiro, Brazil. 143 pp.
TELFORD WM, GELDART LP & SHERIFF RE. 1990. Applied Geophysics. vol. 1, Cambridge University Press, 860 pp.
VASQUEZ LV, ROSA-COSTA LR, SILVA CG, RICCI PF, BARBOSA JO, KLEIN EL, LOPES ES, MACAMBIRA EB, CHAVES CL, CARVALHO JM, OLIVEIRA JG, ANJOS GC & SILVA HR. 2008. Geologia e Recursos Minerais do Estado do Pará: Sistema de Informações Geográficas – 53 SIG: Texto Explicativo dos Mapas Geológico e Tectônico e de Recursos Minerais do Estado do Pará, 1:1.000.000. CPRM, Belém, Brazil.
Recebido em 30 de julho de 2019 / Aceito em 6 de janeiro de 2020 Received on July 30, 2019 / Accepted on January 6, 2020