Acta Scientiarum
http://www.uem.br/acta ISSN printed: 1806-2636 ISSN on-line: 1807-8672
Doi: 10.4025/actascianimsci.v37i3.26872
Nutritive value of pastures of
Cynodon
mixed with forage peanut in
southwestern Paraná State
Magnos Fernando Ziech1*, Clair Jorge Olivo2, Ana Regina Dahlem Ziech3, Wagner Paris1,Carlos Alberto Agnolin2 and Gilmar Roberto Meinerz4
1
Universidade Tecnológica Federal do Paraná, Estrada para Boa Esperança, km 4, 85660-000, Dois Vizinhos, Paraná, Brazil. 2Universidade Federal de Santa Maria, Santa Maria, Rio Grande do Sul, Brazil. 3Instituto Federal do Mato Grosso do Sul, Ponta Porã, Mato Grosso do Sul, Brazil. 4
Universidade Federal Fronteira Sul, Cerro Largo, Rio Grande do Sul, Brazil. *Autor para correspondência. E-mail: magnos@utfpr.edu.br
ABSTRACT. This study evaluated the nutritive value of pastures of Coastcross-1 and Tifton 85 mixed
with increasing inclusion of forage peanut (0, 25, 50, 75% occupancy area), subjected to cuts, over two study years in Southwestern Paraná State. The experimental design was factorial (three factors) distributed in randomized block. The factors were cultivars (2), the occupancy area of forage peanut (4) and seasons of cuts (5), with three replications. It was evaluated the percentage of crude protein, neutral detergent fiber and in vitro digestibility of dry matter of leaf blades, stem + sheath of grasses and available forage mass of pastures. Values of crude protein ranged from 17.0 to 20.4% and from 16.8 to 19.3% for the forage mass available of Coastcross-1 and Tifton 85, respectively. Higher digestibility values were found at the beginning of evaluations. On average, the Coastcross-1 showed better nutritive value compared to Tifton 85, and, the inclusion of forage peanut increased crude protein content in leaf blades of grasses studied, in the second year after planted.
Keywords: chemical composition, digestibility, NDF, CP.
Valor nutritivo de pastagens de
Cynodon
consorciadas com amendoim forrageiro no
sudoeste do Estado do Paraná
RESUMO. O objetivo da pesquisa foi avaliar o valor nutritivo de pastagens de Coastcross-1 e Tifton 85
consorciadas com amendoim forrageiro (0, 25, 50 e 75% da área implantada), submetidas a cortes ao longo de dois anos de estudo, em área localizada no Sudoeste do Paraná. O delineamento experimental foi o fatorial (três fatores), distribuídos em blocos ao acaso com três repetições. Os fatores foram as cultivares (2), o percentual de área implantada com o amendoim forrageiro (4) e as estações do ano que apresentaram condições de corte (5). Avaliaram-se os percentuais de proteína bruta, fibra em detergente neutro e digestibilidade in vitro da massa seca das lâminas foliares, colmo + bainha das gramíneas e da massa de forragem disponível das pastagens. Os valores de proteína bruta variaram de 17,0 a 20,4% e 16,8 a 19,3 % para a massa de forragem disponível de Coastcross-1 e Tifton 85, respectivamente. Maiores valores de digestibilidade foram verificados no início das avaliações. Em média, a cv. Coastcross-1 apresentou melhor valor nutritivo quando comparada ao capim Tifton 85, e, a maior contribuição de amendoim forrageiro elevou os teores de proteína bruta nas lâminas foliares das gramíneas estudadas, a partir do segundo ano de estabelecimento.
Palavras-chave: composição química, digestibilidade, FDN, PB.
Introduction
In most of the dairy farms that use tropical grasses for cattle feed, the implementation is performed exclusively with the grass, and the response of these forages depends on management conditions(Moreira et al., 2004). Accordingly, the nitrogen (N) fertilization increases productivity by changing the production and nutritive value of the pasture (Barbero et al., 2010) elevating; however, production costs. Also, it is noteworthy that the singular cultivation implies greater
Cynodon grasses, especially the cultivars Coastcross-1 and Tifton 85, have been used because of their quality and production characteristics and their continuity, getting adapted to different regions of the country. In mixed pastures, forage peanut
Arachis pintoi (Krap. and Greg.) has stood out in
research conducted in tropical and subtropical regions, showing satisfactory development with aggressive grasses, such as Cynodon species. In addition, studies on the quality of this forage show that the nutritive value is high, with crude protein content between 15 and 22% and digestibility between 62 and 73% (Nascimento, 2014).
Studies on Cynodon pastures mixed with forage peanut since planting could contribute effectively to the study of forage systems including these species, providing the qualitative variations, thus contributing to a better understanding of their nutritional capacity. In this way, the goal of this research was to evaluate the effects of the occupancy area with forage peanut in Coastcross-1 or Tifton 85 pastures, evaluated during two growing seasons, on the nutritive value of the structural components and the forage mass available.
Material and methods
This study was conducted in an experimental area, from August 2011 to May 2013, belonging to the Unit for Education and Research (UNER) in Dairy Cattle, Federal Technological University of Paraná (UTFPR) - Dois Vizinhos Campus, located in the physiographic region called Third Plateau of Paraná, with an average altitude of 520 m, latitude 25°44” South and longitude 53°04” West. The climate is Cfa (humid subtropical), according to Köppen, without a well-defined dry season, the average temperature of the warmest month is 22°C. Weather conditions related to temperature and rainfall during the study are similar to the normal of the region (Figure 1).
It was used an area with approximately 400 m2 and two Cynodon cultivars (Tifton 85 and Coastcross-1), considered as a factor A (qualitative). At planting, it was used different occupancy areas (0, 25, 50 and 75%) of stoloniferous forage peanut, cv. Amarillo, considered as Factor B (quantitative). The pastures (both grasses and legume) were planted in 2 x 6 m plots, using seedlings. These were implanted every 33 cm linearly and 50 cm apart between rows, totaling 60,000 seedlings ha-1. Pastures consisted of Tifton 85 in pure culture; Tifton 85 mixed with forage peanut successively of three rows for the grass and one for the legume (providing 25% of the area for the legume development); Tifton 85 mixed with
forage peanut successively of two rows for the grass and two for the legume (providing 50% of the area for the legume development); Tifton 85 mixed with forage peanut successively of one row for the grass and three for the legume (providing 75% of the area for the legume development). The same procedure was performed for the Coastcross-1 cultivar.
Aug/ 201 1 Sep/ 2011 Oct/20 11 Nov/ 2011 Dec /201 1 Jan /2012 Feb/2 012 Mar/2 012 Apr/2 012 May/ 201 2 Jun /2012 Jul/2 012 Aug/ 2012 Sep/ 2012 Oct/20 12 Nov/ 201 2 Dec /201 2 Jan/2 013 Feb/2 013 Mar/ 2013 Apr/20 13 May /2013 R a in fa ll ( m m ) 0 25 50 75 100 125 150 175 200 225 250 275 300 325 350 375 400 A v era ge Tem pera ture ( ºC ) 0 5 10 15 20 25 30 Rainfall (mm)
Average Temperature (ºC)
Figure 1. Average monthly temperature (°C) and rainfall (mm). Dois Vizinhos, Paraná State, 2013.
Before the establishment of the pastures, weed control was performed by manual weeding and one desiccation (glyphosate - 3,0 L ha-1). At the time of the experiment, soil analysis (0-20 cm) showed pH (H2O) = 5.5; OM (%) = 3.9; Clay (%) = 54; Mehlich-P (mg dm-3) = 4.5; K (cmol
c dm3) = 0.2 Ca (cmolc dm-3) = 8.8; Mg (cmolc dm3) = 3.4; H+Al (cmolc dm3) = 3.5; effective CEC (cmolc dm3) = 12.6; Al saturation (%) = 0.0; Bases (%) = 78.2. Considering this analysis for the mixed of grasses with tropical legumes, before planting, we applied 2.2 ton ha-1 limestone (filler – PRNT > 90%) seeking to reach pH 6.0. For fertilization it was used 120 kg ha-1 P
2O5 and 60 kg ha-1 of K2O in the formulation 05-20-10 at the establishment of the pastures, comprising the first growing year and 60 kg ha-1 of both P
2O5 and K2O formulation 05-20-20 for the next year. For the establishment of Arachis in the system, we used 80 kg ha-1 year-1 N, avoiding losses on Rhizobium nodulation. For the second growing year, it was standardized 20 kg ha-1 N every two cuts, totaling 60 kg ha-1 year-1 N.
Tifton 85 and Coastcross-1 established with legumes 245
off, standardizing the plots. The forage cut was removed from the experimental unit.
After, the collected samples were weighed, homogenized, a sub sample was taken to determine the botanical composition, making the separation between species. For grasses, was separated the structural components (leaf blade, stem + sheath and dead + senescent material). The procedure was carried out immediately after the cut, the samples were weighed and dried in an oven with forced air circulation at 60°C to constant weight to determine the dry matter (DM) of each component. Thus, in proportion to each species or plant component, it was estimated DM percentage of the pasture.
The fractions leaf blade, stem + sheath, in addition to whole plant of forage peanut were ground in Wiley type mill equipped with 2 mm sieve, identified and placed in plastic bags. For analysis, composite samples were formed by blending the materials of the cuts made in each season. Subsequently, total DM was determined in an oven at 105°C for 16 hours; crude protein (CP), by micro Kjeldahl method, neutral detergent fiber (NDF), according to Van Soest et al. (1991) and in
vitro dry matter digestibility (IVDMD) adapted to
artificial rumen (Ankom®).
To estimate CP of the forage mass, we used the equation [(% CP leaf blade x leaf blade participation in the season) + (% PB stem + sheath x stem + sheath participation) + (% CP peanut forage x forage peanut participation)/100], also being applied to other nutritional variables. The data used were obtained after the botanical separation in each period.
The experiment was a randomized block design distributed in a factorial 2 x 4 x 5 arrangement (cultivars x implanted area with forage peanut x seasons) with three replications. Data were subjected to analysis of variance and polynomial regression, adopting the significance level of 5% error probability. The samples were analyzed using the statistical software Genes – UFV, and means were compared by Tukey’s test.
The statistical model on the analysis of variables of the pasture was represented by: Yijk = μ + Bijk +Ti + Dj + Pk + TiDj + TiPk + DjPk + TiDjPk + εijk:
In which Yijkl represents the dependent variables; i, factor A index, qualitative (cultivars); j, factor B index, quantitative (occupancy area of forage peanut); k, period index (seasons); l, repetition index; μ is the mean of all observations; Bijk is the effect of the blocks; Ti is the effect of cultivars; Dj, is the effect of the occupancy area of forage peanut; Pk is the effect of seasons; TiDj is the interaction between cultivars and the occupancy area of forage peanut; TiPk is the interaction between
cultivars and seasons; DjPk is the interaction between the occupancy area of forage peanut and seasons; TiDjPk is the interaction between cultivars, the occupancy area of forage peanut and the seasons and εijk corresponds to the residual experimental error.
Results and discussion
Pastures reached the height for cut (20-25 cm) about three months after planting, in December 2012. In the second year, cuts started in October 2012. In the period, 14 cuts were made (8 in the first and 6 in the second year). Average weight values of available forage (above 7 cm of soil) in each season were proportionately lower in the first year and higher in the other seasons, in which there was possibility of cutting (Table 1), highlighting the production in the fall, when there is usually shortage of forage, as the winter cycle crops are not always available. In relation to the participation of legumes, there was proportionality with the occupancy area, although with lower mass due to their slow growth and the aggressiveness of grasses.
Regarding the structural composition of grasses, there was a greater participation of leaf blade in most of the evaluated seasons, even in the fall, considered as critical (from the second year, with fully established pastures). In general, it is observed that the legume inclusion had no influence on the structural composition of grasses.
Table 1. Average value in each season of forage mass, leaf:stem + sheath ratio, participation (%) of forage peanut and number of cuts in Coastcross-1 and Tifton 85 pastures in two growing years. Dois Vizinhos, Paraná State, 2013.
Forage mass (kg ha-1
DM) Coastcross-1
---
Tifton 85
---
FP (%) Sum 2011/2012 Fal 2012 Spr 2012 Sum 2012/2013 Fal 2013 Sum 2011/2012 Fal 2012 Spr 2012 Sum 2012/2013 Fal 2013 0 1,492 1,312 2,841 2,464 3,153 1,546 1,087 3,029 2,533 3,170 25 1,374 1,254 2,967 2,922 2,826 1,490 1,136 3,060 2,763 2,922 50 1,238 1,505 2,886 2,573 3,194 1,360 1,369 3,156 2,701 3,140 75 934 1,441 2,907 2,663 3,154 1,023 1,336 3,447 2,818 3,412
Leaf:stem+sheath ratio
0 1.93 1.61 1.30 1.27 0.73 1.81 2.12 1.67 1.63 1.71
25 1.85 1.47 1.23 1.20 0.81 1.69 2.34 1.76 1.53 1.70
50 1.87 1.50 1.27 1.16 0.84 1.72 2.13 1.73 1.53 1.70
75 1.73 1.56 1.22 1.20 0.60 1.58 2.09 1.62 1.42 1.35
Stoloniferous forage peanut (%)
0 0.00 0.00 0.00 0.00 0.00 0.00 0.00 0.00 0.00 0.00
25 3.45 3.12 5.45 4.30 5.48 1.83 4.80 7.02 3.86 6.00
50 3.64 5.62 11.26 11.59 10.17 6.49 12.57 14.48 10.46 12.27
75 13.81 21.03 24.34 23.71 32.63 9.56 20.63 25.96 26.28 29.90
Number of cuts
4 3 4 2 1 4 3 4 2 1
Data not statistically tested. FP = occupancy area of forage peanut.
Table 2. Means of the interaction for crude protein (CP) in leaf blades and in forage mass between the Cynodon cultivars established alone or mixed with forage peanut. Dois Vizinhos, Paraná State, 2013.
CP Leaf blades (%)
Cultivars Summer:2011/2012 Fall:2012 Spring:2012 Summer:2012/2013 Fall:2013
Coastcross-1 22.56aA 22.98aA 20.54aB 21.09aB 20.19aB
Tifton 85 20.69bA 20.50bA 17.02bB 17.90bB 18.74bAB
CP Forage mass (%)
Coastcross-1 20.31aA 20.40aA 18.60aB 18.71aB 16.95aC
Tifton 85 18.54bAB 19.33aA 16.82bC 16.91bC 17.18aBC
Values followed by different uppercase letters in the same row and lowercase letters in the same column are significantly different by Tukey’s test (p < 0.05).
The CP of available forage mass (Table 2), which considers the proportionate participation of the pasture components, showed a trend similar to that of leaf blade, with higher levels for the cv. Coastcross-1. However, in the fall, in both years, there was no significant difference between cultivars, possibly due to the lower participation of stems in pastures established with Tifton 85 in this season (Table 1). Thus, the highest percentage of leaf blade contributed to increase the protein content of the pasture. For Coastcross-1, intermediate values were observed in summer 2012 and spring 2012/2013, being lower in the last period. In Tifton 85, CP content in forage mass was similar between the seasons during the second year. A study of Quaresma et al. (2011) analyzed protein value of Tifton 85 under five levels of N supply (0, 60, 120, 180 and 240 kg ha-1) managed under cutting every 30 days in Cáceres, Mato Grosso State, found that nitrogen fertilization caused a linear increase in CP content for mass 5 cm above the ground and average height close to 50 cm, with a maximum value of 11.8%, lower than in the present study. This result indicates that the height set between 20 and 25 cm for the cut material caused the collection of material with higher protein contents.
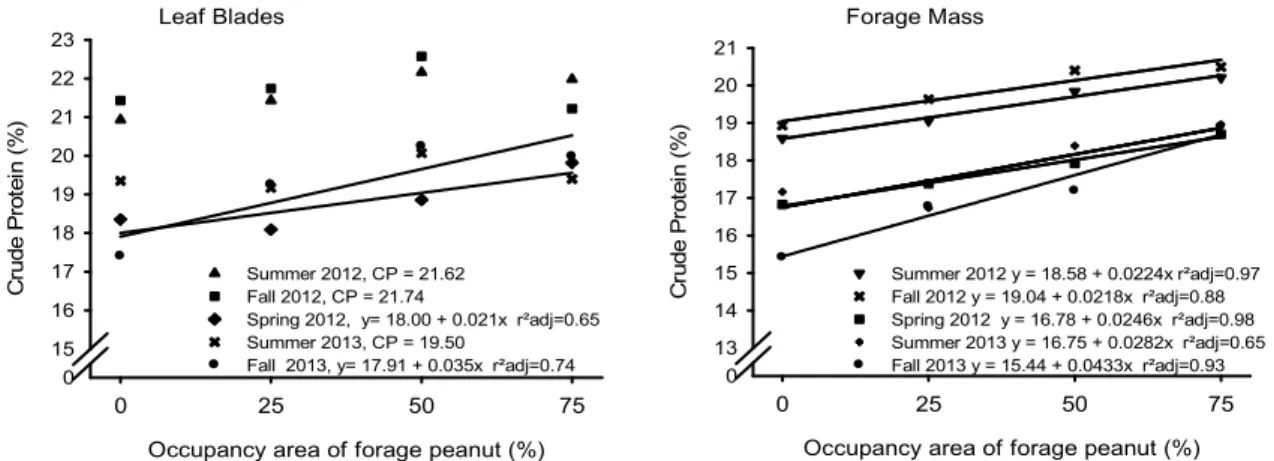
For the percentage of CP in leaf blades, a significant interaction (p < 0.05) was detected
between the percentage of occupancy area of peanut forage in pastures and seasons (Figure 2). For the summer 2011/2012 and the fall 2012 and summer 2012/2013, there was no significant interaction, and the mean values were respectively 21.6; 21.7 and 18.8% CP. In the other periods, there were linear upward effects, thus, higher CP percentages were observed in intercropping with the largest occupancy area of peanut forage, indicating a possible association with this legume from the second year. The lack of significance for the summer 2012/2013 may be related to reduction of regular rainfall early in the season (Figure 1).
For forage mass CP, there was interaction between seasons and occupancy area with peanut forage (Figure 2). For all seasons there was a linear upward effect, indicating that the increasing area and consequent participation of peanut forage in the pasture increased CP content, due to the higher protein value of this species.
Tifton 85 and Coastcross-1 established with legumes 247
Occupancy area of forage peanut (%)
0 25 50 75
C
rud
e Pr
ot
ei
n (
%
)
0 13 14 15 16 17 18 19 20 21
Summer 2012 y = 18.58 + 0.0224x r²adj=0.97 Fall 2012 y = 19.04 + 0.0218x r²adj=0.88 Spring 2012 y = 16.78 + 0.0246x r²adj=0.98 Summer 2013 y = 16.75 + 0.0282x r²adj=0.65 Fall 2013 y = 15.44 + 0.0433x r²adj=0.93
Occupancy area of forage peanut (%)
0 25 50 75
C
ru
d
e
Pr
ot
ei
n
(%
)
0 15 16 17 18 19 20 21 22 23
Summer 2012, CP = 21.62 Fall 2012, CP = 21.74
Spring 2012, y= 18.00 + 0.021x r²adj=0.65 Summer 2013, CP = 19.50
Fall 2013, y= 17.91 + 0.035x r²adj=0.74
Forage Mass Leaf Blades
Figure 2. Means and regression equations for crude protein of leaf blades and the forage mass of the interaction between seasons and occupancy area with forage peanut in pastures. Dois Vizinhos, Paraná State, 2013.
Table 3. Crude protein (CP) of stem + sheath (SS), neutral detergent fiber (NDF) of leaf blades (LF) and SS and in vitro dry matter digestibility (IVDMD) of LF, SS and forage mass (FM) in Coastcross-1 and Tifton 85 pastures established alone or mixed with peanut along the seasons in two consecutive years. Dois Vizinhos, Paraná State, 2013.
Variables (%)
Cultivars CP SS NDF LF NDF SS IVDMD LF IVDMD SS IVDMD FM Coastcross-1 14.50a 70.37b 75.01ns 65.96a 59.39ns 63.93a
Tifton 85 13.69b 73.02a 75.70 63.41b 59.67 62.92b
Inclusion of FP (%)
0 14.10ns 71.83ns 74.99ns 64.74ns 59.33ns 62.68ns
25 13.88 71.70 75.49 64.70 60.02 63.22
50 13.98 71.75 73.35 64.22 58.80 62.95
75 14.42 71.50 75.57 65.07 59.96 64.86
Seasons
Summer 2012 14.76ab 70.57ns 74.29ns 75.53a 67.04a 72.58a
Fall 2012 14.90a 71.40 74.72 66.82b 61.17b 64.87b
Spring 2012 14.59ab 71.79 75.48 63.67c 59.58b 62.78b Summer 2013 13.57ab 73.68 76.81 59.19d 56.43c 59.24c
Fall 2013 12.63b 71.03 75.46 58.20d 53.44d 57.66c
CV % 6.77 2.46 2.30 4.05 4.17 3.24
Values followed by different lowercase letters in the same column are significantly different by Tukey’s test (p < 0.05). ns = non-significant.
A study performed by Paciullo et al. (2001) examined Tifton 85 pastures in Viçosa, Minas Gerais State and found values close to 7.0% CP in stems collected close to the ground, lower than in the present study. However, the authors indicate that with the advance in stem development results in reduced CP values. In this research, the values were higher and uniform, with evidence of decrease in protein content after the full establishment of crops, as seen between the fall 2012 and fall 2013. This result can be attributed to the increased percentage of stems in forage mass (Table 1). Branco et al. (2012) investigated the cultivar Coastcross-1 in Luisiana, Paraná State, and found a correlation between CP content of the stem with rainfall. In this study the highest value found for the stem CP was 10.3%.
As for NDF content in the leaf blades, there was also no interaction or effect of the occupancy area of peanut in the pastures (Table 3). Considering the factors separately, there was a higher percentage of NDF for Tifton 85 (73.02%), 6.4% higher than the Coastcross-1. In a study conducted at the Agronomic Institute of Paraná in Paranavaí, Paraná
State, using Coastcross-1 alone, intercropped with
Arachis pintoi and subjected to N fertilization, Paris
et al. (2009) found an average of 68.2% NDF for leaf blade. In the same place, Barbero et al. (2010) obtained values of 70.1 and 68.1% in leaf blades of mixed pastures provided or not with 100 kg ha-1 year-1 N, respectively.
For the present study, throughout the seasons, the results were similar, averaging 71.9% NDF in leaf blades. Lower values were verified by Barbero et al. (2010), with values of 67.9; 68.6 and 67.4% NDF for leaves of Coastcross-1 intercropped with peanut + 100 kg ha-1 year-1 N in the spring, summer and fall, respectively.
Occupancy area of forage peanut (%)
0 25 50 75
Ne
utra
l de
terg
en
t f
ibe
r (%
)
0.0 63.0 64.5 66.0 67.5 69.0 70.5 72.0 73.5 75.0
Summer 2012 y = 71.27 - 0.0515x r²adj=0.86 Fall 2012 y = 71.82 - 0.0638x r²adj=0.93 Spring 2012 y = 72.71 - 0.0748x r²adj=0.98 Summer 2013 y = 74.44 - 0.0680x r²adj=0.64 Fall 2013 y = 74.77 - 0.1277x r²adj=0.73
Occupancy area of forage peanut (%)
0 25 50 75
Ne
utra
l de
ter
gen
t f
ibe
r (
%
)
0.0 63.0 64.5 66.0 67.5 69.0 70.5 72.0 73.5 75.0 76.5
Summer 2012 y = 73.06 - 0.0375x r²adj=0.77 Fall 2012 y = 74.48 - 0.0747x r²adj=0.93 Spring 2012 y = 73.60 - 0.0692x r²adj=0.93 Summer 2013 y = 76.20 - 0.0814x r²adj=0.96 Fall 2013 y = 73.57 - 0.1055x r²adj=0.62
Coastcross-1 Tifton 85
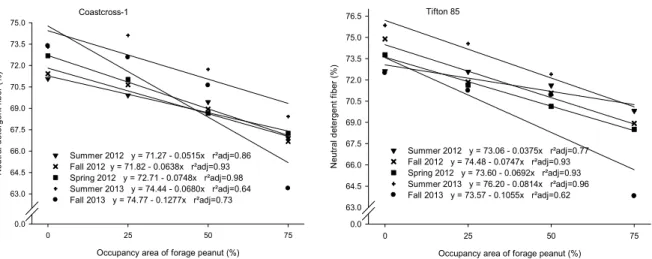
Figure 3. Regression equations for neutral detergent fiber (NDF) in the forage mass of the interaction between Cynodon cultivars, seasons and occupancy area of forage peanut. Dois Vizinhos, Paraná State, 2013.
Concerning the participation of the botanical and structural components in the forage mass, there was a significant interaction (p < 0.05) among the three factors (cultivars x occupancy area of peanut forage x seasons). In this sense, a greater inclusion and participation of forage peanut, provided a decrease in NDF of forage mass (Figure 3). There was also smaller NDF content in pastures made up of the cv. Coastcross-1.
From the linear equations, we registered an average decrease of 0.065% in the NDF content for each 1% of implanted area of legume in pastures for the first four seasons evaluated for both cultivars. Nevertheless, in the fall 2013, there were reductions above 0.1%, which is explained by the increasing participation of forage peanut in the forage mass of pastures along the seasons (Table 1) and also due to the low percentage of NDF of this legume (Nascimento, 2014). The decrease in NDF, mainly in summer pastures, is desirable because it is associated with the increase in forage intake (Van Soest et al., 1991).
There was no significant interaction for IVDMD (Table 3), and also no effect of the participation of forage peanut on the digestibility of leaf blade and stem + sheath. However, there was a higher IVDMD of leaf blades and forage mass for Coastcross-1, being respectively 4.0 and 1.6% higher than the pastures of Tifton 85. A similar result was found by Paciullo et al. (2001), who applied 60 kg ha-1 N and registered, for the summer, 66.1 and 55.5% IVDMD for leaf blade and stem + sheath of Tifton 85, respectively.
For the IVDMD of stem + sheath, there were similar values between cultivars. During the study, there was a higher IVDMD for leaf blades
in the beginning of the study, with a subsequent decrease with each new season. This trend was also observed for the same variable in stems and in forage mass. The reduction in IVDMD between the first and last season was 29.8; 25.4 and 25.9% in the leaf blade, the stem + sheath and the pasture, respectively. This decrease can be related to a possible deficit of N in the pasture, since the increase in N doses in Cynodon dactylon pasture promotes a greater IVDMD (Oliveira et al., 2011). According to Paris et al. (2009), Coastcross-1 pastures intercropped with forage peanut without nitrogen fertilization exhibit an average of 60.4% of IVDMD in leaf blades, increasing to 63.9% with the addition of 100 kg ha-1 N and 66.0% in pasture of Coastcross-1 alone fertilized with 200 kg ha-1 N. In turn, for stem + sheath, these same authors found no effect of nitrogen fertilization, registering an average of 54.0% of IVDMD. Ribeiro et al. (2012) found IVDMD values higher than those in the present study, 77.6; 75.1 and 69.0% in leaf blades and 66.4; 64.9 and 61.5% for stem + sheath in the spring, summer and fall, respectively.
Conclusion
The cultivar Coastcross-1 has better nutritive value compared to Tifton 85.
A larger occupancy area of peanut has positive effects, increasing the crude protein content in leaf blades of grasses studied, from the second year after planting.
Tifton 85 and Coastcross-1 established with legumes 249
References
Barbero, L. M., Cecato, U., Lugão, S. M., Gomes, J. A., Limão, V. A., Abrahão, J. J. & Roma, C. F. (2010). Produção animal e valor nutritivo da forragem de pastagem de coastcross consorciada com amendoim forrageiro: Animal production and nutritive value of a coastcross pasture mixed with forage peanut. Arquivo Brasileiro de Medicina Veterinaria e Zootecnia, 62(3), 645-653.
Branco, A. F., Viana, K. B., Castañeda, R. D., Prohmann, P. E., Coneglian, S. M. & Mouro, G. F. (2012). Chemical composition and crude protein fractions of Coastcross grass under grazing on winter, spring and summer in Southern Brazil. Acta Scientiarum. Animal Sciences, 34(2), 183-187.
Carnevalli, R. A., Silva, S. C., Fagundes, J. L., Sbrissia, A. F., Carvalho, C., Pinto, L. & Pedreira, C. (2001). Desempenho de ovinos e respostas de pastagens de Tifton 85 (Cynodon spp.) sob lotação contínua. Scientia Agricola, 58(1), 7-15.
Lenzi, A., Cecato, U., Machado Filho, L. C., Gasparino, E., Roma, C. F., Barbero, L. M. & Limão, V. A. (2009). Produção e qualidade do pasto de coastcross consorciado ou não com amendoim forrageiro com ou sem aplicação de nitrogênio; Production and quality of coastcross pasture associated or not with forage peanut with or without nitrogen. Arquivo Brasileiro de Medicina Veterinaria e Zootecnia, 61(4), 918-926.
Moreira, F. B., Prado, I. N., Cecato, U., Wada, F. Y. & Mizubuti, I. Y. (2004). Forage evaluation, chemical composition, and in vitro digestibility of continuously grazed star grass. Animal Feed Science and Technology, 113(1), 239-249.
Nascimento, I. S. (2014). O cultivo do amendoim forrageiro. Current Agricultural Science and Technology, 12(4), 387-393.
Oliveira, M. A., Pereira, O. G., Ribeiro, K. G., Santos, M. E., Chizzotti, F. H. & Cecon, P. R. (2011). Produção e valor nutritivo do capim-coastcross sob doses de nitrogênio e idades de rebrotação; Production and nutritional value of bermudagrass cv. coastcross grown under different nitrogen doses and regrowth ages.
Arquivo Brasileiro de Medicina Veterinaria e Zootecnia, 63(3), 694-703.
Olivo, C. J., Ziech, M. F., Meinerz, G. R., Agnolin, C. A., Tyska, D. & Both, J. F. (2009). Valor nutritivo de
pastagens consorciadas com diferentes espécies de leguminosas. Revista Brasileira de Zootecnia, 38(8), 1543-1552.
Paciullo, D. S. C., Gomide, J. A., Queiroz, D. S. & Silva, E. (2001). Composição química e digestibilidade in vitro de lâminas foliares e colmos de gramíneas forrageiras, em função do nível de inserção no perfilho, da idade e da estação de crescimento. Revista Brasileira de Zootecnia, 30(3), 964-974.
Paris, W., Cecato, U., Martins, E. N., Limão, V. A., Galbeiro, S. & Oliveira, E. (2009). Estrutura e valor nutritivo da pastagem de Coastcross-1 consorciada com
Arachis pintoi, com e sem adubação nitrogenada. Revista Brasileira de Saúde e Produção Animal, 10(3), 513-524. Quaresma, J. P. S., Almeida, R. G., Abreu, J. G., Oliveira,
M. A. & Carvalho, D. M. G. (2011). Produção e composição bromatológica do capim-tifton 85 (Cynodon spp.) submetido a doses de nitrogênio. Acta Scienciarum. Animal Sciences, 33(2), 145-150.
Ribeiro, K. G. & Pereira, O. G. (2010). Valor nutritivo do capim-tifton 85 sob doses de nitrogênio e idades de rebrotação. Veterinária e Zootecnia, 17(12), 560-567. Ribeiro, O. L., Cecato, U., Rodrigues, A. M., Faveri, J. C.,
Santos, G. T., Lugão, S. M. B., & Beloni, T. (2012). Composição botânica e química da coastcross consorciada ou não com arachis pintoi, com e sem nitrogênio. Revista Brasileira de Saúde e Produção Animal, 13(1), 47-61.
Steinwandter, E., Olivo, C. J., Santos, J. C., Araújo, T. L. R., Aguirre, P. F. & Diehl, M. S. (2009). Produção de forragem em pastagens consorciadas com diferentes leguminosas sob pastejo rotacionado. Acta Scientiarum. Animal Sciences, 31(2), 131-137.
Van Soest, P. J., Robertson, J. B. & Lewis, B. A. (1991). Methods for dietary fiber, neutral detergent fiber, and nonstarch polysaccharides in relation to animal nutrition. Journal of Dairy Science, 74(10), 3583-3597.
Received on March 2, 2015. Accepted on May 4, 2015.