Genetic resistance of maize inbred lines to anthracnose leaf blight
Hellen Christine Prochno1, Caroline de Jesus Coelho1, Cristiane Romanek1, Danilo Fernando Guimarães Silva1, Daniele Tasior2, Eduardo Augusto Teixeira Oliveira3, José Raulindo Gardingo1 and Rodrigo Rodrigues Matiello1*
Received 09 June 2015
Accepted 16 September 2015
Abstract – The objectives of this study were to evaluate the resistance of maize inbred lines to anthracnose leaf blight (Colletotrichum graminicola Ces.), and to estimate genetic parameters associated with resistance. Sixteen lines (S5) were evaluated for resistance to anthracnose leaf blight in three experiments, in a randomized block design with four replications. From three evaluations of severity, it was estimated the area under the disease progress curve (AUDPC), and the genetic parameters associated with resistance. Results showed the existence of genetic variability for resistance to anthracnose leaf blight in the set of studied lines. Five lines stood out for the high resistance pattern to anthracnose leaf blight, presenting the lowest AUDPC values in the three experiments, and thus were considered important sources of C. graminicola resistance genes. Estimates of genetic parameters indicated low participation of the environment and highlighted the possibility of genetic gains with artificial selection for resistance in this pathosystem.
Key words: Colletotrichum graminicola, heritability, genes.
Crop Breeding and Applied Biotechnology 16: 55-61, 2016 Brazilian Society of Plant Breeding. Printed in Brazil
ARTICLE
http://dx.doi.org/10.1590/1984-70332016v16n1a9
1 Universidade Estadual de Ponta Grossa, 84.030-900, Ponta Grossa, PR, Brazil. *E-mail: rrmatiel@uepg.br INTRODUCTION
The increase of the cultivated area and the expansion of the maize sowing season contributed to the increase of its production in Brazil (Pinho et al. 1999). However, the absence of crop rotation has favored diseases, which are considered to be of secondary importance in maize (Barbosa 2010). In general, it appears that the damage due to pathogens attack are frequent in all producing regions of Brazil, and up to 80% yield loss is estimated (Pinto et al. 2006).
Anthracnose leaf blight, caused by the fungus
Colletotrichum graminicola (Ces.) GW Wils., has increasingly distinguished itself in view of the Brazilian agriculture. This fact is due to the wide geographical distribution of the pathogen, which extends though the main producing areas of the country (Casela et al. 2006). This pathogen can infect any part of the plant, which confirms the destructive potential in susceptible genotypes, both by anthracnose leaf blight and by stalk rot (Ferreira and Casela 2001, Rezende et al. 2004, Matiello et al. 2013).
Anthracnose leaf blight may be detected at any growth stage of the crop; however, it is more evident after anthesis (Badu-Apraku et al. 1987, Leonard and Thompson 1976). Lesions are noted for being round or oval-shaped, of necrotic
brown color, and they may accrete, causing the entire leaf blight. On lesions, it may be observed the formation of a large amount of acervuli, which are signals that help the identification of the disease in field and laboratory (Ferreira and Casela 2001). Lesions of anthracnose leaf blight limit crop yield due to reduction of the photosynthetically active area. Moreover, they serve as a secondary source of inoculum for infection of other parts of the plant, such as stalks and seeds (Bergstrom and Nicholson 1999).
blight, and to estimate genetic parameters associated with resistance in this pathosystem.
MATERIAL AND METHODS
The experiments were carried out in the crop years of 2011/2012 and 2012/2013, at the Farm School “Capão da Onça”, at the State University of Ponta Grossa (UEPG), in the municipality of Ponta Grossa, state of Paraná. Three experiments were installed with sowings on November 24th,
2011; September 28th, 2012; and December 19th, 2012. It
was used 16 inbred lines (S5) of tropical origin, belonging to the breeding program of UEPG, initially originated from crosses between landraces, followed by five consecutive selfing cycles: L 03-2, L 04-2, L 22-1, L 23-1, L 70-2, L 70-4, L 71-1, L 71-2, L 87-3, L 95-1, L 99-3, L 99-4, L 118-4, L 118-8, L 129-118-4, and L 141-1. The experiments were set under no-tillage system on oat straw. The experimental design was a randomized block with four replications. Plots (16) consisted of 4.0 m rows, spaced 0.8 m between rows, with density of 62,000 plants ha-1.
Isolate multiplication and inoculum obtainement “Ori” isolate of C. graminicola was donated by Dow AgroSciences Ltda. (Jardinópolis SP), in the form of discs of culture medium with the fungus, preserved by the Castellani (1939)’s method. The initial multiplication of the pathogen was carried out by transferring the discs to the center of petri dishes containing oatmeal-agar culture (10 g oatmeal, 2.5 g agar, and 250 mL distilled water). The subsequent multiplication of the fungus was carried out using concentrated suspension of spores in Petri dishes containing medium oatmeal-agar culture. Dishes were kept on the laboratory counter at room temperature (± 25 °C) until sporulation of the colonies.
For inoculum preparation, it was added ± 20 mL of sterile distilled water to the dishes with sporulating colonies, followed by scrape of the surface of the culture medium with a brush, in order to release conidia. The concentrated conidial suspension was filtered through a double-layered cheesecloth in order to separate spores from culture medium fragments. The suspension was adjusted to a concentration of 1.0 x 10⁶ conidia mL-1. For each liter of the final conidial
suspension, it was added a drop of Tween 80®.
Inoculation and evaluation of experiments
Inoculations of the pathogen in maize inbred lines were carried out in two consecutive periods at stages V6 and V7, with seven days interval. To ensure the process of colonization/ infection of C. graminicola, foliar inoculations
were carried out in the late afternoon and preceded by rainy periods. Inoculum was applied using a knapsack sprayer calibrated at a constant pressure of 35 Lb pol-2, by compressed
CO2, with full cone nozzle, and 7 mL of conidial suspension was applied into the plant whorl.
Evaluations started with the appearance of the first symptoms of the disease, approximately at 21 days after the first inoculation. Three evaluations were carried out in each experiment, with 15 days interval, at the stages V12, VT, e R3 (Ritchie and Hanway 1989). Characterization of resistance or susceptibility of maize lines to anthracnose leaf blight was carried out through the rating scale, ranging from 1 (highly resistant) to 6 (highly susceptible).
Statistical analysis, genetic diversity and genetic parameter estimates
Severity means of each genotype were used to calculate the area under the disease progress curve (AUDPC), using the formula proposed by Shaner and Finney (1977):
AACPD = Σn i=1
(yi+yi+1)
2 × (ti+1 – ti)
where:
nn = number of evaluations;
yi yi = rating at the evaluation time i (i= 1,...,n);
yi +1 yi +1= rating at the evaluation time i + 1;
titi = evaluation time i;
ti+1ti+1 = evaluation time i + 1.
To verify the efficiency of evaluations as selection criteria for resistance to anthracnose leaf blight, correlation analyses were carried out between the mean severity ratings in the individual evaluations with the AUCPD value. All variables were subjected to individual analysis of variance. Additionally, genetic parameters were estimated (genetic σˆ 2
g and environmental σˆ 2
e variances, broad-sense heritability
hˆ 2
a, coefficients of genetic variation CVg and environmental
variation CVe), through the mathematical expectation of the mean squares of the analysis of variance of each experiment, according to Vencovsky and Barriga (1992).
From the severity ratings and from the AUDPC, it was estimated the genetic divergence between maize inbred lines in each experiment by the Mahalanobis distance (Dij2). From the dissimilarity matrix, it was carried out the
RESULTS AND DISCUSSION
The efficiency of AUDPC for the characterization of resistant genotypes is unquestionable. On the other hand, this method creates a practical obstacle in breeding programs. This is because this estimate requires the completion of at least three evaluations. Thus, due to the large number of genotypes to be evaluated in competition experiments, this method becomes too laborious and costly. Therefore, it becomes necessary to choose the ideal time for severity evaluation, which enables to adequately represent the reactions of different genotypes during the development of the epidemy (Brito et al. 2008).
Correlation analysis between the specific evaluations of disease severity, and the AUDPC may serve as parameter
for the choice of evaluation that better discriminates resistance, resulting in time saving (Vieira et al. 2009). The results of correlation analysis indicated high significant and positive coefficients (p<0.01) between the AUDPC and the specific evaluations for the three experiments (Table 1). Once the highest correlation coefficients of the AUDPC were observed for the 1st and 2nd evaluations (V
12 and VT
stages), the efficiency of this period can be inferred (15 to 35 days after the 2nd inoculation) to discriminate resistance/
susceptibility between maize inbred lines, providing results similar to those obtained by the AUDPC. Other authors have succeeded in evaluating the severity of anthracnose leaf blight in maize with approximately fifteen days after inoculation, corresponding to the V12 stage (Lim and White 1978, Rezende et al. 2004).
Table 1. Correlation coefficients between the three evaluations of anthracnose leaf blight and the area under the disease progress curve (AUDPC) for
the three field experiments
Evaluation/Phenological stage 1
st experiment 2nd experiment 3rd experiment
AUDPC AUDPC AUDPC
1ª/V12 0.93 ** 0.95 ** 0.94 **
2ª/ VT 0.98 ** 0.98 ** 0.95 **
3ª/R3 0.93 ** 0.88 ** 0.89 **
** significant at 1% of probability
Table 2. Summary of the analysis of variance of the severity ratings of the 1st, 2nd and 3rd evaluations of anthracnose leaf blight and the area under the
disease progress curve (AUDPC) for the three field experiments
Source of variation df
Mean Square (1st experiment)
1st evaluation/
V12 stage
2nd evaluation/
VT stage
3rd evaluation/
R3 stage
AUDPC
Blocks 3 0.17 0.93 ** 0.06 932.01 **
Lines 15 1.19 ** 2.59 ** 5.19 ** 3663.42 **
Error 45 0.09 0.20 0.09 143.46
CV (%) 9.98 11.58 6.25 8.09
Mean 2.92 3.81 4.91 148.02
Source of variation df
Mean Square (2nd experiment)
1st evaluation/
V12 stage
2nd evaluation/
VT stage
3rd evaluation/
R3 stage AUDPC
Blocks 3 0.49 ** 0.27 * 0.59 760.38 **
Lines 15 1.20 ** 1.49 ** 1.70 ** 2272.48 **
Error 45 0.10 0.09 0.25 152.38
CV (%) 15.68 12.41 15.96 12.53
Mean 2.02 2.42 3.10 98.56
Source of variation df
Mean Square (3rd experiment)
1st evaluation/
V12 stage
2nd evaluation/
VT stage
3rd evaluation/
R3 stage AUDPC
Blocks 3 0.03 0.52 * 0.42 150.64
Lines 15 0.42 ** 0.89 ** 3.98 ** 1172.84 **
Error 45 0.08 0.15 0.15 110.11
CV (%) 11.73 14.29 10.65 10.50
Mean 2.36 2.72 3.64 99.91
Results of the analyses of variance of individual experiments showed highly significant effect (p<0.01) of lines for the three evaluations and for the AUDPC (Table 2). These evidences allow inferring the existence of variability in the genetic constitution of maize inbred lines, reflecting the differences in resistance and/or susceptibility to anthracnose leaf blight of this set of lines. The coefficients of variation for the three experiments were of low magnitude, with range of 6.26 to 15.96% (Table 2). These values are considered suitable for field trials involving the pathogen x host interaction, and are close to those obtained by other researchers in the same pathosystem (Coêlho et al. 2001,
Rezende et al. 2004, Matiello et al. 2012).
Results of cluster analysis (UPGMA) allowed classifying maize lines according to the degree of resistance to anthracnose leaf blight. The number of clusters is determined according to the Mojena (1977)’s criterion, which is based on the relative size of the fusion levels or the distances in the dendrogram. Using a constant K=1.8, the dendrogram cut-off point was determined at 35% of the maximum distance observed in the clusters fusion levels.
For the 1st experiment, the cluster analysis allowed the
formation of four clusters (Figure 1). Cluster I (CI) consisted
of five lines (L 22-1, L 70-2, L 70-4, L 71-1, L 95-1, and L 99-3), which had, on average, the highest severity ratings in the three evaluations, and consequently had the highest value of the AUDPC (163.52) (Table 3). They were classified as the most susceptible to anthracnose leaf blight.
CII consisted of six lines (L03-2, L70-2, L71-2, L118-8, L 129-4, and L141-1) with mean ratings in the 3rd evaluation
of 4.61, and AUDPC of 143.12. CIII, composed of two lines (L87-3 and L118-4), showed very similar performance to that of CI, with mean rating in the 3rd evaluation of 5.81, and
AUDPC of 160.78. CIV was composed by three lines with higher resistance to anthracnose leaf blight (L04-2, L23-1 and L99-4), with AUDPC of 132.48 (Table 3). The large number of inbred lines classified as susceptible (rating scale and AUDPC) to anthracnose leaf blight in this experiment is justified by high natural concentration of inoculum in the field, since the experiment was installed in the second crop for maize.
In the 2nd experiment, maize lines were clustered into
three clusters (Figure 1). CI consisted of the most resistant lines (L 03-2, L 04-2, L 22-1, L 23-1, L 87-3, L 99-4, L 118-4, and L 118-8), with mean severity ratings ranging from 1.95 (1st evaluation) to 3.05 (3rd evaluation), and mean
AUDPC of 96.59 (Table 3). CII was composed of seven lines, with mean rating in the 3rd evaluation of 3.13, and
AUDPC of 98.34, and was considered moderately resistant to
C. graminicola. The inbred line L70-2 was isolated in CIII,
with the highest susceptibility to anthracnose leaf blight, and with AUDPC of 115.83 (Table 3). In general, there was less progress in the growth rate of anthracnose leaf blight in this experiment (severity ratings and AUDPC), since it was established in September 2012. It coincided with lower average temperatures, and absence of maize crop residues in field, which considerably reduced the amount of infective propagules of C. graminicola in the experimental area.
Results of the 3rd experiment allowed better separation
of maize lines with respect to resistance or susceptibility to anthracnose leaf blight. It was possible to observe the formation of five clusters of inbred lines. CI presented seven moderately resistant lines (L 03-2, L 04-2, L 22-1, L 87-3, L 99-4, L 118-4, and L 118-8), with mean AUDPC of 102.95. CII only had L 23-1 line, with AUDPC of 89.16, and was highly resistant to anthracnose leaf blight. The lines L 71-2, L 95-1 and L 129-4 (resistant) were clustered in CIII, with mean AUDPC of 96.00. CIV had four lines (L 141-1, L 99-3, L 70-4, and L 71-1), with resistance to anthracnose leaf blight similar to CIII. In CV, L 70-2 was isolated from other lines, presenting the highest genetic dissimilarity. L 70-2 showed the highest AUDPC, with mean of 117.30, being classified as highly susceptible to anthracnose leaf blight.
It is observed small variances in reactions of resistance or susceptibility in some inbred lines in the three experiments. Despite this observation, lines L 04-2, L 23-1, L 87-3, L 99-4, and L 118-4 stood out for maintaining the resistance pattern,
Table 3. Mean of the three evaluations and of the AUDCP for each cluster by the UPGMA method
Clusters
1st Experiment
N1 1st evaluation/
V12 stage
2nd evaluation/
VT stage
3rd evaluation/
R3 stage
AUDPC
CI 5 3.13 4.27 5.51 163.52
CII 6 2.89 3.69 4.61 143.12
CIII 2 3.11 4.09 5.81 160.78
CIV 3 2.69 3.36 4.43 132.48
Clusters
2nd Experiment
N 1st evaluation/V
12 stage
2nd evaluation/
VT stage
3rd evaluation/
R3 stage AUDPC
CI 8 1.95 2.39 3.05 96.59
CII 7 2.07 2.39 3.13 98.34
CIII 1 2.24 2.95 3.38 115.83
Clusters
3rd Experiment
N 1st evaluation/V
12 stage
2nd evaluation/
VT stage
3rd evaluation/
R3 stage AUDPC
CI 7 2.42 2.81 3.83 102.95
CII 1 2.21 2.44 2.72 89.16
CIII 3 2.30 2.53 3.55 96.00
CIV 4 2.27 2.63 3.37 95.84
CV 1 2.63 3.26 4.60 117.30
with lower AUDPC values, regardless of the experiment. Out of this set, the lines L 23-1, L 04-2, and L 99-4 had the lowest severity ratings in the three times of evaluation, and also the lowest indices of AUDPC. This reflects higher resistance to the pathogen colonization, possibly due to the presence of genes resistant to anthracnose leaf blight in the genetic constitution of these lines.
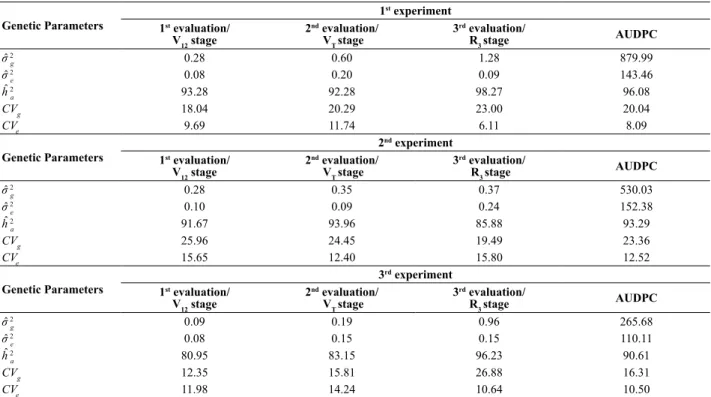
Genetic parameters associated with resistance Results of the decomposition of the phenotypic variance components indicated predominance of genetic variance (σˆ 2
g) in relation to environmental variance (σˆ 2
e), regardless of
the experiment, of the evaluation time, and of the AUDPC values (Table 4). The separation of the phenotypic variance in the genetic and environmental component reinforces the existence of high genetic variability between the studied lines regarding resistance/susceptibility to anthracnose leaf blight, which is possibly associated with the presence of resistance genes in some of the inbred lines.
The broad-sense heritability coefficients (hˆ 2
a) were of
great magnitude, confirming the predominance of the genetic
component associated with resistance to anthracnose leaf blight, regardless of the experiment and of evaluation time (Table 4). The high broad-sense heritability coefficients confirm the low environmental participation in the phenotype composition of maize inbred lines, ratifying the heritability estimates reported in studies related to inheritance of resistance to anthracnose leaf blight in maize (Carson and Hooker 1981, Rezende et al. 2004). High broad-sense heritability coefficients indicate easiness in the process of artificial selection, due to the wide genetic variability and to the small environmental effects associated to it. Additionally, they allow inferring the existence of few genes controlling resistance in this pathosystem.
Estimates of genetic parameters for the three experiments demonstrate the low participation of environmental effects on the expression of resistance to anthracnose leaf blight. Moreover, the estimates allow hypothesizing that the genetic control of maize resistance to anthracnose leaf blight is possibly associated with a small number of genes with great phenotypic contribution for resistance. From this set of maize inbred lines, it is evidenced a very favorable situation for selection of resistance genes to anthracnose leaf blight. Table 4. Estimates of genetic parameters for ratings of the 1st, 2nd and 3rd evaluation of anthracnose leaf blight (Colletotrichum Craminicola), and of the area under the disease progress curve (AUDPC) of the three experiments of maize inbred lines
Genetic Parameters
1st experiment
1st evaluation/
V12 stage
2nd evaluation/
VT stage
3rd evaluation/
R3 stage
AUDPC
σˆ 2
g 0.28 0.60 1.28 879.99
σˆ 2
e 0.08 0.20 0.09 143.46
hˆ 2
a 93.28 92.28 98.27 96.08
CVg 18.04 20.29 23.00 20.04
CVe 9.69 11.74 6.11 8.09
Genetic Parameters
2nd experiment
1st evaluation/
V12 stage
2nd evaluation/
VT stage
3rd evaluation/
R3 stage AUDPC
σˆ 2
g 0.28 0.35 0.37 530.03
σˆ 2
e 0.10 0.09 0.24 152.38
hˆ 2
a 91.67 93.96 85.88 93.29
CVg 25.96 24.45 19.49 23.36
CVe 15.65 12.40 15.80 12.52
Genetic Parameters
3rd experiment
1st evaluation/
V12 stage
2nd evaluation/
VT stage
3rd evaluation/
R3 stage AUDPC
σˆ 2
g 0.09 0.19 0.96 265.68
σˆ 2
e 0.08 0.15 0.15 110.11
hˆ 2
a 80.95 83.15 96.23 90.61
CVg 12.35 15.81 26.88 16.31
CVe 11.98 14.24 10.64 10.50
σˆ 2
g: genetic variance; σˆ
2
e: environmental variance; hˆ
2
REFERENCES
Badu-Apraku B, Gracen VE and Bergstrom GC (1987) A major gene for resistance to anthracnose leaf blight in maize. Plant Breeding 98: 194-199.
Bergstrom GC and Nicholson RL (1999) The biology of corn anthracnose. Plant Disease 83: 596-608.
Barbosa CA (2010) Manual da cultura do milho. AgroJuris, Viçosa, 574p.
Brito AH, Von Pinho RG, Souza Filho AX and Altoé TF (2008) Avaliação da severidade da cercosporiose e rendimento de grãos em híbridos comerciais de milho. Revista Brasileira de Milho e Sorgo 7: 19-31.
Carson ML and Hooker AL (1981) Inheritance of resistance to anthracnose
leaf blight in five inbred lines of corn. Phytopathology 71: 488-491.
Casela CR, Ferreira AS and Pinto NFJA (2006) Doenças na cultura do milho. Embrapa Milho e Sorgo, Sete Lagoas, 14p. (Circular Técnica, 83).
Castellani A (1939) The viability of some pathogenic fungi in sterile distilled water. Tropical Medicine and Hygiene 42: 225-226.
Coêlho RMS, Silva HP, Brunelli KR and Camargo LEA (2001) Controle genético da antracnose foliar em milho. Fitopatologia Brasileira 26: 640-643.
Cruz CD (2013) Genes: a software package for analysis in experimental statistics and quantitative genetics. Acta Scientiarum 3: 271-276.
Ferreira AS and Casela CR (2001) Antracnose do milho (Colletotrichum graminicola). Embrapa Milho e Sorgo, Sete Lagoas, 6p. (Circular Técnica, 13).
Leonard KJ and Thompson DL (1976) Effects of temperature and host maturity on lesion development of Colletotrichum graminicola on corn. Phytopathology 66: 635-639.
Lim SM and White DG (1978) Estimates of heterosis and combining ability for resistance of maize to Colletotrichum graminicola.
Phytopathology 68: 1336-1342.
Matiello RR, Lopes MTG, Brunelli KR and Camargo LEA (2013) Comparison of yield damages of tropical maize hybrids caused by anthracnose stalk rot. Tropical Plant Pathology 38: 128-132.
Matiello RR, Brunelli KR, Lopes MTG, Morello RMSC, Silva HP and Camargo LEA (2012) Inheritance of resistance to athracnose stalk rot (Colletotrichum graminicola) in tropical maize inbred lines. Crop Breeding and Applied Biotechnology 12: 179-184.
Mojena R (1977) Hierarchical grouping methods and stopping rules - an evaluation. Computacional Journal 20: 359-363.
Pinho RGV, Ramalho MAP, Silva HP, Resende IC and Pozar G (1999) Danos causados pelas ferrugens polissora e tropical no milho. Fitopatologia Brasileira 24: 400-409.
Pinto NFJA, Santos MA and Wruck DSM (2006) Principais doenças da cultura do milho. Informe Agropecuário 27: 82-94.
Rezende VF, Vencovsky R, Cárdenas FEN, Silva HP, Bearzotti E and Camargo LEA (2004) Mixed inheritance model for resistance to anthracnose leaf blight in maize. Crop Breeding and Applied Biotechnology 4: 115-122.
Ritchie S and Hanway JJ (1989) How a corn plant develops. Iowa State University of Science and Technology/Cooperative Extension Service, Ames, 21p. (Special Report, 48).
Shaner G and Finney RF (1977) The effects of nitrogen fertilization on the expression of show-mildwing in knox wheat. Phytopathology 67: 1051-1055.
Vencovsky R and Barriga P (1992) Genética biométrica no
fitomelhoramento. Revista Brasileira de Genética, Ribeirão Preto, 496p.