32EVAPOTRANSPIRATION AND ESTIMATION OF AERODYNAMIC AND STOMATAL CONDUCTANCE IN APEREIRA, D. dos R. et al. FRAGMENT OF ATLANTIC FOREST IN MANTIQUEIRA RANGE REGION, MG*
Donizete dos Reis Pereira1, Carlos Rogério de Mello2, Antônio Marciano da Silva3, Sílvia de Nazaré Monteiro Yanagi4
(received: February 27, 2009; accepted: November 27, 2009)
ABSTRACT: Understanding hydrologic behavior in forested areas, not least the Brazilian Atlantic Forest, is of fundamental importance for environmental modeling. This work aimed to estimate evapotranspiration values in Atlantic Forest remnants of Mantiqueira Range region using water balance calculations, and to estimate parameters (stomatal and aerodynamic conductances) for this vegetation cover using the Penman-Monteith model. In terms of water balance, evapotranspiration accounted for 89% of total precipitation, deep percolation accounted for 13.6% and storage variation was slightly negative over the analysis period. Canopy aerodynamic conductance (ga) presented a minimum value of 0.0921 m s-1, a maximum value of 0.1000 m s-1 and an average value of 0.0993 m s-1. Stomatal conductance (g
s) varied from 0.001 to 0.0046 m s-1, with an average value of 0.0022 m s-1, being influenced by environmental conditions, especially by soil water availability. It was observed that the application of the Penman-Monteith model with average parameter fit (ga and gs) provided good accuracy, especially over the dry season, therefore it can be applied to studies of forest hydrology in fragments of Atlantic Forest in the Mantiqueira Range region, Minas Gerais state.
Key words: Forest hydrology, native forest, water balance.
EVAPOTRANSPIRAÇÃO E ESTIMATIVA DAS CONDUTÂNCIAS AERODINÂMICA E ESTOMÁTICA EM UM FRAGMENTO DE MATA ATLÂNTICA NA REGIÃO DA SERRA DA MANTIQUEIRA, MG
RESUMO: É de fundamental importância para a modelagem ambiental o entendimento do comportamento hidrológico em áreas
florestadas, especialmente da Mata Atlântica brasileira. Neste trabalho, objetivou-se estimar valores de evapotranspiração em área remanescente de Mata Atlântica da Serra da Mantiqueira via balanço hídrico, bem como, parâmetros referentes a essa cobertura vegetal (condutância estomática e aerodinâmica), por meio do modelo de Penman-Monteith. Em termos do balanço hídrico, a evapotranspiração correspondeu a 89% do total precipitado, a drenagem profunda a 13,6% e a variação do armazenamento foi ligeiramente negativa durante o período de análise. A condutância aerodinâmica do dossel (ga ) apresentou valor mínimo de 0,0921 m s-1, valor máximo de 0,1000 m s-1 e valor médio de 0,0993 m s-1; a condutância estomática (g
s ) variou de 0,001 a 0,0046 m s-1, com valor médio de 0,0022 m s-1, sendo influenciada pelas condições ambientais, especialmente, a disponibilidade hídrica do solo. Observou-se que a aplicação do modelo Penman-Monteith, com os parâmetros médios ajustados (ga e gs ), apresentou boa precisão, especialmente durante o período seco, podendo ser aplicado em estudos vinculados à hidrologia florestal na região de Mata Atlântica da Serra da Mantiqueira, Minas Gerais.
Palavras-chave: Hidrologia florestal, mata nativa, balanço hídrico.
*Extract from M.Sc. Dissertation by the 1st author. FAPEMIG (CAG – APQ-00942-08)
1Agricultural Engineer, Ph.D. Degree Candidate in Agricultural Engineering – Departamento de Engenharia Agrícola/DEA – Universidade
Federal de Viçosa – Av. P.H. Rolfs, s/n, Campus Universitário – 36570-000 – Viçosa, MG
2Agricultural Engineer, CNPq Scholarship Holder, Lecturer at the Departamento de Engenharia, Setor de Engenharia de Água e Solo –
Universidade Federal de Lavras/UFLA – Cx.P. 3037 – 37200-000 – Lavras, MG – [email protected]
3Agronomic Engineer, CNPq Scholarship Holder, Lecturer at the Departamento de Engenharia, Setor de Engenharia de Água e Solo –
Universidade Federal de Lavras/UFLA – Cx.P. 3037 – 37200-000 – Lavras, MG – [email protected]
4Meteorologist, Postdoctoral Researcher at FAPEMIG – Departamento de Engenharia, Setor de Engenharia de Água e Solo – Universidade
Federal de Lavras/UFLA – Cx.P. 3037 – 37200-000 – Lavras, MG
1 INTRODUCTION
Water balance involves analyzing water cycle components based on a unit volume of soil layer, allowing to identify the pattern of water consumption by plants and its relationship to both soil and climatic conditions.
Transpiration is a mechanism whereby water present in the plants is transferred to the atmosphere via stomata, which are minute pores that control transpiration
33 Evapotranspiration and estimation of aerodynamic...
critical physiological parameter associated with vapor conductance ability, influenced both by leaf water potential and by soil water availability.
Transpiration by vegetation covers has been estimated using the Penman-Monteith equation owing to its more accurate estimates (ALMEIDA & SOARES 2003, ROBERTS et al. 1993). Soares & Almeida (2001) developed a model to estimate water consumption by eucalyptus plants, fitting the Penman-Monteith model to physiological conditions of that species. These authors also developed an adaptation of this model for Atlantic Forest environment in Espírito Santo state looking to compare the hydrologic behavior of these two environments, obtaining good results in terms of water balance modeling. However, studies involving water consumption by Atlantic Forest vegetation in other environmental conditions—as, for instance, in Mantiqueira Range—are nonexistent and yet critical to help ensure sustainable use and management of the local soil and consequently of local water resources.
While investigating water balance in a Eucaliptus
grandis crop in Espírito Santo state, Almeida et al. (2007)
observed that evapotranspiration virtually equals the total precipitation over the analysis period, and also that direct surface runoff only contributed 3.13% of the actual precipitation reaching the soil, demonstrating that most of the rainfall reaching the surface infiltrates the soil and converts into evapotranspiration and groundwater recharge.
Given the above, this work aimed to analyze evapotranspiration in a fragment of Atlantic Forest under the physiographic conditions of Mantiqueira Range, in Minas Gerais state, using water balance modeling, and also to estimate stomatal and aerodynamic conductance parameters using the Penman-Monteith model.
2 MATERIAL AND METHODS 2.1 Study site and water balance
The study site sits within the Lavrinha Creek watershed at an altitude of 1,144 - 1,739 m, in Mantiqueira Range region, Minas Gerais state, close to the municipality of Bocaina de Minas, also MG. The local climate is Cwb according to Köppen classification, with cold, dry winters and mild, rainy summers. Average temperatures in hottest and coldest months are 19°C and 11°C respectively. Water balance was monitored in an fragment of Atlantic Forest classified as Semideciduous Ombrophilous Forest (SCOLFORO et al. 2008). Figure 1a depicts the Lavrinha Creek watershed and the municipality of Bocaina de Minas,
while Figure 1b depicts the study site and the meteorological station.
According to Menezes (2007), the local soil is a Dystrophic Haplic Cambisol with maximum depth of 130 cm and a low water storage capacity, with the presence of stones and gravel. In order to monitor moisture levels, soil moisture sensors (tensiometers) were installed at 10 different points roughly 10 meters apart at two different depths, 50 and 100 cm. For the 0-20 cm soil layer, moisture was monitored by a portable TDR. Readings were taken roughly at 15-day intervals, between February and December 2008.
Water balance computed water inputs and exports within a unit volume of 1 m of depth, corresponding to the approximate depth of the soil. The following balance equation was applied:
2 i Dp 1 i Dp -ETr P
A (1)
where A is water storage variation (mm), P is throughfall (mm) as measured by 2 pluviometers installed inside the forest fragment, ETr is evapotranspiration of the vegetation cover (mm), while Dp(i+1) and Dp(i) correspond to deep percolation (mm) from two consecutive readings. For each soil moisture reading date, the average water storage in the soil profile was calculated as follows (MELLO et al. 2008):
(2) i At 1 i At
A (3)
where A(t)is water storage in the soil profile (mm), and ,
0-20 20 50 e 50 100 are average moisture contents (m3 m-3) in the 0-20 cm, 20-50 cm and 50-100 cm soil layers respectively. Water storage variation ( A) in the soil layer was given by:
0-20 20 50
At .200 .300 50 100 .500
34 PEREIRA, D. dos R. et al.
Figure 1 – Experimental area location (a – geographic location of Lavrinha Creek watershed and b – study site and meteorological station).
Figura 1 – Localização da área experimental (a – localização geográfica da bacia hidrográfica do Ribeirão Lavrinhas e b –
localização da área experimental).
meteorological station set up close to the study site (Figure 1b) to collect information every 30 minutes. To estimate evapotranspiration in the Atlantic Forest (equation 4), data were converted to average daily values for each interval of soil moisture monitoring.
Determination of deep percolation in interval (Dp(i)) was based on the drainable porosity of the layers being monitored, according to Mello et al. (2008):
where cc is average volumetric moisture (m3 m-3) corresponding to field capacity, estimated by the point of inflection of the characteristic curve, according to Mello et al. (2002) and Dexter (2004). Table 1 depicts physical characteristics of Cambisol, critical to assist analysis of deep percolation and soil water storage.
2 i Dp 1 i Dp -A P
ETr (4)
Water balance was simplified in terms of ignoring direct surface runoff. This was done by gathering soil and water loss data from a monitored plot inside the area roughly
0-20 i 20-50 i
Dpi mm cc .200 cc
50-100 i
35 Evapotranspiration and estimation of aerodynamic...
Table 1 – Hydrophysical characteristics of the soil in the study site.
Tabela 1 – Caracterização físico-hídrica do solo na área experimental.
Layer (cm) Sand* Silt* Clay*
CC** SAT** PMP** n m
0 – 50 440 245 315 0.469 0.581 0.231 1.264 1.321 0.234
50 – 100 490 240 270 0.456 0.557 0.223 1.306 1.291 0.217
* in g kg-1; ** in m3m-3; , n, m,
SAT and PMP ( r): parameters of the characteristic curve by the van Genucthen model.
10 meters away from the edge. After 2 years of monitoring, direct surface runoff is noted to account for only 0.8% of total throughfall, the maximum value being 1.2% only. Based on this information and on the 15-day monitoring interval, it was assumed that direct surface runoff did not have a decisive effect on the evapotranspiration pattern, although its importance is recognized in studies involving water balance. This procedure was adopted in other works exploring water balance in forested areas, especially areas of eucalyptus crops, including the work of Stape et al. (2004), who fitted the 3PG model to estimate biomass production, based on very simplified water balance modeling.
2.2 Estimation of stomatal conductance (gs) and aerodynamic conductance (ga) in a fragment of Atlantic Forest in Mantiqueira Range, MG
Estimation of gs and ga parameters was based on the Penman-Monteith equation, as described by Soares & Almeida (2001): .t c g a g 1 . .D a .Cp.g a .Rn . 1
E (6)
where E is vegetation evapotranspiration (mm day-1), is steepness of the vapor pressure curve (mbar ºC-1), Rn is average net canopy radiation (W m-2),
a is air density (kg m-3), is psychrometric constant (mbar ºC-1), Cp is specific heat of the air (J kg-1 ºC-1), D is vapor pressure deficit (mbar), ga is canopy aerodynamic conductance (m s-1), g
c is water vapor conductance (m s-1), is latent heat of water vaporization (J kg-1) and t is day luminosity (s day-1). Canopy vapor conductance can be given as a function of stomatal conductance and leaf area index:
.IAF s g c
g (7)
where IAF is leaf area index (m2 of leaf/m-2 of soil) and g s is stomatal conductance (m s-1). IAF was determined using a LAI2000 Plant Canopy Analyser - LICOR, following user’s manual recommendations.
Parameters gs and ga were obtained by the numerical method (iterative) of Newton-Raphson, taking ETr in equation 4 as a reference. During the monitoring period, a total of 13 data pieces were computed and applied to the estimation of parameters gs and ga. The Penman-Monteith model was then applied, analyzed for accuracy with estimation of evapotranspiration using ga and gs mean values, comparing them to the values obtained by water balance modeling, using 6 data pieces that were not included in the parameter estimation process.
3 RESULTS AND DISCUSSION
3.1 Water balance in a fragment of Atlantic Forest in Mantiqueira Range
Table 2 depicts water balance with relevant components over the monitoring period (08/Feb/08 to 13/Dec/08), in the fragment of Atlantic Forest in Mantiqueira Range, MG. It was noted that evapotranspiration accounted for 89% of total precipitation in the period while deep percolation accounted for 13.6%. Water storage variation was slightly negative throughout, showing an equilibrium between evapotranspiration and precipitation. Almeida & Soares (2003) also found an equilibrium between evapotranspiration and precipitation in Atlantic Forest vegetation within Espírito Santo state in years when the annual precipitation matched the local historical average (~1,350 mm).
36 PEREIRA, D. dos R. et al.
Table 2 – Water balance in the fragment of Atlantic Forest in Mantiqueira Range, from 08/Feb/08 to 13/Dec/08.
Tabela 2 – Balanço hídrico em área experimental de Mata Atlântica na Mantiqueira Range, no período de 08/02/08 a 13/12/08.
*Dp = Average deep percolation of two consecutive readings; ** Water storage variation; *** Evapotranspiration Date format: day/month/year
Period Precipitation (mm) Dp* (mm) A** (mm) ETr*** (mm)
8/2/08-23/2/08 90.4 29.9 -1.7 62.2
24/2/08-8/3/08 82.4 22.5 -10.5 70.4
9/3/08-20/3/08 129.2 19.6 5.9 103.7
21/3/08-5/4/08 111.0 21.8 -31.8 117.9
6/4/08-19/4/08 143.8 19.6 24.2 100.0
20/4/08-1/5/08 62.0 18.3 14.8 25.9
2/5/08-19/5/08 32.0 9.6 -27.5 47.3
20/5/08-14/6/08 17.0 1.5 -12.7 29.0
15/6/08-28/6/08 16.0 0.0 -9.6 24.8
29/6/08-12/7/08 0.0 0.0 -14.6 14.6
13/7/08-30/7/08 0.0 0.0 -60.5 60.5
31/7/08-14/8/08 80.0 0.0 35.9 42.1
15/8/08-28/8/08 3.5 0.0 -33.6 37.0
29/8/08-27/9/08 77.0 0.0 16.0 44.8
28/9/08-11/10/08 81.5 0.2 30.5 50.8
12/10/08-25/10/08 70.6 0.2 -3.5 73.8
26/10/08-10/11/08 118.6 2.7 22.7 92.2
11/11/08-29/11/08 149.1 5.5 9.1 133.5
30/11/08-13/12/08 49.2 7.2 2.9 39.2
Total 1,313.3 158.6 -15.0 1,169.8
concentrated rainfall contributed toward soil drenching and consequently to intensified deep percolation. Additionally, local soils are less than 1.5m in depth, constituting a relatively thin layer with material presenting little porosity (granite-gneiss), leading to water accumulation and reduced vertical movement and favoring water consumption by plants, which could be causing excess evapotranspiration given the favorable edaphic and climatic conditions.
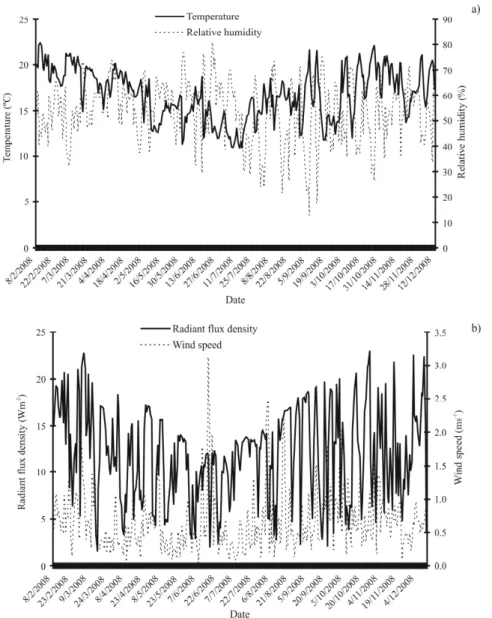
Another point is that, with decreasing rainfall, the evapotranspiration rate was also reduced. It was nonetheless higher than precipitation, a fact relating to plants using soil water reserves. In the driest month of the monitoring period (July), with no reported precipitation, the evapotranspiration rate fell to approximately 1.0 mm day-1. Here, lower temperatures as well as lower wind speed and radiant flux density (Figure 2) all conditioned a reduced
37 Evapotranspiration and estimation of aerodynamic...
Figure 2 – (a) Average daily temperature and average daily relative humidity, and (b) average daily wind speed and radiant flux density as observed at the meteorological station.
Figura 2 – Temperatura média diária e umidade relativa média diária (a), e velocidade média diária do vento e densidade de fluxo
radiante (b), observadas na estação climatológica.
vegetation, arguing that in the latter case roots could be absorbing water at greater soil depths.
3.2 Estimation of stomatal conductance (gs) and aerodynamic conductance (ga) in a fragment of Atlantic Forest in Mantiqueira Range, MG
Determined under field conditions and applied to canopy conductance estimation, the observed leaf area
38 PEREIRA, D. dos R. et al.
most significantly affecting evapotranspiration were net radiation and vapor pressure deficit (CARNEIRO et al. 2008).
It was noted that canopy aerodynamic conductance (ga) had little variation throughout, with a minimum value of 0.0921 m s-1 in the period 13/July/08 to 30/July/08, a maximum value of 0.1000 m s-1 in much of the monitoring period, and an average value of 0.0993 m s-1. According to Rennó (2003), Monteithsuggests a ga value of 0.1 m s-1 for very rugged vegetation, as is the case with forests. Soares & Almeida (2001) report little variation in ga value, possibly with little effect on daily transpiration.
On further analysis of Table 3 data, higher stomatal conductance values were observed between 09/Mar/08 and 19/Apr/08, at 0.0043 m s-1 on average, despite net radiation and vapor pressure deficit (D) values not being the highest then. A high concentration of rainfall, however, was observed in that period (Table 2), drenching the soil to maximum retention capacity (240 mm), this being a conditioning factor of intensified stomatal opening and consequently of higher evapotranspiration rates.
Table 3 – Daily average values of latent heat of vaporization ( ), net radiation (Rn), psychrometric constant ( ), vapor pressure deficit (D), canopy aerodynamic conductance (ga), stomatal conductance (gs), and ETr estimated by water balance over the monitoring period, in Mantiqueira Range, MG.
Tabela 3 – Valores médios diários para calor latente de vaporização ( ), radiação líquida (Rn), constante psicrométrica ( ), déficit
de pressão de vapor (D), condutância aerodinâmica do dossel (ga), condutância estomática (gs) e ETr estimada pelo balanço hídrico no período de monitoramento, nas condições da Serra da Mantiqueira, MG.
Period (J Kg-1) Rn (W m-2) (mbarºC-1) D (mbar) g
a (m s-1) gs (m s-1) ETr (mm day-1)
08/2/08-23/2/08 2453369 98.1 0.582 11.8 0.1000 0.0014 4.2
24/2/08-8/3/08 2454725 86.1 0.580 11.9 0.1000 0.0017 5.0
9/3/08-20/3/08 2455911 74.7 0.582 10.2 0.1000 0.0041 8.6
21/3/08-5/4/08 2458602 71.9 0.581 8.8 0.1000 0.0042 7.4
6/4/08-19/4/08 2457187 55.6 0.581 8.2 0.0990 0.0046 7.1
20/4/08-1/5/08 2460927 51.6 0.580 9.4 0.1000 0.0019 2.2
2/5/08-19/5/08 2466692 43.5 0.580 7.1 0.1000 0.0020 2.6
20/5/08-14/6/08 2465031 36.1 0.581 7.8 0.0999 0.0015 2.2
15/6/08-28/6/08 2467845 28.1 0.581 6.8 0.1000 0.0015 1.8
29/6/08-12/7/08 2471189 38.0 0.582 6.2 0.1000 0.0010 1.0
13/7/08-30/7/08 2468562 34.7 0.582 9.0 0.0921 0.0022 3.4
31/7/08-14/8/08 2463376 41.0 0.581 9.2 0.0996 0.0016 2.8
15/8/08-28/8/08 2462268 54.7 0.582 10.8 0.0998 0.0012 2.6
Average 2461976 54.9 0.581 9.0 0.0993 0.0022 3.9
The lowest stomatal conductance value was observed in the period 29/Jun/08 to 12/Jul/08, at 0.001 m s-1. Favorable conditions were noted then for that response from stomata, including lower radiation and vapor pressure deficit rates (Table 3). The average gs value was 0.0022 m s-1, the maximum value reaching 0.0046 m s-1. Mielke et al. (1999) obtained maximum gs values of 0.004 and 0.008 m s-1, both for Eucalyptus crops. Kelliher et al. (1995) reported maximum gs values of 0.0057 m s-1 for Coniferous Forest, 0.0046 m s-1 for Temperate Deciduous Forest, and 0.0061 m s-1 for Tropical Forest. Values obtained in this work are thus compatible with the relevant type of vegetation cover (Ombrophilous Forest) under edaphic and climatic conditions of Mantiqueira Range.
39 Evapotranspiration and estimation of aerodynamic...
Figure 3 – Comparison between evapotranspiration as estimated on the basis of average ga and gs values (ETr est) and evapotranspiration as estimated by water balance (ETr obs).
Figura 3 – Comparação entre a evapotranspiração estimada
em função dos valores médios de ga e gs (ETr est) e evapotranspiração estimada pelo balanço hídrico (ETr obs). moisture levels brought by excess rainfall, stomatal conductance was low during that period, at 0.0014 to 0.0017 ms-1, which demonstrates the weight of atmospheric conditions on stomatal response. Carneiro et al. (2008) also observed the influence of such conditions on eucalyptus crops, noting that, despite the irrigation and good water availability in the soil, the higher energy levels received under non-irrigated conditions was determinant in the transpiration process.
Figure 3 provides a comparison between ETr estimated by the Penman-Monteith model, applied based on average ga and gs values (Table 3), and ETr estimated by water balance.
Analysis shows that during the rainy period the model overestimated evapotranspiration by an average 2.0 mm day-1, especially between 08/Feb/08 and 09/Mar/08, underestimating it by 3.0 mm day-1 between 09/Mar/08 and 19/Apr/08. The latter situation is a result of abundant rainfall concentrated in the summer, causing the soil to reach maximum storage capacity at the end of that season. That way, a large part of the precipitation reaching the soil in the latter period converted directly into groundwater recharge, causing ETr to be overestimated by water balance modeling. Since water stored in aquifers resides in them for long periods, even in unconfined aquifers, in
comparison to the time interval of water balance, precise identification of that water portion is a highly complex procedure, it not being possible to correct the water balance. In the period 02/May/08 to 28/Aug/08, the slight overestimation by the model in relation to observed values was of minor magnitude, fitting well to observed values. A good performance was observed in the estimation of evapotranspiration by the Penman-Monteith model with parameters ga and gs when applied to data that was not used in their estimation process, therefore it is recommended for application in fragments of Atlantic Forest in Mantiqueira Range.
4 CONCLUSIONS
Evapotranspiration accounted for 89% of total precipitation, deep percolation accounted for 13.6%, and water storage variation was slightly negative over the monitoring period. Canopy aerodynamic conductance (ga) varied little throughout and exerted minor influence on evapotranspiration in the fragment of Atlantic Forest in Mantiqueira Range region, with an average value of 0.0993 m s-1. Climatic conditions and soil water storage variation were found to have strong influence on stomatal conductance (gs) values, with stomata exerting effective control over water loss to the atmosphere. Its average value was 0.0022 m s-1, providing overall good results in ETr estimation based on the Penman-Monteith model, with potential application in hydrologic studies involving fragments of Atlantic Forest in Mantiqueira Range.
5 BIBLIOGRAPHICAL REFERENCES ALMEIDA, A. C.; SOARES, J. V. Comparação entre uso de água em plantações de Eucalyptus grandis e Floresta Ombrofila Densa (Mata Atlântica) na costa leste do Brasil. Revista Árvore, Viçosa, v. 27, p. 159-170, 2003.
ALMEIDA, A. C.; SOARES, J. V.; LANDSBERG, J. J.; REZENDE, G. D. Growth and water balance of Eucaliptus grandis plantations in Brazil during a rotation for pulp production. Forest Ecology and Management, Amsterdam, v. 251, p. 10-21, 2007.
40 PEREIRA, D. dos R. et al.
DEXTER, A. R. Soil physical quality part I: theory, effects of soil texture, density, and organic matter, and effects on root growth.
Geoderma, Oxford, v. 120, p. 201-214, 2004.
HONZÁK, M.; LUCAS, R. M.; AMARAL, I.; CURRAN, P. J.; FOODY, G. M.; AMARAL, S. Estimation of the leaf area index and total biomass of tropical regenerating forest: comparison of methodologies. In: GASH, J. H. C. (Ed.).
Amazonian deforestation and climate. Chichester: J. Wiley, 1996. p. 365-381.
KELLIHER, F. M.; LEUNING, R.; RAUPACH, M. R.; SCHULZE, E. D. Maximum conductances for evaporation from global vegetation types. Agricultural and Forest Meteorology,
Amsterdam, v. 73, p. 1-16, 1995.
MELLO, C. R. de; OLIVEIRA, G. C.; FERREIRA, D. F.; LIMA, J. M. Predição da porosidade drenável e da disponibilidade total de água para Cambissolos da Região Campos das Vertentes.
Pesquisa Agropecuária Brasileira, Brasília, v. 37, p. 1319-1324, 2002.
MELLO, C. R. de; VIOLA, M. R.; NORTON, L. D.; SILVA, A. M.; WEIMAR, F. A. Development and application of a simple hydrologic model simulation for a Brazilian headwater basin.
Catena, Amsterdam, v. 75, p. 235-247, 2008.
MENEZES, M. D. Levantamento de solos em sub-bacias hidrográficas como apoio para avaliação do uso da terra e da potencialidade de recarga de aqüíferos. 2007. 107 p. Dissertação (Mestrado em Ciência do Solo) - Universidade Federal de Lavras, Lavras, 2007.
MIELKE, M. S.; OLIVA, M. A.; BARROS, N. F.; PENCHEL, R. M.; MARTINEZ, C. A.; ALMEIDA, A. C. Stomatal control of transpiration in the canopy of a clonal Eucalyptus grandis plantation. Trees, Berlin, v. 13, p. 152-160, 1999.
RENNÓ, C. D. Construção de um sistema de análise e simulação hidrológica: aplicação a bacias hidrográficas. 2003. 158 p Tese (Doutorado em Sensoriamento Remoto) - Instituto Nacional de Pesquisas Espaciais, São José dos Campos, 2003.
ROBERTS, J. M.; CABRAL, O. M. R.; FISH, G.; MOLION, L. C. B.; MOORE, C. J.; SHUTTLEWORTH, W. J. Transpiration from and Amazonian rainforest calculated from stomatal conductances measurements. Agricultural and Forest Meteorology, Amsterdam, v. 65, p. 175-196, 1993.
SCOLFORO, J. R. S.; MELLO, J. M.; SILVA, C. P. Inventário florestal de Minas Gerais: floresta estacional semidecidual e ombrófila: florística, estrutura, diversidade, similaridade, distribuição diamétrica e de altura, volumetria, tendências de crescimento e áreas aptas para manejo florestal. Lavras: UFLA, 2008. 1029 p.
SOARES, J. V.; ALMEIDA, A. C. Modeling the water balance and soil water fluxes in a fast growing Eucaliptus plantation in Brazil.
Journal of Hydrology, Amsterdam, v. 253, p. 130-147, 2001.
STAPE, J. L.; RYAN, M. G.; BINKLEY, D. Testing the utility of the 3-PG model for growth of Eucalyptus grandis x urophylla with natural and manipulated supplies of water and nutrients.