Crop Breeding and Applied Biotechnology 10: 183-190, 2010 Brazilian Society of Plant Breeding. Printed in Brazil
Received 9 January 2009
Accepted 14 November 2009
Heterosis performance in industrial and yield
Heterosis performance in industrial and yield
Heterosis performance in industrial and yield
Heterosis performance in industrial and yield
Heterosis performance in industrial and yield
components of sweet corn
components of sweet corn
components of sweet corn
components of sweet corn
components of sweet corn
Aracelle Assunção1*, Edward Madureira Brasil1, Jaison Pereira de Oliveira2, Américo José dos Santos Reis1, André Ferreira Pereira 3, Luíce Gomes Bueno1, and Michelle Ribeiro Ramos4
ABSTRACT - Heterosis and its components were evaluated in a diallel crossing system of sweet corn. In the 38 treatments, eigth parents, 28 hybrids and two controls were used, arranged in a randomized block design with three replications.The diallel analysis followed the methodology of Gardner and Eberhart (1966). The following traits were evaluated: male and female flowering, plant and ear height, ear index (number of ears/number of plants), ºBrix, total ear weight, standard ear weight, industrial yield and total sugar content. There was genetic variability among genotypes, with significant differences except for the traits ear index, industrial yield and ºBrix.Heterosis was found for most traits. The mean heterosis of hybrids compared with the parents was positive for most traits. There was a contribution of additive and dominance effects.The contribution of dominant genes was greatest to flowering, plant and ear height and standard ear weight.
Key words: sweet corn, industrial yield, combining ability, heterosis.
INTRODUCTION
Sweet corn differs from field corn because it contains genes that modify the flavor, tenderness, texture, seed viability, and appearance of plants and ears (Tracy 1994). The world’s area used for corn comprises 900 hectares, and in Brazil, 36 thousand hectares (Barbieri et al. 2005). About 66% of the production is in Goiás where yields reach 14 t ha-1 and the industrial yield is 33%, which
may however vary according to the level of technology, seasons and requirements of each industry.
The sweet corn produced in Brazil is destined for industrial processing (Barbieri et al. 2005). The short supply of varieties on the market and lack of knowledge among consumers have resulted in a low demand for sweet
corn. This crop can potentially increase, since sweet corn is traditionally produced and consumed corn in Brazil, which can facilitate the introduction of other forms of sweet corn consumption.
Due to the growing demand for sweet corn and the requirements of producers, industry and consumers, studies for more information about this crop are needed to select and identify genes that confer relevant agronomic and industrial traits for genetic breeding programs and the consumer market. A technique that helps choose the best parents based on their performance, for selection of promising hybrids, is the diallel mating system (Ramalho et al. 1993). Diallel crosses provide information on the type of predominant gene action, assess the heterotic potential and general and specific combining ability of genotypes
ARTICLE
ARTICLE
ARTICLE
ARTICLE
ARTICLE
1 Universidade Federal de Goiás, Escola de Agronomia e Engenharia de Alimentos, 74.001-970, Goiânia, GO, Brazil. *E-mail: [email protected].
2 Embrapa Arroz e Feijão, 75.375-000, Santo Antônio de Goiás, GO, Brazil.
3 Instituto Federal de Educação Ciência e Tecnologia de Brasília, Campus Planaltina, 73.380-900, Brasília, DF, Brazil.
(Hallauer and Miranda Filho 1981). Information obtained by diallel crossings are widely used in corn breeding programs.
Some studies with sweet corn in diallel crosses have been conducted. For the trait commercial yield of ears it was observed that the non-additive genetic effects exceeded the additive (Scapim et al., 1995). Other results show significance for general and specific combining ability for ear weight without straw, indicating the existence of variability for both additive and non-additive genetic effects. If the non-additive genetic effects prevail, there is a greater potential for exploitation of heterosis, and if additive effects are predominant, the success for improvement will be greater with the formation of synthetics (Teixeira et al. 2001).
The aim of this study was to evaluate eight sweet corn populations from crosses, and investigate the performance per se and of heterosis in industrial and yield components based on hybrid combinations.
MATERIAL AND METHODS
A field diallel was conducted on the experimental area of the Escola de Agronomia e Engenharia de Alimentos, of the Universidade Federal de Goiás, with the following eight commercial sweet corn hybrids as parents: SWB-551 (Dow Agroscience), DO-04 (Dow Agroscience), Tropical (Syngenta), AF-427 (Sakata Seeds), AF-428 (Sakata Seeds), AF-429 (Sakata Seeds), HS1-2004 (Embrapa), and HS2-2104 (Embrapa). Ten crosses between eight hybrids were performed, taken in pairs, disregarding the reciprocals, with 10 crosses per hybrid, to ensure the multiplication of the parental populations.
The experiment was installed in June 2005, in the above experimental area, in a randomized block design with three replications, with a total of 38 treatments: eight parents (F2 of crosses of each genotype), 28 generations F1
(hybrids derived from crosses between all genotypes, taken two by two), and two commercial hybrids as controls (DO-04 and DAS-451). Each plot consisted of one 5-m row, with 0.75m between-row and 0.25m between-plant spacing. Three to four seeds per hole were sown at a depth of 3-4 cm. The plants were thinned to one seedling per hole 25-30 days after planting.
The following traits were evaluated: male flowering (MF), female flowering (FF), plant height (PH), ear height (first ear) (EH), ºBrix (soluble solids) by a refractometer (RT30ATC 032°Brix), sugar (total sugar content)
-determined in a laboratory according to the Lane-Eynon method; ear index (EI): total number of ears per plot divided by the number of plants per plot; total ear weight (TEW), standard ear weight (SEW): total weight of ears disregarding outliers; and industrial yield (Iy): the proportion of grains in relation to standard ear weight. The grain moisture content was corrected to 76%, which is considered ideal to harvest sweet corn.
For the analysis of variance the statistical program (SAS Institute 1997) was used. The means adjusted by least squares obtained by variance analysis were evaluated by the genetic model of diallel analysis proposed by Gardner and Eberhart (1966), using the GENES program (Cruz 1997). The general model is as follows: Yij = µ + (υi+υj)/2 + θ (h + hi + hj + sij) + εij; where: Yij: value observed for the parent i or cross between i and j; overall mean of varieties; υi: effect of the ith variety; υ
j: effect of the j-th variety; h: effect of mean heterosis of all crosses,
hi and hj: heterosis of the parents i and j, compared to h, respectively; sij: effect of specific heterosis resulting from crosses between parents of the order i and j; εij: mean experimental error associated to the hybrid or parental means; θ: conditional coefficient, with values of θ = 0, where i = j and θ = 1 when i = j. The general combining ability of the parents (gi) was also estimated by: gi = ½ (υii+ hi).
RESULTS AND DISCUSSION
The mean of male flowering (MF) was 83.47 days after planting (DAP), and female flowering (FF) 86.28 DAP (Table 1). These values are higher than those found for sweet corn, but since the experiment was planted in June, with lower mean temperature, the growing cycle lasted longer. For sweet corn in this growing season, harvested 90 to 100 DAP, it is best to use cultivars of earlier cycles, mainly for irrigated crops, to reduce the time the crop stands in the field.
The values of mean heterosis (h) were -3.23 DAP (FF) and -2.95 DAP (MF) (Table 2). Significance indicates variability between the heterotic responses of the crosses. At least a few of the crosses differed from the hybrid mean. According to Vencovsky and Barriga (1973), based on this significance dominance was inferred and sufficient divergence of gene frequencies between genotypes in at least part of the loci with dominance. The negative h value indicated bidirectional dominance, with the occurrence of positive and negative heterosis. Since the mean of the crossings was lower than the mean of the parents, the situation is favorable for selection, since a reduction of the crop cycle is a breeding target. The means in F1 were
by 3.43% (MF) and 3.62% (FF) lower than for the parents (Table 3).
The effects of variety heterosis (hi) ranged from -2.68 to DAP genotype AF-428 DAP to 1.32 for genotype DO-04 (FF), DAP and -1.88 for genotype AF-428 DAP to
1.56 for genotype HS2-2104 (MF) (Table 2). Gama et al. (1995) found significance for vi and total heterosis for MF in a diallel of 15 early common maize populations. In this case, hi ranged from -0.61 to 3.47 DAP. When hi is significant, not only additive effects (variety) should be considered, so the best genotypes are those with highest negative general combining ability, tending to reduce the cycle, which were: HS1-2004, Tropical and SWB-551, for MF and FF. Cruz et al. (2004) claimed that low estimates of positive or negative gi indicate genotypes with combinations that do not differ much from the overall mean of the crosses in the diallel system, indicating the importance of genes with predominantly additive effect. Working with maize populations in Hardy-Table 1. Summary of the analysis of variance of the diallel for the
traits male flowering (MF, in days after planting - DAP), female flowering (FF, in DAP), ear index (IE), plant height (PH, in cm) and ear height (EH, in cm), according to the methodology of Gardner and Eberhart (1966)
*,** Significantly superior to the error mean square by the F test, at 5% and 1% probability respectively.
Table 2. Estimates of the mean (μ), of the variety effect (υi), mean heterosis (h), variety heterosis (hi), genotypic effect (gi) and specific
* Pop = populations; ** 1 = SWB-551; 2 = DO-04; 3 = Tropical; 4 = AF-427; 5 = AF-428; 6 = AF-429; 7 = HS1-2004; 8 = HS2-2104; *** Sij=values
of specific heterosis in the lower half of the table refer to variable MF, and values in the upper half to FF.
Table 3. Means of the parents (G), hybrid means (H) and magnitude of heterosis expressed in % (h) for the traits male flowering (MF, in DAP), female flowering (FF, in DAP), plant height (PH, in cm), ear height (EH, in cm), ear index (IE), soluble solids content (ºBrix), total sugar content (sugar, in %), total ear weight (TEW, in kg ha-1), standard
ear weight (SEW, in kg ha-1), and industrial yield (Iy, in %)
Weinberg, Vencovsky and Barriga (1973) inferred that more negative hi values indicate lower diversity than in the set. Positive values would indicate positive deviations of allele frequency. The statement of Vencovsky and Barriga (1973) is therefore based on positive dominance.
In terms of specific heterosis (sij), the genotypes complement each other with respect to allele frequencies in dominant loci, differing in expected flowering, based on the mean parental performance. According to Cruz et al. (2004), the sij effects estimated as deviations from the performance compared to the general combining ability-based expectation, are measures of non-additive effects. Hybrid combinations with favorable sij estimates are desirable, involving at least one parent with a most favorable gi effect. In this case, the crosses AF-428 x 2004-HS1 and SWB-551 x AF-428 are noteworthy for FF and MF (Table 2).
For ear index (IE) (number of ears/number of plants), the mean was 1.16 (Table 1), which indicates the degree of prolificacy of genotypes. In a study of agronomical and nutritional traits of sweet corn genotypes, Pereira et al. (2009) found a mean IE of 1.38. According to the results obtained here, the IE of some genotypes was close to 1.00, which is satisfactory when the goal is the best possible quality of the first ear. The only source of variation with significance for IE was h (0.158) (Table 1), indicating variability of the heterotic responses of crosses, compared to the hybrid mean (Table 4), and the same magnitude of this heterosis for all crosses. The superiority of hybrids over the parents was15.27% (Tablea3).
The mean plant height (PH) was 168.62 cm (Tableo1). This aspect is important in view of the growing interest for shorter genotypes. For ear height (EH), the mean was 88.87 cm (Table 1). Pereira et al. (2009) found means of 168.33 cm for PH and 79.36 cm for EH, in sweet corn. The analysis of variance showed significant differences between treatments. There was significance for all hi effects but for EH.
The three genotypes of the company Sakata Seeds (AF-427, AF-428 and AF-429) contributed to reduce PA and EH. The lowest effect (or most negative effect) was found in AF-428 (-31.59 cm ) for PH and -16.67 cm for EH (Table 5). The h values were positive for both variables (18.05 cm for PH and 13.11 cm for EH), indicating predominance of dominant gene effects, which contributed to increase h positively, tending to increase the trait values, because in the mean, the values of the hybrids exceeded the parents (11.69% for PH and 16.63% for EH) (Table 3).
For hi of the trait PH (Table 5), the most negative effects were found for genotype DO-04 (-8.33 cm) and Tropical (-8.02 cm), indicating that crosses with these genotypes result in a lower mean PH. The estimates of gi were most favorable for the genotypes AF-429 (-7.20 cm) and AF-427 (-4.88 cm), contributing with additive effects to reduce PH in crosses. The lowest sij estimates for PH were observed for the parents with lowest vi estimates, namely: AF-427 x AF-428 (-22.65 cm), HS1-2004 x HS2-2104 (-17.90 cm), and AF-427 x AF-429 (-15.50 cm), which also had lower estimates of this effect for EH (Table 5). For the cycle and plant height negative estimates of the components under study are desirable, which contribute to reduce PH and EH from the practical point of view.
For the soluble solids content (ºBrix), the higher the value, the higher is the yield in grain processing (Pereira 1987). This author found values of 17.70%, 20.80% and 22.30% for three sweet corn cultivars. Pinho et al. (2008) found values of 15.83% and 14.5% in two other sweet corn cultivars. The mean found in this study was 15.26%. There was no significant difference between treatments, except with regard to the effect of varieties (υi), (Table 6). According to Miranda Filho and Chaves (1991), the best parents should be selected based on their participation in the positive values of υi and hi, contributing to the mean values of each cross they are involved in. The general combining ability values of theses parents should also be the highest, which are important for the selection of populations for the formation of compounds Table 4. Estimates of the mean (µ), effects of variety (υi), mean
heterosis (h), heterosis of variety (hi) and genotypic effect (gi) for the traits soluble solids content (°Brix), total sugar content (Sugar, in %), ear index and total ear weight (TEW, in kg ha-1)
in a recurrent selection program, or for the improvement of populations per se. The highest ºBrix values for the performance per se (υi) were observed for the genotypes AF-429 (1.23 °Brix) and DO-04 (1.33 °Brix) (Table 4).
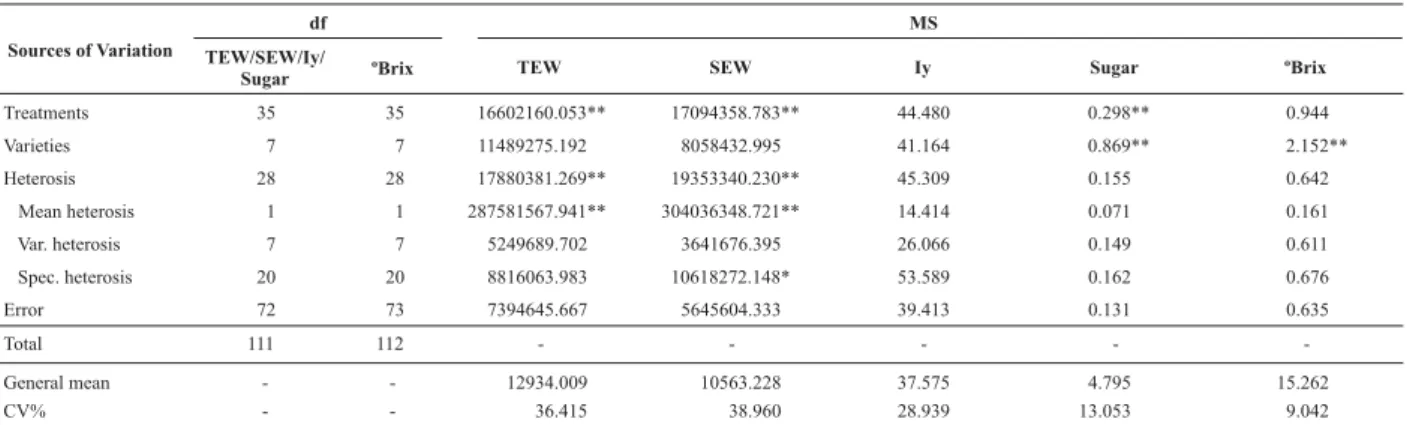
For total ear weight (TEW), which indicates the productivity, the mean was 12934.009 kg ha-1
(Tableo6). Pereira et al. (2009) found the value of 11136.510okg ha-1 for this same variable in sweet
corn. There were significant differences between treatments, total heterosis and h, indicating the presence of heterosis. The mean expression, however, was the same for all populations, ie, the mean TEW was the same in all F1s, or any possible difference between these responses
was undetectable, due to the non-significance of hi and
sij. The reason may be that the genotypes did not differ in their gene frequencies and means and that the gene frequency dispersion was the same, randomly distributed among populations in the different loci. The h contributed positively to TEW, with a parent yield of approximately 6798.416 kg ha-1 (Table 4), indicating that the mean yield
of F1 was higher, corresponding to 88.91% of the parental
mean (Table 3). Lemos et al. (2002) worked with sweet corn lines and their hybrids, and found heterosis values in the crosses for TEW, which ranged from -26.43% to 117.51% of the parental mean.
The mean standard ear weight (SEW) was 10563.228okg ha-1 (Table 6). There are significant
differences between treatments, allowing the selection of Table 5. Estimates of the mean (μ), the variety effects (vi), mean heterosis (h),variety heterosis (hi), genotypic effect (gi) and specific heterosis (sij) for the traits ear height (EH, in cm) and plant height (PH, in cm)
* Pop = populations; ** 1 = SWB-551; 2 = DO-04; 3 = Tropical; 4 = AF-427; 5 = AF-428; 6 = AF-429; 7 = HS1-2004; 8 = HS2-2104; *** Sij=values
of specific heterosis in the lower half of the table refer to the variable EH, and values in the upper half to PH.
Table 6. Summary of the analysis of variance of the diallel for the traits total ear weight (TEW, in kg ha-1), standard ear weight (SEW,
in kg ha-1), industrial yield (Iy, in %), total sugar content (Sugar, in %) and soluble solids content (°Brix), according to a methodology
proposed by Gardner and Eberhart (1966)
superior genotypes. Significance was observed for total heterosis, h and sij. Dominant gene effects prevailed for SEW, with a considerable contribution of heterosis to the trait expression; the selection of parents with highest SEW indicates the best combinations between them, based on sij. Once h and sij were significant, there is heterosis, with differentiated responses that suggest the existence of complementary hybrid combinations due to the dominance effects.
The positive contribution of h (6990.206 kg ha-1) to
SEW (Table 7) indicated that in the mean, the F1 generation produced 6990.206 kg ha-1 more than the parents, which is
equivalent to 136.36% of the parental mean (Table 3). Even in cases where the magnitude is low, can be exploited in hybrid combinations. In this case, the superiority of the hybrid response is evident, which is relevant, since yield is one of the main variables in a breeding program. The contributions with greatest number of alleles to increase the SEW for sij were found in the crosses AF-428 x HS1-2004 (4568.14 kg ha-1), SWB-551 x AF-429 (4410.77 kg ha-1),
DO-04 x Tropical (3757.01 kg ha-1) and AF-427 x HS2-2104
(3058.30 kg ha-1) (Table 7). This indicates greater
divergence among the parents than compared to other combinations. Bordallo et al. (2005) assessed the total ear weight without straw and found significant specific and general combining ability, showing the variability for both additive and non-additive genetic effects. For the genotypes DO-04 and Tropical the values for υi, hi and gi were simultaneously positive (Table 7), and their higher gi (general combining ability) estimates were favorable since they contribute with additive genes to higher yields.
The mean industrial yield (Iy) was 37.57%. This indicates that the means of the genotypes meet industrial requirements, with an Iy of >30% (Pereira Filho et al. 2003). Pinho et al. (2008) obtained values of 29% and 38.95% for Iy in two sweet corn cultivars and Pereira et al. (2009) observed a mean Iy of 31.03% in several sweet corn genotypes. For this variable, as well as for ºBrix, no significant difference was observed for any of the sources of variation (Table 6).
The mean total sugar content was 4.79% (Table 6), as a wet analysis of grains showed. Pereira (1987) found total sugar contents of 4.30%, 4.60% and 5.20% for the cultivars Doce Cristal, Doce-de-Ouro and Superdoce, respectively. This trait is important, since genotypes with higher sugar levels in the grain are preferable for industrial purposes. There were significant differences for treatments and υi, indicating the possibility of selecting superior genotypes for this trait, and that the performance of F1
plants was similar to that of their parents for total sugar content in the grain, suggesting a low dominance degree in the genetic control of this trait, with predominantly additive effects. The best performance per se was observed for the genotypes DO-04 (0.41%), SWB-551 (0.37%), Tropical (0.34%), and AF-429 (0.30%) (Table 4), as indicated by the highest positive υi values.
For total sugar content in grain the hybrid performance was 2.27% higher than of the parents (Tableo3). The positive h values showed that the hybrids performed better for all variables (Table 3). Genetic variability was observed in the genotypes and hybrids for most traits under study as well as heterosis for most traits, which was particularly high for yield.
Table 7. Estimates of the mean (µ), of the effect of variety (υi), mean heterosis (h), variety heterosis (hi), genotypic effect (gi) and specific heterosis (sij) for the trait standard ear weight (SEW, in kg ha-1)
* Pop = populations; ** 1 = SWB-551; 2 = DO-04; 3 = Tropical; 4 = AF-427; 5 = AF-428; 6 = AF-429; 7 = HS1-2004; 8 = HS2-2104; *** Sij =
ACKNOWLEDGEMENTS
The authors thank the Escola de Agronomia e Engenharia de Alimentos, the Universidade Federal de Goiás (UFG) and the Conselho Nacional de Desenvolvi-mento Científico e Tecnológico (CNPq) for granting a scholarship.
Comportamento da heterose em componentes
Comportamento da heterose em componentes
Comportamento da heterose em componentes
Comportamento da heterose em componentes
Comportamento da heterose em componentes
industriais e da produção para o milho doce
industriais e da produção para o milho doce
industriais e da produção para o milho doce
industriais e da produção para o milho doce
industriais e da produção para o milho doce
RESUMO- Foi avaliada a heterose e seus componentes através de cruzamentos dialélicos em milho doce utilizando 38 tratamentos: oito parentais, 28 híbridos e duas testemunhas. O delineamento experimental foi o de blocos casualizados com três repetições e a análise dialélica seguiu a metodologia de Gardner and Eberhart (1966). Foi avaliado o florescimento masculino e feminino, altura de plantas e espigas, índice de espigas (número de espigas/número de plantas), ºBrix, peso de espigas total, peso de espigas padrão, rendimento industrial e teor de açúcar total. Houve variabilidade genética entre os genótipos, com diferença significativa para vários caracteres, exceto índice de espigas, rendimento industrial e ºBrix. Há heterose para grande parte dos caracteres avaliados. A heterose média dos híbridos com relação aos genitores foi positiva para a maioria dos caracteres. Houve contribuição de efeito aditivo e de dominância, sendo a maior contribuição dos genes de dominância para florescimento, altura de plantas e espigas e peso de espigas padrão.
Palavras-chave: milho doce, rendimento industrial, capacidade de combinação, heterose.
REFERENCES
Barbieri VHB, Luz JMQ, Brito CH, Duarte JM, Gomes LS and Santana DG (2005) Produtividade e rendimento industrial de híbridos de milho doce em função de espaçamento e populações de plantas. Horticultura Brasileira 23: 826-830.
Bordallo PN, Pereira MG, Amaral Júnior AT and Gabriel APC (2005) Análise dialélica de genótipos de milho doce e comum para caracteres agronômicos e proteína total. Horticultura Brasileira 23: 123-127.
Cruz CD (1997) Programa Genes: aplicativo computacional em genética e estatística. Editora UFV, Viçosa, 394p.
Cruz CD, Regazzi AJ and Carneiro PCS (2004) Modelos biométricos aplicados ao melhoramento genético. Vol. I, UFV, Viçosa, 480p.
Gama EEG, Hallauer AR, Lopes MA Parentoni S, Santos MX and Guimarães PEO (1995) Combining ability among fifteen early cycle maize populations in Brazil. Brazilian Journal of Genetics 18: 569-577.
Gardner CO and Eberhart SA (1966) Analysis and interpretation of the variety cross diallel and related population. Biometrics 22: 439-452.
Hallauer AR and Miranda Filho JB (1981) Quantitative genetics in maize breeding. Iowa State University Press, Ames, 468p.
Lemos MA, Gama EEG, Menezes D, Santos VF and Tabosa JN (2002) Avaliação de dez linhagens e seus híbridos de milho superdoce em um dialelo completo. Horticultura Brasileira 20: 167-170.
Miranda Filho JB and Chaves LJ (1991) Procedures for selecting composites based on prediction methods. Theoretical and Applied Genetics 81: 265-271.
Pereira AF, Melo PGS, Pereira JM, Assunção A, Nascimento AR and Ximenes PA (2009) Caracteres agronômicos e nutricionais de genótipos de milho doce. Bioscience Journal 25: 104-112.
Pereira AS (1987) Composição, avaliação organoléptica e padrão de qualidade de cultivares de milho-doce. Horticultura Brasileira 5: 22-24.
Pereira Filho IA, Cruz JC and Gama EEG (2003) Cultivares para o consumo verde. In Pereira Filho IA (ed.) (2003) O cultivo do milho-verde. Embrapa Informações Tecnológicas, Brasília, p. 17-30.
Ramalho MAP, Santos JB and Zimmermann MJ (1993) Genética quantitativa em plantas autógamas. Editora UFG, Goiânia, 271p.
SAS Institute (1997) SAS/STAT software: changes and enhancements through release 6.12. Statistical Analysis System Institute, Cary. 1167p.
Scapim CA, Cruz CD and Araújo JM (1995) Cruzamentos dialélicos entre sete cultivares de milho-doce. Horticultura Brasileira 13: 19-21.
Teixeira FF, Souza IRP, Gama EEG, Pacheco CAP, Parentoni SN, Santos MX and Meirelles WF (2001) Avaliação da capacidade de combinação entre linhagens de milho doce. Ciência Agrotécnica 25: 483-488.
Tracy WF (1994) Sweet corn. In Hallauer AR (ed.) Specialty corns. Department of Agronomy, Iowa State University, Iowa, p. 147-187.