M
ASTERS
F
INANCE
M
ASTERS
T
HESIS
DISSERTATION
SITUATIONAL DETERMINANTS OF THE SURVIVABILITY
OF PORTUGUESE SMES
GONÇALO BRUNO CASSOLA DE ALMEIDA GONÇALVES
M
ASTERS
F
INANCE
M
ASTER
T
HESIS
DISSERTATION
SITUATIONAL DETERMINANTS OF THE SURVIVABILITY
OF
P
ORTUGUESE
SME
S
GONÇALO BRUNO CASSOLA DE ALMEIDA GONÇALVES
S
UPERVISOR:
PROFESSORA MARIA JOÃO COELHO GUEDES
manufacturing Small and Medium Enterprises that were created between 2009 and 2011
and followed until 2013. A Cox regression was used on panel data to determine the
impact of social determinants in failure. The effects of variables such as size and
performance on the Failure dependent variable were also studied. The empirical results
showed that both Slack and Attainment Discrepancy (when the firm’s performance is
above aspirations), have a negative and significant relationship with the likelihood of
failure of a new venture.
Keywords: Survivability, New Ventures, Portuguese Manufacturing SMEs, Social
of this dissertation.
I am also thankful to professor Maria João Guedes for all the knowledge and guidance
provided throughout the path to complete this dissertation even in the moments when all
seemed impossible to achieve.
I also want to thank to professor Nuno Crespo for the constructive critics and ideas that
Abstract ... ii
Acknowledgments ... iv
Table of Contents ... v
List of Tables ... vi
Abbreviations ... vii
1 - Introduction ... 1
2 - Literature Review ... 3
2.1 – Survivability ... 3
2.2 – Situational Determinants... 3
2.2.1 – Slack ... 4
2.2.2 – Aspirations ... 4
2.2.3 - Size ... 8
3 – Data description and Methodology ... 9
3.1 – Sample ... 9
3.2 – Definition of Variables ... 10
3.2.1 – Dependent Variables ... 11
3.2.2 – Independent Variables... 11
3.2.3 – Control Variables ... 12
3.3 – Methodology ... 13
3.3.1 – Model ... 14
4 – Analysis and Discussion of Empirical Results ... 15
4.1 – Descriptive Statistics and Correlations ... 15
4.2 – Results ... 20
5 - Conclusions ... 23
5.1 – Final Considerations ... 23
5.2 –Limitations and Further Research ... 23
Table II– Variables Description
Table III– Descriptive Statistics of variables for Portuguese SMEs
Table IV– Correlations of variables for Portuguese SMEs
Table V–Results of the Cox’s Proportional Hazards Model
IES– Informação Empresarial Simplificada
R&D– Research and Development
ROA– Return on Assets
1 - Introduction
One of the basic goals of firms is to survive, and for this an organisation needs to have
the will to improve and to innovate (Backaitis & Rosen, 1990).
Several factors can affect the propensity for a firm to fail. The study of situational
determinants, such as Aspirations and Slack on new ventures has not received the
importance that they deserve by scholars over the last few years. Chen and Miller
(2007) studied the effect of situational determinants in research and development
(R&D), providing evidence of its effects on the search behaviours of firms. These
search behaviours, and also those situational determinants that affect it, can also have an
effect on the survivability of firms.
This dissertation examines the situational determinants and factors that affect the
propensity of a new venture to fail.
The situational determinants include Slack and Failure for attaining aspirations (Cyert &
March, 1963). Cyert and March show organisations as being goal-directed systems
which respond to performance feedback by using simple decision rules to change their
activities (Chen & Miller, 2007). Inspired by Chen and Miller (2007) and also March
and Shapira (1992), this dissertation considers the effects of the change of the focus of
the attention of managers when firms face bankruptcy, or for different levels of slack
resources.
Several control variables were also added to enable a better understanding of the results
and to ensure for better accuracy.
“SMEs are the life-blood of modern economies” (Antony et al, 2005, p.861).
Portuguese SMEs have a great impact on the Portuguese economy. In 2010, Portuguese
SMEs represented 60.9% of the total volume of Portuguese business (INE, 2010).
Manufacturing firms transform raw materials into consumer goods or into machinery.
The manufacturing sector represented 23% of the Portuguese economy in 2011 (Grupo
Marktest, 2011). New ventures represented 12.3% of the total number of companies
existing in Portugal in 2011, and they also have a big impact on the Portuguese
economy (INE, 2011). In 2008, the word Entrepreneurship started to become popular.
The intention of people to innovate and create something different and practical was a
way of facing the crisis and of fighting unemployment. Moreover, the entrepreneur is
seen as a pillar of change, being the one that induces social and economic
transformations.
The empirical evidence of this dissertation finds situational determinants to be
statistically significant, and that they have an impact on the Failure dependent variable.
Furthermore, the results are not consistent with the interpretation that a change of focus
of attention is relevant for the survivability of firms, depending on their proximity to
bankruptcy and slack.
The structure of the dissertation is divided into five chapters, starting with the
introduction. The literature review is contained in the second chapter, where it presents
the definition of survivability and situational determinants, as well as the proposed
study Hypotheses. The third chapter is comprised of the description of both the data and
the methodology and definition of the variables. The results achieved are analysed in the
fourth chapter, and the fifth and last chapter contains the conclusion, criticisms and
2 - Literature Review
2.1 – Survivability
Firms’ survival has been studied traditionally through the economics-based research of
industry business cycles and by analysing industries in decline (Suarez & Utterback,
1995).
There are numerous reasons for why a business fails. Business failure can occur when
the decline of revenues or the increase of expenses are of such a magnitude that they
make a firm insolvent, which is then unable to attract new debt or other kinds of
funding. Thus, as such, the firm cannot continue to exist under its current ownership or
management (Shepherd, 2003), although its survival can depend on unmeasurable
activities that are taken to accomplish long-term results (Backaitis & Rosen, 1990). In
the long-term, survival is a prerequisite for the success of a firm, representing market
share and profitability (Suarez & Utterback, 1995).
Several determinants explain firms’ survival. Aspirations and Slack have been shown to
be very relevant for firms’ survivability. Another important factor is the experience that
initial managers bring with them from other firms in the same industry, as the survival
and success of new organisations are shaped by the pre-entry experiences of their
founders (Dahl & Reichstein, 2007). Furthermore, firms’ strategies, market conditions
and macroeconomic conditions have all proved to be important determinants for
survival (Geroski et al, 2010).
2.2 – Situational Determinants
Chen and Miller (2007) claim that situational determinants include two factors: Slack
2.2.1 – Slack
According to Stan et al (2014, p.475), “organisational slack represents a cushion of
excess resources which organisations may use in a discretionary manner”. Similarly,
Nohria & Gulati (1996, p.1246) define slack as being “the pool of resources in an
organisation that in excess is the minimum necessary to produce a given level of
organisational output”.
Slack can be part of different roles in organisations. It can provide a cushion of excess
resources that can prevent disruptions, permits firms to adapt to major shifts in the
environment, eases creative conduct, and provides means for the resolution of conflict
(Stan et al, 2014). Chopra and Sodhi (2012), and Hendricks & Singhal (2005) also
reinforced this point that by having slack resources, a firm is protected against different
forms of disruptions. Furthermore, scholars state that slack is an important catalyst for
innovation (Nohria & Gulati, 1996). It is therefore expected that the relationship
between slack and survivability will be positive.
Hypothesis 1: Survivability increases with the increase of firms’ slack resources.
2.2.2 – Aspirations
Schneider (1992, p.1053) mentioned aspiration level as being “the smallest outcome
that would be deemed satisfactory by the decision maker”. In a limited way, decision
makers usually use aspirations to establish the bounds between failure and success in
“continuous measures of performance” (Iyer & Miller 2008, p.810). Iyer and Miller
(2008, p.810) also referred that “aspiration formation can draw on either historical or
social performance criteria”.
With regards to the study of Aspirations in new ventures, few to no studies examine the
Firms are driven by objectives, and these objectives can take different forms. For
example, according to Cyert and March (1963, p.28) “... most organisation objectives
take the form of an aspiration level, rather than an imperative to ‘maximise’ or
‘minimise’ ”.
Other empirical studies, such as those of Lant (1992), Lant & Mezias (1992) and Lant &
Montgomery (1987), supported the existence of disagreement with regards to the
statement that “aspiration levels in organisations are functions of previous aspirations
and feedback about actual performance” (Iyer & Miller, 2008, p.810).
Another important aspect is the difference between Performance and Aspirations. Lant
(1992) called this “attainment discrepancy”. Iyer and Miller (2008) highlighted the fact
that if attainment discrepancy is negative, this means that performance is below
aspiration level, leading to a problemistic search being taken by the firm. Cyert and
March (1963) defined problemistic search as being a search which is stimulated by a
problem and leads to finding a solution for that problem. According to Chen and Miller
(2007), firms that operate below aspirations, seek ways to enhance their prospects for
achieving their target performance. In consonance, Iyer and Miller (2008) stated that
underperforming firms are motivated to engage in problemistic search. This is also
explained by the fact that satisfaction is not the only predictor of high production
(Mahnke, 1998). The motivation to produce can originate from a present or anticipated
state of discontent (March & Simon, 1958). Bearing these arguments under
consideration, it is expected that a firm operating below aspirations will not maintain
routines, and will work to increase its performance, increasing its future prospects for
survival.
problemistic search being taken by the firm. We can understand that if a firms’
performance is above the aspiration level, it should then decrease the problemistic
search taken by the firm. Furthermore, this leads to the firm being less willing to make
changes (Greve, 2003), as it will tend to rely on past operating procedures, unless it fails
to achieve aspirations (Cyert & March, 1963). Besides this supposition, Levinthal and
March (1981) stated that achieving a performance level above aspirations leads to the
accumulation of slack. This accumulation of slack would have a positive effect on the
firm, supporting it against different forms of disruptions (Hendricks & Singhal, 2005).
Thus, logically, the chance of survivability should increase.
Hypothesis 2: Survivability increases when firms’ performance is above
aspirations.
Problemistic search can be a two-headed argument. With an increase or a decrease in
problemistc search, the final result can be the same, or in other words, it can positively
influence the survivability of firms.
Ocasio (1997) stated that the focus of the attention of firms’ employees can be
influenced by organisations’ situations. Furthermore, Chen and Miller (2007) referred to
the fact that the allocation of attention affects an organisation’s decision-making.
March and Shapira (1987, 1992) mentioned that firms can change their focus of
attention and not be just focussed on a single reference point that only considers
aspirations, such as assumed by Cyert and March’s behavioural theory of the firm.
When a firm is performing below its aspirations, its attention will turn to survival and to
increasing aspirations. This focus of attention will be in accordance with how far the
will be on the survival of the firm. On the other hand, if a firm is a long way from
bankruptcy, then it will turn its attention to aspiration levels, which it will try to increase
(March & Shapira 1987, 1992). As stated by Greve (2003), managers will focus on that
reference point which is closer to actual performance, as the consequences of getting to
the closest point appear to be greater.
Chen and Miller (2007) found that those variables that affect risk differ for sets of firms
that are grouped according to the March and Shapira (1992) categories.
Staw et al (1981) suggest that firms that focus their attention on survival are less likely
to engage in risk taking behaviours. The behaviour of threatened companies is more
conservative and these often apply cost reduction strategies (Schendel et al, 1976;
Starbuck, 1992) and limit new strategic initiatives (D’Aveni, 1989).
Conversely, firms that are not threatened by bankruptcy tend to focus their attention on
accelerating their growth (Slatter, 1984: 96).
Following this logic, we propose:
Hypothesis 3a: Proximity to bankruptcy is more relevant for the survivability of
underperforming firms that are directly threatened by bankruptcy, than for
underperforming firms that are not threatened by bankruptcy.
Hypothesis 3b: The difference between Performance and Aspirations is more
relevant for the survivability of underperforming firms that are not threatened by
bankruptcy, than for underperforming firms that are directly threatened by
bankruptcy.
Di Lorenzo et al (2011) stated that when performance is above aspirations, it will not
give them confidence to pursue promising ideas that were considered as being too risky
before.
If a firm is performing above its aspirations, it can turn its attention to two factors, Slack
or Aspirations. In a case where a firm has low slack resources, it will turn its attention to
aspirations, but should a firm outperform aspirations, this will probably lead to the
accumulation of slack (Levinthal & March, 1981). On the other hand, if a firm has
abundant slack resources, managers will make decisions based on the amount of slack,
as slack acts as a support against different forms of disruption (Chopra & Sodhi, 2012);
Hendricks & Singhal, 2005). A firms’ stock of resources allows firms to sustain many
periods of reduced financial performance with lower threats of failure (Levinthal, 1991).
A large stock of resources has the safeguarding effect of lowering the level of
performance at which a firm’s survival is in danger (Greve, 2003).
We can propose the following hypothesis:
Hypothesis 4a: The difference between Performance and Aspirations is more
relevant for the survivability of outperforming firms with less slack, than it is for
outperforming firms with abundant slack.
Hypothesis 4b: Slack resources are more relevant for survivability for
outperforming firms with abundant slack, than for outperforming firms with less
slack.
2.2.3 - Size
In addition to Slack and the failure to attain Aspirations, another determinant which can
affect firms’ survivability is the size of the firm. Most recent literature agrees that the
2006; Nunes & Sarmento, 2010). The probability of the survivability of a firm increases
with initial size. According to Nunes and Sarmento (2010), the reasons behind the
aforementioned fact are associated with the efficient scale that is needed to operate
efficiently in a market, with the inferior management skills of small entrepreneurs and
also with the capacity that firms have to access financial markets. In line with the
previous research, our last hypothesis is:
Hypothesis 5: Firm size increases survivability
3
–
Data description and Methodology
3.1 – Sample
The data were provided by Informa D&B database, and were gathered from accounts
and annual reports. Portuguese firms are obliged to file information about their annual
financial and operating performance using the IES Form (Informação Empresarial
Simplificada). The criterion for choosing these firms was strict. The only firms
considered were Portuguese SMEs in the manufacturing sector with a number of
employees ranging from between 10 and 250 at the starting point of the firm, which
commenced activity between 2009 and 2011, and the ventures were tracked up until
2013. The sample of firms for this dissertation was comprised of 979 Portuguese SME
manufacturing new ventures. Firms with less than 3 years of activity, or firms in the
process of acquisition were dropped. The final sample was comprised of 763 firms from
22 different CAEs (industry/services sectors), resulting in a total of 2,951
year-observations.
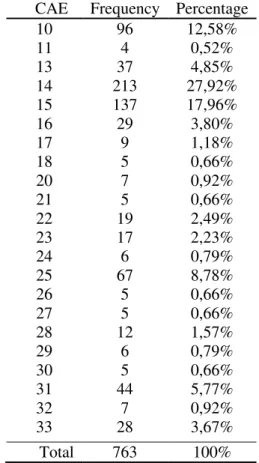
As observed in Table I, the most prominent CAEs for this study are; CAE 14, with
leather industry, and; CAE 10, with 12.58% representing the food industry (INE, 2007).
The least prominent CAEs are: CAE 11, with 0.52%, representing the beverage
industry, and; CAEs 18, 26 and 27 with a total of 0.66%, representing respectively the
printing, computer equipment, and electric equipment industries (INE, 2007).
Table I – CAE Frequency Table
CAE Frequency Percentage
10 96 12,58%
11 4 0,52%
13 37 4,85%
14 213 27,92%
15 137 17,96%
16 29 3,80%
17 9 1,18%
18 5 0,66%
20 7 0,92%
21 5 0,66%
22 19 2,49%
23 17 2,23%
24 6 0,79%
25 67 8,78%
26 5 0,66%
27 5 0,66%
28 12 1,57%
29 6 0,79%
30 5 0,66%
31 44 5,77%
32 7 0,92%
33 28 3,67%
Total 763 100%
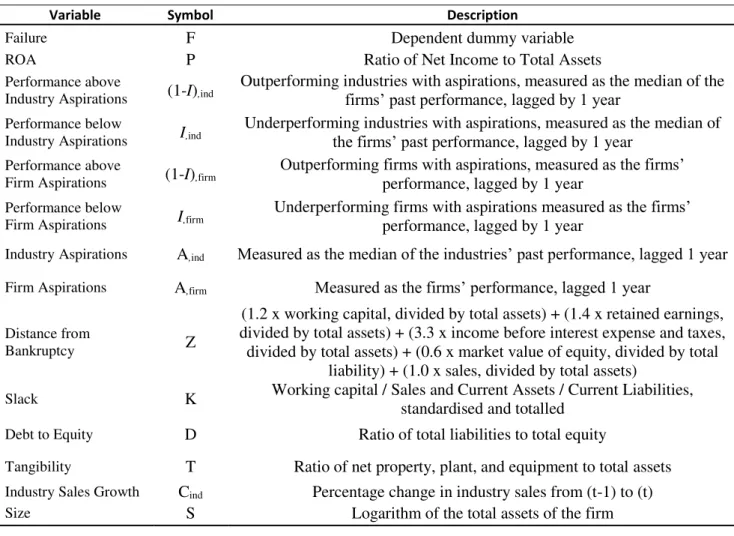
3.2 – Definition of Variables
The objective of this dissertation is to test the impact of the selected determinants on
Portuguese manufacturing SMEs. Failure was considered as the dependent variable. The
following independent variables were considered: Return on Assets (ROA), Aspirations,
Distance from Bankruptcy, and Slack. For the control variables the following were
The summary of the variable definitions and their abbreviations can be found in Table
II.
3.2.1 – Dependent Variables
Failure
The dependent variable is venture failure, which reflects whether the firm failed, or not.
This is a dummy variable which assumes the value of 1, if one of the following
situations was reported by Informa D&B: dissolution, extinction, insolvency, or legal
closure. It assumes the value of 0, if the venture remained active.
3.2.2 – Independent Variables
Return on Assets (ROA)
This variable is the measure of performance. Performance is a variable which affects the
way managers make decisions. In the model presented in this dissertation, the variable
ROA has a lag of 1 year, in comparison to the dependent variable.
The ROA was calculated using the ratio of Net Income to Total Assets (Parrino et al.,
2009).
Aspirations
Authors such as Cyert and March (1963) state that aspirations are a linear combination
of firms’ past performance and the experiences of other reference firms. As it is not
clear how firms measure their own performance and that of other firms, this method for
measuring aspirations can be ambiguous. Bearing this in mind, in this dissertation,
aspirations were measured using the Chen and Miller (2007) model, running two
was measured by firms’ performance, the ROA lagged by 1 year. Industry aspiration
was measured as the median of industries’ past performance, the ROA lagged by 1 year.
Distance from Bankruptcy
This variable was measured using Altman’s (1983) Z-score, which is (1.2 x working
capital, divided by total assets) + (1.4 x retained earnings, divided by total assets) + (3.3
x income before interest expense and taxes, divided by total assets) + (0.6 x market
value of equity, divided by total liability) + (1.0 x sales divided by total assets). The
lower the Z-score is, the higher is the likelihood of bankruptcy (Altman, 1968).
Slack
This variable was calculated as proposed by Bourgeois (1981) and Singh (1986). The
proxies used were the working capital to sales ratio, and the current ratio (current assets
divided by current liabilities). These two proxies were standardised and were totalled, in
order to obtain the composite slack index, as proposed by Chen and Miller (2007).
Size
This variable corresponds to the logarithm of the total assets of the firm (Maury &
Pajuste, 2005).
3.2.3 – Control Variables
Industry Sales Growth
This variable was included, as industry projections can influence firms’ investment
decisions (Chen and Miller, 2007). In order to compute this variable, the percentage
Debt to Equity
Debt to Equity is the ratio of total liabilities to total equity (Parrino et al., 2009).
Tangibility
The variable Tangibility corresponds to the ratio of net property, plant and equipment,
to total assets (Balcaen, et al., 2011). This variable provides signs of stability for firms.
Table II – Variables Description
3.3 – Methodology
To test the effect of the determinants on the survivability of the firms, a duration model
(Cox model) was used, divided into two columns: one for Firm Aspirations and the
other for Industry Aspirations. This way it is thus possible to estimate the effect of
aspirations on the dependent variable for both firms and industries. This estimation
Variable Symbol Description
Failure F Dependent dummy variable
ROA P Ratio of Net Income to Total Assets
Performance above
Industry Aspirations (1-I),ind
Outperforming industries with aspirations, measured as the median of the
firms’ past performance, lagged by 1 year
Performance below
Industry Aspirations I,ind
Underperforming industries with aspirations, measured as the median of
the firms’ past performance, lagged by 1 year
Performance above
Firm Aspirations (1-I),firm
Outperforming firms with aspirations, measured as the firms’
performance, lagged by 1 year
Performance below
Firm Aspirations I,firm
Underperforming firms with aspirations measured as the firms’
performance, lagged by 1 year
Industry Aspirations A,ind Measured as the median of the industries’ past performance, lagged 1 year
Firm Aspirations A,firm Measured as the firms’ performance, lagged 1 year
Distance from
Bankruptcy Z
(1.2 x working capital, divided by total assets) + (1.4 x retained earnings, divided by total assets) + (3.3 x income before interest expense and taxes, divided by total assets) + (0.6 x market value of equity, divided by total
liability) + (1.0 x sales, divided by total assets)
Slack K Working capital / Sales and Current Assets / Current Liabilities, standardised and totalled
Debt to Equity D Ratio of total liabilities to total equity
Tangibility T Ratio of net property, plant, and equipment to total assets
Industry Sales Growth Cind Percentage change in industry sales from (t-1) to (t)
model, being a survival model, relates the time that passes before an event occurs, to
one or more covariates that may be associated with that quantity (Roebuck, 2012). In
this particular case, it relates the time that the firm spent active, to the determinants that
were maybe associated with that amount of time. The dependent variable Failure
assumes the value 1, if the firm fails, and 0, if the firm remains active, and thus a
negative coefficient indicates a lower likelihood of failure and a positive coefficient
indicates a higher likelihood of failure. The analysis of this model was performed using
Stata 13 software.
3.3.1 – Model
In order to approach the aforementioned hypothesis, two indicator variables had to be
incorporated. One was for underperforming firms, I1, which equals to 1, if a firm is
performing below aspirations, and another for outperforming firms (1 – I1) which takes
the value 1, if a firm is performing above aspirations. The following model was
estimated:
h(t) = hi(t)exp[β1St+ β2Dt+ β3Tt+ β4Cind,t+ β5(1 –I1)(Pt-1– At-1) + β6I1(Pt-1– At-1)
+ β7Zt-1+ β8Kt-1]
The dependent variable h(t) represents the hazard of failure in period t. This model
includes hi(t), which is a time dependent hazard rate for industry i. St designates the firm
i’s size in period t. Dt represents the debt-to-equity ratio of firm i in period t. The
variable Tt corresponds to the tangibility. Cind,t designates the percentage growth in
industry sales, lagged by 1 year, which controls industry projections that can influence
firms’ investment decisions. Pt-1 measures firm i’s performance measured by the ROA
lagged by 1 period. At-1 corresponds to the aspiration level of firm i in period t – 1. Zt-1
designates the distance from bankruptcy, whilst Kt-1 represents the organisational slack
lagged by 1 period. The decision to use independent variables lagged by 1 period, has
the objective to reflect the temporal ordering in causal arguments (Chen and Miller,
2007). It is also important to refer that the models were generated with robust standard
errors, thus avoiding the problem of heteroscedasticity.
Next, several different models had to be estimated to assess the different approaches and
behaviours of Hypothesis 3 and Hypothesis 4. The estimation of the following models
took in to account whether the firm was: [1] performing above aspirations, with
abundant slack resources; [2] performing above aspirations with low slack resources;
[3] performing below aspirations and threatened by bankruptcy, and; [4] performing
below aspirations and not threatened by bankruptcy. The model for underperforming
firms was:
h(t) = hi(t)exp[β1St + β2Dt + β3Tt + β4 Cind,t + β5(Pt-1– At-1) + β6Zt-1+ β7Kt-1],
if Pt-1 < At-1
For overperforming firms, the model estimated was:
h(t) = hi(t)exp[β1St + β2Dt + β3Tt + β4 Cind,t + β5(Pt-1– At-1) + β6Zt-1+ β7Kt-1],
if Pt-1 > At-1
The method used permits all variables to be tested through the four subsamples. This
allows for the testing of the relevance of slack and bankruptcy on the different types of
firms addressed in Hypothesis 3 and 4, verifying the shifts in the focus of attention.
4
–
Analysis and Discussion of Empirical Results
4.1 – Descriptive Statistics and Correlations
(2)
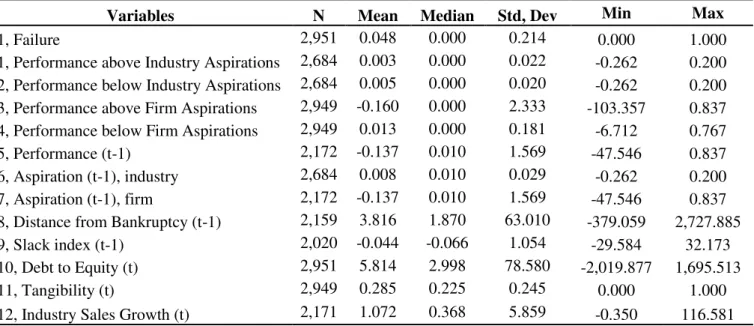
Table III presents the descriptive statistics for the dependent and independent variables.
The dependent variable Failure has a mean of 0.048. This shows that the majority of the
firms present in the sample remained active through the period considered.
The Performance above Industry Aspirationst-1 and Performance below Industry
Aspirationst-1 variables both present different means. The Performance above Industry
Aspirationst-1 has a mean of 0.003, while Performance below Industry Aspirationst-1 has
a mean of 0.005. This shows that there are more underperforming industries in the
sample than outperforming industries. The same can be said for performance relative to
aspirations when measured for firms. Performance above Firm Aspirationst-1 has a mean
of -0.160, while Performance below Firm Aspirationst-1 has a mean of 0.013. This
means that the sample has more underperforming firms than outperforming firms when
aspirations are measured for firms.
Distance from Bankruptcy presents a mean of 3.816. This value represents a “safe
zone”, since it is above 2.99, following the Altman Z-score (Altman, 1968). We can
state that the mean is in a “safe zone”, but a very high standard deviation can be
observed, implying that some of the firms in the sample can be in a very dangerous
position.
The Slack shows a negative mean of -0.044, which means that the firms in this sample
do not seem to possess the excess resources needed to provide the necessary cushion to
protect them.
The Debt to Equity ratio has a mean of 5.814. This mean indicates that the firms
selected for the sample rely more on debt than equity to pursue their activity. This
debt from industry to industry. It is known that some industries use debt more than
others, such as the construction industry for example.
The Tangibility ratio shows a mean of 0.285. This is due to the fact that SMEs that
commenced their activity a short time ago, do not possess large quantities of net
property and equipment in proportion to total assets.
Industry Sales Growth has a mean of 1.072. This variable is expressed as a percentage,
which means that the mean for Industry Sales Growth is about 107.2%. This is a large
value, which can be explained by the growth in sales during firms’ first years of
Table III – Descriptive Statistics of variables for Portuguese SME Firms
Variables N Mean Median Std, Dev Min Max
1, Failure 2,951 0.048 0.000 0.214 0.000 1.000
1, Performance above Industry Aspirations 2,684 0.003 0.000 0.022 -0.262 0.200
2, Performance below Industry Aspirations 2,684 0.005 0.000 0.020 -0.262 0.200
3, Performance above Firm Aspirations 2,949 -0.160 0.000 2.333 -103.357 0.837
4, Performance below Firm Aspirations 2,949 0.013 0.000 0.181 -6.712 0.767
5, Performance (t-1) 2,172 -0.137 0.010 1.569 -47.546 0.837
6, Aspiration (t-1), industry 2,684 0.008 0.010 0.029 -0.262 0.200
7, Aspiration (t-1), firm 2,172 -0.137 0.010 1.569 -47.546 0.837
8, Distance from Bankruptcy (t-1) 2,159 3.816 1.870 63.010 -379.059 2,727.885
9, Slack index (t-1) 2,020 -0.044 -0.066 1.054 -29.584 32.173
10, Debt to Equity (t) 2,951 5.814 2.998 78.580 -2,019.877 1,695.513
11, Tangibility (t) 2,949 0.285 0.225 0.245 0.000 1.000
12, Industry Sales Growth (t) 2,171 1.072 0.368 5.859 -0.350 116.581
Notes: Failure: Dependent dummy variable; Performance above Industry Aspirations: Outperforming firms with aspirations measured as the median of the industry’s past performance, lagged by 1 year; Performance below Industry Aspirations: Underperforming firms with aspirations measured as the median of the industry’s past performance, lagged by 1 year; Performance above Firm Aspirations: Outperforming firms with aspirations measured as the firms’ performance, lagged by 1 year; Performance below Firm Aspirations: Underperforming firms with aspirations measured as the firms’ performance, lagged by 1 year;
Performancet-1: ROA = Net Income / Total Assets; Aspirationt-1,ind: median of the industries’ past performance, lagged by 1
year; Aspirationt-1,firm : mean of the firms’ performance, lagged by 1 year; Distance from Bankruptcyt-1 = (1.2 x Working
Capital / Total Assets) + (1.4 x Retained Earnings / Total Assets) + (3.3 x Income before Interest, Expense and Taxes / Total Assets) + (0.6 x Market Value of Equity / Total Liability) + (1.0 x Sales / Total Assets); Slack indext-1 : Working
Variables 1 2 3 4 5 6 7 8 9 10 11 12 13
1, F 1
2, (1-I)t-1,ind -0.008 1
3, It-1,ind 0.021 -0.031 1
4, (1-I)t-1,firm -0.088*** 0.014 0.073*** 1
5, It-1,firm -0.047** 0.099*** -0.019 0.005 1
6, Pt-1 -0.017 0.064*** 0.022 0.023 0.272*** 1
7, At-1,firm -0.017 0.064*** 0.022 0.023 0.272*** 1*** 1
8, At-1,ind -0.079*** 0.116*** -0.269*** 0.083*** 0.250*** 0.055** 0.055** 1
9, Zt-1 -0.009 -0.003 0.064*** -0.001 0.038* 0.139*** 0.139*** -0.020 1
10, Kt-1 -0.011 0 0.007 0.002 0.003 0.007 0.007 -0.012 0.156*** 1
11, Dt -0.004 -0.062*** 0.024 0.007 0.006 0.015 0.015 0.021 -0.001 -0.01 1
12, Tt -0.100*** -0.132*** -0.093*** 0.033* -0.005 -0.002 -0.002 -0.096*** 0.049** 0 0.012 1
13, Cind,t 0.009 -0.056*** -0.062*** 0.003 -0.007 -0.005 -0.005 0 -0.007 0 -0.004 -0.024 1
19 Go n çal o Brun o Cass o la d e Al m ei d a G o n çal v es, M a ste r i n Fi n an ce Si tuati o n al D et er m in an ts o f t h e Su rv iv ab ili ty o f P o rtug u ese S M Es
Notes: F: Dependent variable Failure; (1-I)t-1,ind : Outperforming firms with aspirations measured as the median of industries’ past performance, lagged by 1
year; It-1,ind : Underperforming firms with aspirations measured as the median of industries’ past performance, lagged by 1 year; (1-I)t-1,firm : Outperforming
firms with aspirations measured as the firms’ performance, lagged by 1 year; It-1,firm: Underperforming firms with aspirations measured as the firms’
performance, lagged by 1 year; Pt-1 : ROA = Net Income / Total Assets; At-1,firm : mean of the firms’ performance, lagged by 1 year; At-1,ind : median of the
firms’ past performance, lagged by1 year; Zt-1 = (1.2 x Working Capital / Total Assets) + (1.4 x Retained Earnings / Total Assets) + (3.3 x Income Before
Interest Expense and Taxes / Total Assets) + (0.6 x Market Value of Equity / Total Liability) + (1.0 x Sales / Total Assets); Kt-1: Working capital / Sales
and Current Assets / Current Liabilities, standardised and summed; Dt= Total liabilities / Total equity; Tt = Net property, plant, and equipment / Total
assets; Cind,t = Percentage change in industry sales from (t-1) to (t).
*, **, and *** represent statistical significance at the levels of 10%, 5% and 1% respectively.
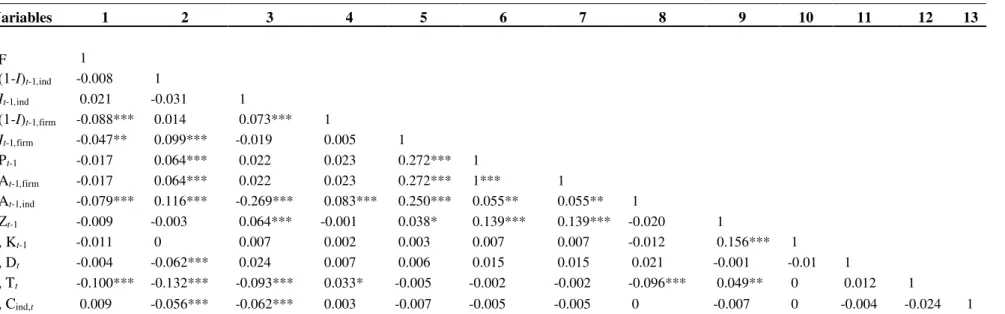
Regarding the variables stressed for this study, some correlations can be highlighted.
As observed in Table IV, the dependent variable Failure presents a linear significant
association with Performance Above Firm Aspirations with 1% significance. It also
reveals a linear significant association with Performance Below Firm Aspirations with
5% significance and 1% significant association with Industry Aspirations and
Tangibility. It is also important to highlight that the dependent variable Failure has a
negative relation with almost every variable, although only four variables are
significantly associated with the dependent variable.
4.2 – Results
Table V presents the results of the Cox regression.
Table V –Results of the Cox’s Proportional Hazards Model
Firm Aspirations Industry Aspirations
Performance above Aspirations -0.015*** -7.901**
Performance below Aspirations -0.046 1.243
Slack composite indext-1 -0.104** -0.113**
Distance from Bankruptcyt-1 -0.016 -0.013
Sizet -0.299*** -0.350***
Debt to Equityt 0.001 0.001
Tangibilityt -2.083*** -2.163***
Industry Sales Growtht
Wald
(8)
Prob > 0.031*** 300.960 0.000 0.031*** 80.010 0.000
Observations 2.020 2.020
Notes: Performance above Aspirations: Outperforming firms with aspirations measured as the
firms’ performance, and measured as the median of industries’ past performance, lagged by 1 year; Performance below Aspirations: Underperforming firms with aspirations measured as the firms’ performance, and measured as the median of industries’ past performance, lagged by 1 year; Slack composite indext-1: Working capital / Sales and Current Assets / Current Liabilities, standardised
and summed; Distance from Bankruptcyt-1: (1.2 x Working Capital / Total Assets) + (1.4 x
Retained Earnings / Total Assets) + (3.3 x Income Before Interest Expense and Taxes / Total Assets) + (0.6 x Market Value of Equity / Total Liability) + (1.0 x Sales / Total Assets); Sizet: log
(Total Sales); Debt to Equityt= Total liabilities / Total equity; Tangibilityt = Net property, plant,
(t-As Failure was used as the dependent variable, the conclusions for the results regarding
the Cox’s proportional Hazards Model will have an inverse interpretation. With the
variable Failure equalling to 1 when a firm fails, if a statistically significant variable
presents a negative value, then it will reduce the chances of failure for a given firm.
As seen in Table V, Slack shows a negative relation with the dependent variable with a
significant level (5%) for both Firm and Industry Aspirations, proving to be significant
for explaining the dependent variable. The higher the Slack, the lower will be the danger
of failure for a firm, as it provides a cushion of excess resources which can prevent
disruptions. This result is consistent with Hypothesis 1, where survivability increases
with the increase of firms’ slack resources.
By looking at Table V, it is possible to observe that the Attainment Discrepancy for
outperforming firms and industries proves to be a significant variable. The Performance
above Aspirations variable for outperforming firms shows a negative statistically
significant (1%) relationship with the dependent variable Failure. Performance above
Aspirations for outperforming industries also presents a negative statistically significant
(5%) relation with the dependent variable. The results are consistent with Hypothesis 2,
which shows that survivability increases with the distance of firms’ performance above
aspirations.
The Attainment Discrepancy for underperforming firms and industries is not
statistically significant.
The variable Size is statistically significant (1%), having a negative relationship with
the dependent variable for both Firm Aspirations and Industry Aspirations. The larger
the size of the firm, the lower will be the chance of failure of that firm. This result is
The variable Debt-to-Equity does not have a significant effect on the survivability of a
firm, as the variable is not statistically significant, showing no relevance for the study.
It is also possible to observe in Table V that tangibility is relevant for the survivability
of a firm. This variable shows a negative significant (1%) relation with the dependent
variable Failure. The higher the Tangibility, the lower will be the chance of failure. It
can thus be concluded that the more net property and equipment a firm possesses, the
lower is the likelihood of failure.
The control variable Industry Sales Growth shows a positive and statistically significant
(1%) relationship with the dependent variable for both Firm and Industry Aspirations,
which means that the higher is Industry Sales Growth, then the higher will be the
chance of failure. A venture has a life cycle composed of different stages. Sales growth
in a new venture occurs in its growth stage. When a new venture shows fast growth
during this stage, it can become a challenge to the entrepreneur. This stage can be the
most dangerous one, and it is during this stage when most failures occur, caused by
pressure on resources, or overtrading (Nieman & Pretorius, 2004).
Table VI presents the results for the models (2) and (3). These equations allow the study
of the impact that changes in the focus of attention have on the survivability of firms.
Outperforming firms were divided according to their abundance of Slack resources,
ranging from abundant Slack resources, to little Slack resources. Underperforming firms
were divided according to the level of threat by bankruptcy, ranging from not threatened
by bankruptcy, to threatened by bankruptcy. The Attainment Discrepancy was different
for each scenario but was included as a single variable. Outperforming attainment
discrepancy was considered for Outperformers, whilst for Underperformers,
Outperformers with abundant slack resources
(Higher 50% slack)
Outperformers with less slack resources (Lower
50% slack)
Underperformers threatened by
bankruptcy (Lower 50% Z)
Underperformers not threatened by
bankruptcy (Higher 50% Z)
Firm Aspiration Industry Aspiration Firm Aspiration Industry Aspiration Firm Aspiration Industry Aspiration Firm Aspiration Industry Aspiration
(Performancet-1 - Aspirationt-1) -0.906* -13.047*** -0.008 -4.940 0.038 -8.368** -2.725 -1.139
(-1.683) (-3.111) (-1.018) (-1.284) (0.138) (-2.321) (-1.493) (-0.166)
Slack composite indext-1 -4.484 -0.205 -0.068 3.279*** -1.038** -0.086* 4.881 -25.127***
(-0.678) (-0.075) (-1.363) (2.694) (-1.980) (-1.824) (1.572) (-3.415)
Distance from Bankruptcyt-1 -0.174 -0.188** -0.060 0.020 0.096 0.096* -0.091 0.016
(-0.948) (-2.187) (-0.551) (0.297) (1.559) (1.701) (-0.958) (0.124)
Sizet -0.241 -0.563*** -0.250* -0.513** -0.794*** -0.437*** -0.494* -0.062
(-1.191) (-2.821) (-1.653) (-2.420) (-3.354) (-3.491) (-1.794) (-0.330)
Debt to Equityt -0.005 0.003 0.002* -0.011*** -0.005*** 0.002* -0.004 -0.002*
(-1.162) (0.863) (1.823) (-7.172) (-3.273) (1.889) (-1.319) (-1.729)
Tangibilityt -4.111* -1.771 -2.452*** -5.109** -3.516** -1.920*** -1.735 -5.517***
(-1.653) (-0.776) (-2.987) (-2.547) (-2.544) (-2.871) (-0.712) (-2.658)
Industry Sales Growtht 0.024** 0.029*** 0.033*** 0.477*** 0.037*** 0.028*** 0.460*** 0.019*
(2.063) (3.033) (2.835) (7.885) (3.263) (2.752) (6.791) (1.844)
Observations 494 592 468 581 504 380 551 467
23 Go n çal o Brun o Cass o la d e Al m ei d a G o n çal v es, M a ste r i n Fi n an ce Si tuati o n al D et er m in an ts o f the Sur v iv ab ili ty o f P o rtug u ese S M Es
Table VI –Cox’s Proportional Hazards Model: results for four subsamples
Notes: (Performancet-1 - Aspirationt-1): Attainment Discrepancy (Performance above Aspirations for outperformers and Performance below Aspirations for
Underperformers); Slack composite indext-1: Working capital / Sales and Current Assets / Current Liabilities, standardised and totalled; Distance from
Bankruptcyt-1: (1.2 x Working Capital / Total Assets) + (1.4 x Retained Earnings / Total Assets) + (3.3 x Income Before Interest Expense and Taxes / Total
With regards to underperforming firms threatened, the results presented on Table VI
show that there is a negative statistically significant relationship between Slack, Size,
Debt to Equity and Tangibility with the survivability of underperforming firms
threatened by bankruptcy, and a positive statistically significant relationship with
Industry Sales Growth. Concerning the survivability of underperforming industries
threatened by bankruptcy, there is a negative statistically significant relationship with
Attainment Discrepancy, in addition to the significant variables in relation to the
survivability of underperforming firms threatened by bankruptcy, except the Debt to
Equity variable.
The survivability of underperforming firms that are not threatened by bankruptcy has a
negative statistically significant relationship with Size, and a positive significant
relationship with Industry Sales Growth.
With regards to underperforming industries not threatened by bankruptcy, the results
show a negative statistically significant relationship between Slack, Debt to Equity and
Tangibility with the survivability of underperforming industries not threatened by
bankruptcy, and a positive statistically significant relationship with Industry Sales
Growth.
The results achieved partially support Hypothesis 3a for Industry Aspirations, as the
variable Distance from Bankruptcy has a statistically significant (10%) relation with the
dependent variable for underperforming industries threatened by bankruptcy, whilst
Distance from Bankruptcy is not statistically significant for underperforming industries
that are not threatened by bankruptcy.
Neither is Hypothesis 3b is not supported by the results, as the Attainment Discrepancy
variable is not statistically significant for the scenario of underperforming firms that are
The results displayed on Table VI show that the impact on the survivability of
outperforming firms with abundant Slack resources depends on Attainment
Discrepancy, Tangibility and Industry Sales Growth, since all the aforementioned
variables are statistically significant. The survivability of outperforming industries with
abundant Slack resources has a negative statistically significant relationship with
Attainment Discrepancy, Distance from Bankruptcy and Size, but a statistically
significant relation with Industry Sales Growth.
On the other hand, the survivability of outperforming firms with less Slack resources
has a negative statistically significant relationship with Size and Tangibility, and a
positive significant relation with Debt to Equity and Industry Sales Growth.
These results do not support Hypothesis 4a. Attainment Discrepancy has no effect on
the survivability of outperforming firms with less slack, as the referred variable is not
statistically significant.
Hypothesis 4b is also not supported by these results. Slack is not statistically significant
for outperforming firms with abundant slack.
5 - Conclusions
5.1 – Final Considerations
The impact that situational determinants have on the failure of Portuguese SME new
ventures between 2009 and 2013 was analysed in this dissertation.
With regards to the impact of Attainment Discrepancy on the dependent variable
Failure, the expected results were achieved when a firm is performing above
relationship with the dependent variable Failure. This provides evidence that the higher
a firm performs above aspirations, then the less likely it is to go bankrupt.
The expected results were achieved regarding the impact of Slack and Size on the
failure of a firm. Both independent variables have a negative statistically significant
relationship with the dependent variable failure. The results achieved have helped prove
that the cushion provided by Slack can help sustain a firm against failure. With regards
to Size, the results of this study prove that the bigger the firm, the less likely it is to fail.
Concerning the study of the impact that changes in the focus of attention have on the
survivability of firms, the results achieved for proximity to bankruptcy were those
expected, proving that this is more relevant for the survivability of underperforming
firms that are directly threatened by bankruptcy, rather than for underperforming firms
that are not threatened by bankruptcy. A firm that is threatened by bankruptcy will turn
its focus of attention towards its survival.
The results for Attainment Discrepancy were not the expected, proving that it is more
relevant for the survivability of underperforming firms that are not threatened by
bankruptcy, than for underperforming firms that are directly threatened by bankruptcy,
since the variable Attainment Discrepancy was not statistically significant for
underperforming firms that are not threatened by bankruptcy.
With regards to the abundance of Slack resources in outperforming firms, the results for
both hypotheses were unexpected, and the Hypotheses were not verified. Attainment
Discrepancy was not statistically significant for the survivability of outperforming firms
with less slack. Slack was not statistically significant for the survivability of
outperforming firms with abundant slack.
that underperforming firms threatened by bankruptcy are more concerned about their
survival.
5.2 –Limitations and Further Research
This study has some limitation concerning the sample. The sample limitations are
related to dimension and composition. The dimension of this study is considered small
when compared with other studies, having only 763 new ventures. The dissertation only
comprises Portuguese SME manufacturing new ventures and it would be interesting to
analyse the results of more countries, with more firms that have these characteristics.
Another important issue is the fact that the initial years of the study (2009-2011) were
badly affected by the world economic crisis, and thus the results may reflect this bad
moment for both the Portuguese and the World economy.
Regarding future research, it would be interesting to study a larger sample from
different countries.
Another interesting suggestion would be to perform the study for more periods, carrying
out an analysis before, and after, the crisis, in order to compare its effects on the
survivability of manufacturing new ventures.
It would also be interesting to study with more detail how Aspirations affect the
6
–
References
Altman, E. I. (1968). Financial Ratios, Discriminant Analysis and the Prediction of
Corporate Bankruptcy. The Journal of Finance23 (4), 589-609.
Altman EI. (1983). Corporate Distress: A Complete Guide to Predicting, Avoiding, and
Dealing with Bankruptcy, New York: Wiley
Antony, J., Kumar, M., & Madu, C. N. (2005). Six sigma in small-and medium-sized
UK manufacturing enterprises: Some empirical observations. International
Journal of Quality & Reliability Management 22 (8), 860-874.
Audretsch, D.B. (1991). New-firm survival and the technological regime. Review of
Economics and Statistics 73 (3), 441-450.
Backaitis, N., & Rosen, H. H. (1990). Readings on Managing Organizational Quality.
Navy Personnel Research and Development Center San Diego CA
NPRDC-TN-90-19.
Balcaen, S., Manigart, S., Ooghe, H., 2011. From distress to exit: determinants of the
time to exit. Journal of Evolutionary Economics 21 (3), 407-446.
Bourgeois, L. J. (1981). On the measurement of organizational slack. Academy of
Management Review 6, 29–39.
Burke, A. E., & Hanley, A. (2009). Market concentration and business survival in static
v dynamic industries. Kiel working paper 1517.
Chen, W. R., & Miller, K. D. (2007). Situational and institutional determinants of firms'
Chopra, S., & Sodhi, M. S. (2012). Managing risk to avoid supply-chain breakdown.
MIT Sloan Management Review (Fall 2004).
Cyert, R. M., & March, J. G. (1963). A behavioral theory of the firm, Englewood Cliffs:
Prentice-Hall.
Dahl, M. S., & Reichstein, T. (2007). Are you experienced? Prior experience and the
survival of new organizations. Industry and Innovation 14 (5), 497-511.
D'aveni, R. A. (1989). The aftermath of organizational decline: A longitudinal study of
the strategic and managerial characteristics of declining firms. Academy of
Management Journal 32 (3), 577-605.
Delgado, D. F. (2010). Desenvolvimento de um modelo de internacionalização para
PME Portuguesas com componentes de serviços. Mestrado em Inovação e
Empreendedorismo tecnológico-FEUP.
Delmar, F., & Wennberg, K. (2007). Risk taking, aspiration levels and the evolution of
new ventures.
Di Lorenzo, F.; Almeida, P.; Balderrama, P. A. P. (2011). Aspirations, performance and
changes in partnering behavior: Evidence from the pharmaceutical industry
1990-2006. Strategic Management Society (SMS).
Geroski, P. A., Mata, J., & Portugal, P. (2010). Founding conditions and the survival of
new firms. Strategic Management Journal 31 (5), 510-529.
Greve, H. R. (2003). A behavioral theory of R&D expenditures and innovations:
Grupo Marktest (2011). Estudos sobre Concelhos/Regiões. Available from:
http://www.marktest.com/wap/a/n/id~18d7.aspx [Accessed: 29/04/2015].
Hendricks, K. B., & Singhal, V. R. (2005). An empirical analysis of the effect of supply
chain disruptions on long‐ run stock price performance and equity risk of the
firm. Production and Operations management14 (1), 35-52.
INE (2007). Classificação Portuguesa das Actividades Económicas. Lisboa: INE.
Retrieved from https://www.ine.pt/ine_novidades/semin/cae/CAE_REV_3.pdf
INE (2010). Empresas em Portugal 2010. Lisboa: INE. Retrieved from
http://www.ine.pt/xportal/xmain?xpid=INE&xpgid=ine_publicacoes&PUBLIC
ACOESpub_boui=143261137&PUBLICACOESmodo=2
INE (2011). Empresas em Portugal 2011. Lisboa: INE. Retrieved from
https://www.ine.pt/xportal/xmain?xpid=INE&xpgid=ine_publicacoes&PUBLIC
ACOESpub_boui=153408436&PUBLICACOESmodo=2
Iyer, D. N., & Miller, K. D. (2008). Performance feedback, slack, and the timing of
acquisitions. Academy of Management Journal 51 (4), 808-822.
Lant, T. K. 1992. Aspiration level adaptation: An empirical exploration. Management
Science 38, 623–644.
Lant, T. K., & Mezias, S. J. (1992). An organizational learning model of convergence
and reorientation. Organization Science 3, 47–71.
Lant, T. K., & Montgomery, D. B. (1987). Learning from strategic success and failure.
Levinthal, D. A. (1991). Random walks and organizational mortality. Administrative
Science Quarterly, 397-420.
Levinthal, D., & March, J. G. (1981). A model of adaptive organizational search.
Journal of Economic Behavior & Organization 2(4), 307-333.
Lopez-Garcia, P., & Puente, S. (2006). Business demography in Spain: determinants of
firm survival. Banco de Espana Research Paper No. WP-0608.
Mahnke, V. (1998). How do aspiration levels come about?: bounded rationality and
dynamic search. Institut for Industriøkonomi og Virksomhedsstrategi.
March, J. G., & Simon, H. A. (1958). Organizations, Oxford: Wiley.
March, J. G., & Shapira, Z. (1987). Managerial perspectives on risk and risk taking.
Management science 33 (11), 1404-1418.
March, J. G., & Shapira, Z. (1992). Variable risk preferences and the focus of attention.
Psychological review 99 (1), 172.
Mata, F. J., Fuerst, W. L., & Barney, J. B. (1995). Information technology and sustained
competitive advantage: A resource-based analysis. MIS quarterly, 487-505.
Maury, B., & Pajuste, A. (2005). Multiple large shareholders and firm value. Journal of
Banking & Finance29 (7), 1813-1834.
Nieman, G., & Pretorius, M. (2004). Managing growth: A guide for entrepreneurs, Juta
and Company Ltd.
Nohria, N., & Gulati, R. (1996). Is slack good or bad for innovation?. Academy of
Nunes, A., & Sarmento, E. (2010). Survival dynamics in Portugal, a regional
perspective.
Ocasio, W. (1997). Towards an attention-based view of the firm. Psychology, 1,
403-404.
Parrino, R., Kidwell, D. S., & Bates, T. W. (2009). Fundamentals of corporate finance,
John Wiley & Sons.
Roebuck, K. (2012). Predictive Analysis: High-impact Emerging Technology - What
You Need to Know: Definitions, Adoptions, Impact, Benefits, Maturity, Vendors,
Emereo Publishing.
Schendel, D., Patton, G. R., & Riggs, J. (1976). Corporate Turnaround Strategies-Study
of Profit Decline and Recovery. Journal of General Management 3 (3), 3-11.
Schneider, S. L. 1992. Framing and conflict—Aspiration level contingency, the status
quo, and current theories of risky choice. Journal of Experimental Psychology:
Learning, Memory, and Cognition 18, 1040 –1057.
Shepherd, D. A. (2003). Learning from business failure: Propositions of grief recovery
for the self-employed. Academy of Management Review 28 (2), 318-328.
Slatter, S. (1984). Corporate Recoverty: Successful Turnaround Strategies and Their
Implemantation. Strategic Management Journal 7 (1), 99-100.
Stan, C. V., Peng, M. W., & Bruton, G. D. (2014). Slack and the performance of
state-owned enterprises. Asia Pacific Journal of Management 31 (2), 473-495.
Starbuck, W. H. (1992). Learning by Knowledge-Intensive Firms. Journal of
Staw, B. M., Sandelands, L. E., & Dutton, J. E. (1981). Threat rigidity effects in
organizational behavior: A multilevel analysis. Administrative science quarterly,
501-524.
Suarez, F. F., & Utterback, J. M. (1995). Dominant designs and the survival of firms.