M
ASTER
’
S
D
EGREE
D
EVELOPMENT AND
I
NTERNATIONAL
C
OOPERATION
M
ASTER
’
S
F
INAL
W
ORK
D
ISSERTATION
P
OVERTY TRAPS IN
S
OUTHERN
R
URAL
M
OZAMBIQUE
:
A
S
TRUCTURAL
E
QUATIONS
M
ODELLING APPROACH
B
ERNARDO
C
ALDAROLA
D
EVELOPMENT AND
I
NTERNATIONAL
C
OOPERATION
M
ASTER
’
S
F
INAL
W
ORK
D
ISSERTATION
P
OVERTY TRAPS IN
S
OUTHERN
R
URAL
M
OZAMBIQUE
:
A
S
TRUCTURAL
E
QUATIONS
M
ODELLING APPROACH
B
ERNARDO
C
ALDAROLA
S
UPERVISION
:
P
ROF
.
D
R
.
J
OANA
H
ELENA
M
ARIA
F
AJARDO
P
ACHECO
P
EREIRA
L
EITE
P
ROF
.
D
R
.
C
ARLOS
P
ESTANA
B
ARROS
T
RABALHO
F
INAL DE
M
ESTRADO
D
ISSERTAÇÃO
A
RMADILHAS DA
P
OBREZA NO
S
UL DE
M
OÇAMBIQUE
:
UM
E
STUDO DE
C
ASO COM
E
QUAÇÕES
E
STRUTURAIS
B
ERNARDO
C
ALDAROLA
ORIENTAÇÃO:
P
ROF
.
D
R
.
J
OANA
H
ELENA
M
ARIA
F
AJARDO
P
ACHECO
P
EREIRA
L
EITE
P
ROF
.
D
R
.
C
ARLOS
P
ESTANA
B
ARROS
Obrigado, Gracias,
Merci, Grazie,
à Professora Joana, por me ter incentivado e estimulado, por ter sido a primeira “patrocinadora” deste trabalho, e por ter sido a primeira inspiradora não apenas deste trabalho, mas de muito mais;
ao Professor Carlos Barros, por ter me transmitido o seu frenético desejo teórico;
e á professora Ana Sampaio, pelas sugestões, as correções e pelo seu papel impecável de discussant na defesa desta
tese de Mestrado, por ter melhorado notavelmente a qualidade do trabalho após da sua apresentação;
ao Yasser Dadá, por ter me feito descobrir o Pais incrível que é Moçambique, por ter me acompanhado nos meus primeiros passos no mundo da investigação e por ser grande amigo; obrigado também à família dele, que me acolheu em casa como um filho e um irmão, num lar onde sempre me sentirei em casa;
ao professor João Mosca e aos investigadores e amigos do OMR, por me ter aceite nesta grande família, por ter apoiado com grande competência a realização deste trabalho, e por ter enriquecido “manningue” a minha permanência em Moçambique;
à minha família Lisboeta, ao Janos, á Rosa, á Lula e ao Grão – a Adelas family – por ter sido as quatro letras da palavra “casa” nos meses, semanas e dias de vida na linda cidade de Lisboa;
à la professeure Alice Sindzingre, pour m’avoir encouragé – pendant notre seule rencontre dans un café à Paris, et aprés –à participer dans ma première conférence, et pour m’avoir transmis autant de connaissance et motivation dans aussi peu de temps ;
e aos companheiros da turma do ISEG pelas numerosas conversas e oportunidades de aprendizagem juntos.
Alla mia famiglia, a mio padre e mia madre, per l’interesse, l’accompagnamento, la fiducia, gli sforzi e la pazienza, per aver accettato e condiviso ogni mia scelta; a mio fratello, per il costante scambio, spesso acceso, per il confronto
sempre arricchente, per la complicità e la crescita su percorsi paralleli che ogni tanto s’incontrano;
a Inma, mi otra mitad, por ser la mejor compañera de viaje del mundo, por la paciencia, la sensibilidad, el cariño y la fuerza increíbles, y por compartir el mismo camino, por haber empezado a viajar juntos y por estar haciéndolo ahora, por la confianza y los sacrificios, por el amor incondicional;
Y Reyes y Inma, por haberme hecho sentir en casa siempre en estos dos años.
Al cortile sul quale mi affaccio ogni volta che muovo in passo in una direzione diversa, che partecipa in ogni momento della mia vita, per la consapevolezza che i legami vanno molto al di là dei luoghi fisici che li rinchiudono, per
l’amicizia e la fraternità, per gli stimoli e i confronti, per i momenti passati insieme senza i quali non sarei dove sono,
e non andrei dove sto andando;
e alla mia città e alla sua gente, i miei amici, per esserci sempre.
To anyone who offered to me a bed, a talk, a critic, a smile, a shoulder, to those that I’ve met along the way even only for a couple of moments, across the borders of the places where I’ve lived, or just passed through, I want to say, wholeheartedly,
Thank you.
i
INDEX
Index of annexes ... ii
Acronyms ... iii
Abstract and Keywords ... iv
1.
Introduction ... 1
2.
Contextual setting ... 4
2.1.
Poverty and agriculture in Mozambique ... 4
2.2.
Characteristics of the rural sector ... 6
3.
Theoretical framework... 8
3.1.
The neoclassical concept of poverty trap ... 8
3.2.
A deeper look into poverty traps: complexity and multidimensionality ... 10
3.3.
Testing for poverty traps: seeking for an alternative ... 11
4.
Literature review ... 13
4.1.
Health ... 13
4.2.
Market and institutional environment ... 14
4.3.
Food security ... 15
4.4.
Wealth ... 16
5.
Theory and hipotheses ... 18
5.1.
Structural hypotheses ... 18
5.2.
Non-linearity hypothesis ... 19
6.
Methodology ... 21
6.1.
Data ... 21
6.2.
The Structural Equation Model (SEM): an implementation through
Confirmatory Factor Analysis (CFA)... 23
7.
Results and discussion ... 27
7.1.
Confirmatory Factor Analysis: results ... 27
7.2.
Sub-sample estimation: results ... 29
8.
Conclusions, policy implications and final remarks ... 32
References... 35
Annexes ... 40
ii
INDEX OF ANNEXES
Figure 1: Mozambique’s geography
...40
Figure 2: Comparison between the normal accumulation dynamic with accumulation
dynamic under a poverty trap
...41
Figure 3: General theory
...42
Figure 4: Estimation of the Structural Equation Model through CFA on Stata 13
...43
Table I: List of variables and descriptive statistics
...44
Table II: PCA for the creation of an Asset Index
–
components’ values
...46
Table III: SEM / CFA results
...47
Table IV: Sub-sample estimation’s results (poor quartile)
...48
Table V: Sub-
sample estimation’s results (rich quartiles
)
...50
Appendix A: Survey
...52
iii
ACRONYMS
AfDB
–
African Development Bank Group
CD
–
Coefficient of Determination
FDI
–
Forward Direct Investments
AEO
–
African Economic Outlook
CFA
–
Confirmatory Factorial Analysis
FDI
–
Forward Direct Investiments
GOF
–
Goodness-of-fit Index
HDI
–
Human Development Index
IMF
–
International Monetary Fund
INE – Mozambique’s Statistical Institute
MINAGMoz – Mozambique Agricultural Ministry
OECD – Organisation for Economic Co-Operation and Development
OMR – Observatorio do Meio Rural
PCA – Principal Component Analysis
SEM
–
Structural Equation Model
TIA
–
Trabalho de Inquérito Agricola (Agricultural Survey)
WB
–
World Bank
iv
ABSTRACT
This article analyses the rural economy of three districts in southern Mozambique,
proving the existence of a lock-in device that keeps small-scale farmers and their
households into poverty. All variables taken into account result from an original
survey-based dataset which includes socio-economic information about rural livelihoods and the
agricultural sector. A Structural Equation Modelling approach is adopted to detect
non-linearity in wealth creation
– in particular by analysing health, market/institutional
environment and food security in relation to an asset-based measure of wealth. Drawing
upon the concepts of complexity, multidimensionality and cumulative causation, this
work proves the existence of a poverty trap by analysing the varying dynamics related to
the relationship that exists between food security and wealth. The methodology adopted
in this work represents an alternative to the traditional tests usually applied for the
detection of poverty traps, including a wider number of factors in the study of persistent
poverty; finally, it provides some useful policy recommendations regarding the struggle
against poverty in this area.
Keywords
: poverty trap, Mozambique, rural economy, food security, Structural Equation
v
RESUMO
Este trabalho visa analisar o contexto de economia rural em três distritos da região Sul de
Mozambique, para demonstrar a existência de mecanismos “aprisionadores” que detêm
as famílias camponesas numa condição de pobreza. Todas as variáveis tomadas em conta
para o estudo resultam de uma base de dados autoproduzida que inclui informação sobre
a subsistência no contexto rural e o sector agrícola. Este trabalho utiliza a abordagem dos
modelos de equações estruturais (SEM) para detectar as possíveis não-linearidades no
processo de criação de riqueza, em particular a través da análise da saúde, do contexto
institucional e de mercado, e da segurança alimentar em relação à riqueza das famílias.
Recorrendo aos conceitos de complexidade, multidimensionalidade e causação
cumulativa, procura-
se demonstrar a existência de uma “armadilha da pobreza” a partir
da análise das diversas dinâmicas relacionadas com a relação que existe entre segurança
alimentar e bem-estar das famílias inquiridas. A metodologia adotada neste trabalho
constitui uma alternativa aos testes tradicionalmente utilizados na investigação sobre as
armadilhas da pobreza, pois inclui um numero maior de factores na analise da pobreza
persistente. Em conclusão, os resultados da estimação do modelo fornecem algumas
recomendações em termos de politicas de combate contra a pobreza, de acordo com as
características especificas da zona.
Palavras-chave
: armadilhas da pobreza, Moçambique, economia rural, segurança
1
1.
INTRODUCTION
This Master
’s t
hesis consists of an exploratory research in the field of rural
development, with particular attention to poverty dynamics circumscribed to three
relatively poor rural districts in the south of Mozambique. Although Mozambique
experienced a remarkable post-war economic growth, it is still considered a poor country,
with a considerable share of the population living in poor rural areas and striving for
self-subsistence. Despite the huge presence of international donors and several international
financial programs promoted by public and private entities, the problem of poverty
endures, imposing to researchers and policy makers a reflection over policy effectiveness
in the struggle against poverty. In this framework, this work integrates the economic
literature committed to the study of persistent poverty, contributing to the theoretical
formulation of the so-
called “poverty trap”, that is, a lock
-in device that hampers wealth
accumulation, sinking whole communities into poverty.
The questions that this work attempts to answer to are: what makes poverty persistent?
Which factors should be considered in the observation of poverty dynamics? To do so, it
has initially been considered a wide range of neo-classical authors who share as a
common ground the theoretical formulation of the poverty trap mechanism as a non-linear
process influenced by the interference of a factor that hampers accumulation. Empirical
evidence suggests that considering a unique factor as the only cause of poverty restricts
the scope of the analysis, often producing outcomes that are not fully able to explain
poverty, and to correct it by forecasting its future evolutions. For this reason, the
2
complexity and cumulative causation, in an attempt to widen the spectrum of the analysis
of poverty by drawing upon a number of factors that interact continuously following
non-linear paths. This integrated theoretical framework is applied to the study of poverty traps
through the use of a family of multivariate statistical techniques: the Structural Equation
Models (SEM). This set of techniques allows for a simultaneous analysis of correlated
phenomena, providing a powerful tool capable to analyse structural relationships and
correlations that involve several factors at the same time. Data for this study have been
collected during a three-months fieldwork across the rural districts of Chóckwe, Guijá
and Kamavotha, in southern Mozambique. Thanks to the essential support of the
Observatorio do Meio Rural,
a Maputo-based research centre directed by professor João
Mosca, and of its research team, several farmer and peasant households have been
surveyed in order to collect information about their livelihoods (in particular regarding
health, market, institutions, food security and wealth); the information gathered was
included in a database, whose contents provide the
“raw material” that inspired the
present work. This research comes under the project of Applied Advanced Studies in
Development, and benefitted from the support of the Gubelkian foundation and OMR.
This work is organized in 8 sections, of which this introduction is the first one. The
second section illustrates the contextual setting of Mozambique, with particular attention
to poverty and to the agricultural sector; then the third section goes through the existing
literature over poverty traps, drawing upon the neoclassical tradition as well as including
more heterodox concepts, as complexity and cumulative causation, that integrate the
3
the existing scientific literature over health, market / institutional environment and food
security as possible causes of persistent poverty due to their correlation to wealth; the
following section is then dedicated to the formulation of a theory that explains the
existence of a poverty trap, caused by the interaction of the variables chosen and described
in section 4. The sixth section aims to test through a multivariate statistical methodology
the theory enounced in section 5, whose results will be shown and discussed in section 7.
Finally, the last section will include some conclusions and policy implications, proposing
also possible improvements in the approach and methodology adopted, recognising the
4
2. CONTEXTUAL SETTING
The general context in which this work unfolds requires a deep understanding of the
economic feature of Mozambique, in particular of its southern region, Gaza
–
the one
taken in exam. Among its contradictions and inconsistencies, Mozambique shows at the
same time great economic potentialities, due to the huge availability of natural resources
and abundant land, along with sharp inequalities and unexplored possibilities. In the first
paragraph, an overview of the relationship that exists between agriculture and poverty
will be provided, in order to set the boundaries wherein this work sets his analysis. The
second paragraph includes information about the rural sector in the country, to provide
details over the economic and productive features that characterise the rural sector.
2.1 Poverty and agriculture in Mozambique
Despite the skyrocketing economic growth that Mozambique experienced after the end
of the civil war
–
with an average of 7,2% GDP growth in the last decade
–
since 2010
this trend slackened sharply; some of the reasons can be found into the volatile FDI
inflows (mainly related to the exploitation of natural resources), as well as into the
decrease of exports over the last 5 years (also linked to monetary depreciation) and into
the appraisal of escalating political violence and uncertainty
1(AEO, 2015). Furthermore,
despite the increase of per-capita GDP in the last years, severe poverty is still a problem
1 The English reporter Joseph Hanlon, among the most important European journalist active in
Mozambique, reported through his online newsletter “Mozambique news, reports & clippings” a new
5
in Mozambique: according to the Human Development Report (2015), Mozambique is
ranked 180th out of 188 countries included in the HDI, with the 44,1 % of the population
still living in multidimensional poverty, and another 14,8% situated close to the poverty
line; moreover, in recent times Mozambique has been among the largest recipients of food
aid flows (Abdulai
et al
., 2004).
Besides this general picture, official data also show a failure in the struggle against
poverty, with a large share of the population depending only on their own production
(Cunguara and Hanlon, 2010); in addition,
the policies promoted by the Bretton Woods’
Institutions as PARPA (
Plano de Acção para a Redução da Pobreza Absoluta
), despite
their purpose, failed in achieving the goal of poverty reduction by supporting, among the
others, the agricultural sector (Cunguara,
,
2011). In this framework, the reduction of food
exports and the stagnation of productivity reported by national data from the TIA
(MINAGMoz, 2012) are likely to compound the conditions of those households that
depend mostly on what they produce. For instance, several institutions and scholars in
recent times advocated for more rural-centred policies in the country (Mosca, 2015 and
Castel-Branco, 2008) due to the marginalisation of small-scale farmers in the policy
framework.
Consequently,
the agricultural sector’s weight shrunk
noticeably over the last five
years (from 27,6% of the real GDP in 2010 to the 23,9% in 2014, according to the AEO
2015). More importantly, the 99,8% of the farms in Mozambique are family-run, with the
98,6% owning less than 10 hectares of cultivable land: this makes family-run farming
small-6
scale farmers are responsible alone for almost the totality of the food security of more
than 25 million of people, a number doomed to increase in the next years, if we watch to
the most recent demographic trends.
2.2 Characteristics of the rural sector
Despite land abundancy, the agricultural sector in Mozambique shows an extremely
low degree of modernization, along with low productivity; moreover, land availability is
often invalidated by land-grabs and resettlements imposed by multinational companies
with strong economic interests in the region (Locke, 2014). For instance, the average land
worked per farmer decreased to 1,4 ha in 2012, showing a 22% loss since 2005
(MINAGMoz, 2012)
2. Furthermore, most of the cultivated land is rain-fed, while
irrigation is concentrated in the southern region with 60% of the irrigated land allocated
to sugarcane plantations. On the production side, farmers only use basic inputs, as
non-augmented seed, making little use of fertilisers; the low level of mechanisation obliges
the farmers to hire seasonal workers, or to rely on the mutual help offered by other farmers
from the same association they belong to
3. The most common agricultural products grown
by the small-scale farmers are corn (37% of the total cultivated land in the country), beans,
but also rice, cassava and fresh vegetables (MINAGMoz, 2012). However, for this
research I will not consider the totality of the national cultivations; the analysis is
2 I will henceforth may refer to small family-run cultivations with the Swahili term “machamba”, widely
used in the whole country.
3 For a more comprehensive work on the farmers’ associations in Mozambique, please see Júnior et al.
7
circumscribed to only three southern districts that can be considered representative of the
different characteristics of the rural sector across the country:
i. Chockwe, in the southern province of Gaza, is traditionally acknowledged as an historical agricultural productive hub, with a high presence of agricultural inputs,
with prevailing medium and large exploitations;
ii. Guija, again in the South, is an area whose agricultural production is mostly addressed to food markets, with a low presence of agricultural inputs. Exploitations’
size varies between 0,5 ha / 2 ha;
iii. Kamavotha, or the Maputo surroundings (Cintura de Maputo), is the closest rural area to the capital city. It is a district whereby the production is almost only addressed
to internal markets, and is characterised by the intense use of productive inputs, and
by the proximity of producers to the intermediate input market. Nevertheless, land is
exploited only in small scale.
The three areas considered for this study are geographically displayed in Figure 1. The
differences in consumption, production and land distribution of these three districts enrich the
study of rural poverty in an area that, especially in the colonial period, represented the most
important staple food productive hub in the country (Mosca, 2005), today facing severe conditions
8
3. THEORETICAL FRAMEWORK
This section consists of an overview of the theoretical framework that underpins the hypothesis
tested in this work, that is, the existence of a trapping mechanism that forces three southern rural
districts of Mozambique into persistent poverty. For instance, we will review the literature
pertaining to the “block” of political economy, to define the concept of poverty trap; likewise, we
will consider the stream of authors that attempted to formalise mathematically the concept of
poverty trap in a more rigorous way. Therefore, we will consider poverty as a multidimensional
phenomenon, making the existing formalisation of poverty traps – that is often considered the
result of a too reduced set of factors – much wider and inclusive.
The first paragraph of this section illustrates the mainstream formalisation of the concept of
poverty traps, providing the basic tools to understand this theoretical formulation and its empirical
implications into the reality; the second paragraph proposes a wider and more heterodox view of
poverty traps, drawing upon the concepts of complexity and multidimensionality. The third and
last paragraph goes through the existing tests to detect poverty traps, and proposes a new approach
based on a wider panoramic of this phenomenon.
3.1 The neoclassical concept of poverty trap
In political economy, the concepts of coordination and cooperation are part of the basic
elements of the earliest development economics (Nurkse, 1953; Leibenstein, 1957; Myrdal, 1957;
Hirschman, 1958). They have been introduced by the first “structuralist” thinkers, as
Rosenstein-Rodan (1943) who explained the existence of inefficient equilibria that trapped countries in
underdevelopment, adducing as a cause of such inefficiency the presence of inter-sectoral
spill-overs. This highlights the importance of coordination between different sectors in the promotion
9
advent of the Washington Consensus (Williamson, 1993), these concepts were eclipsed by the
blind (and strictly neoliberal) faith in the total deliverance of the market forces; according to this
approach, the market should be left to work alone as the only engine for a more efficient economy,
denying the need of a coordinating agent (Krueger, 1990; Lal, 1985). Almost a decade later, with
the first undeniable failures of the IMF and WB driven policies, coordination and cooperation
were reconsidered and deepened in their theoretical formulation, first by the adepts of institutional
economics, to mention one among the others the founder of this new vague Douglass North, who
focused on the role of institutions in promoting development through policies and State
intervention (North, 1991), and later by other authors who highlighted how bad institutions and
social norms could trap people into poverty (Sindzingre, 2007).
If we aim to define briefly this concept, a poverty trap can be seen as a self-enforcing
mechanism whereby countries – or households and individuals – start poor and remain poor; in
few words, a poverty trap occurs when it is present poverty to beget future poverty itself
(Azariadis & Stachurski, 2005). Therefore, a poverty trap is a mechanism that can bring about a
condition of persistent or chronic poverty. Often in the literature, these mechanisms are
categorised according to weather they are characterised by single or multiple inefficient economic
equilibria; in both cases, starting conditions and the structural features of a country/household are
very important in the determination of a poverty trap, as well as the concept of threshold (Barret
& Carter, 2013). The most widely used concept in the neoclassical economic literature is the
multiple equilibria poverty trap (Acemoglu et al., 2001; Banerjee & Duflo, 2011; Dasgupta, 1997;
Dasgupta & Ray, 1986; Moser & Barrett, 2006; Murphy, Schleifer & Vishny, 1989;
Rosenstain-Rodan, 1943) whose graphical formalisation can be represented as in Figure 2. The S-shaped red
curve describes a situation affected to a poverty trap, compared to another (the blue traditional
10
dynamics. On the left side of the intersection between the 45º axis and the S-shaped curve, that
is, before the threshold point of wealth below which households experience a poverty trap, the
curve has a negative first derivative; this situation corresponds to diminishing returns, a concept
which is deemed particularly relevant in the analysis of farms’ production (Samuelson, 2001).
The formalisation obtained through the phase diagram in Figure 2 describes a situation in which,
to a given level of wealth in the moment t, corresponds an even lower level of wealth in the
moment t+1 due to a factor that generates a non-convexity in the accumulation dynamics
(Mas-Colell, 1987); better said, it generates a poverty trap. Authors that are opting for this formulation
to describe persistent poverty often rely on a single factor causing poverty traps, that can be
identified in insufficient savings, food insecurity, market failures, etc. (Kraay & McKenzie,
2014). Furthermore, this formulation often justifies one-time interventions as needed actions to
lift the poor above the threshold detected (Sachs, 2005), which often proved to be rather
ineffective (Barret & Carter, 2015).
3.2 A deeper look into poverty traps: complexity and multidimensionality
Despite its elegant and smooth formalisation, the concept of poverty trap often falls short in
taking in consideration the wide number of factors that could be at the base of a non-linearity in
wealth accumulation, especially at the micro level. According to Arthur (1989; 1994) the
economy, as well as households’ wealth trajectories, can get locked into inefficient paths due to
positive feedbacks and increasing returns, that might cause multiple equilibria in the same
economic context. These phenomena are caused by random and relatively small events that, under
specific conditions, will end up pushing the economy towards one or more inefficient equilibria,
bringing about a self-enforcing mechanism that prevents the economy to shake free from the
stochastic consequences of a random small event. Following the hints emerging from the
11
it is meaningless to ascribe to a single factor or variable the origin of a trapping mechanism: the
path follows a certain trajectory pushed by forces that are often difficult to detect and to be
formally defined; even if they begin from the same starting point, different economies can end up
in completely different stationary states, covering divergent paths (Pritchett, 1997).
Therefore, the formulation proposed in this work considers the trapping process as a complex
outcome of cumulative causation between more than one or two factors, in a number that varies
according to each situation; the aim is to expand the neoclassical formalisation providing
empirical evidence of the fact that several factors could be relevant in bringing about a lock-in
device such as a poverty trap is. For instance, the characterisation of the nature of the poverty
trap, and the identification of its causing factors are fundamental to set up an exit strategy (Kraay
& McKenzie, 2014), revealing the insufficiency of one-time interventions and justifying a more
specific intervention to tackle persistent poverty more effectively. For this reason, both
intervention and theoretical formulation require a multidimensional approach to poverty, entailing
the deprivation of capabilities (e.g. stemming from bad health) and the external environment (e.g.
institutions and markets) as constitutive and non-excludable elements of the analysis of persistent
poverty (Sindzingre, 2005).
3.3 Testing for poverty traps: seeking for an alternative
Besides the problematic theoretical formulations, poverty traps also present challenges when
testing4 for them on empirical data. Most of the problems are related to one of their basic features,
that is, the presence of multiple equilibria; they are not always detectable, and a negative test does
not automatically imply that we are not in front of a multiple equilibria poverty trap (Barret and
4 Most common tests for poverty traps can be found in the works of Antman and McKenzie (2007), Loshkin
12
Carter, 2013). On the other hand, the patterns in data that could bear a multiple equilibria
hypothesis can be consistent also with other hypotheses, making the detection of a poverty trap
much more difficult (Rodriguez, 2008). In this framework, this work proposes an alternative to
general testing of poverty traps, contemplating the notions of complexity and
multidimensionality. By considering a complex system, we will not seek for an economic
equilibrium condition before attempting to detect a poverty trap; given the stochastic and dynamic
nature of the economic paths (Arthur, 1989), the notion of equilibrium becomes irrelevant, giving
scope for a more meaningful non-equilibrium analysis. Instead of assuming that the economy
tends toward a steady state, we assume that its path is dynamic and continuously evolving,
reacting to several factors, and that under some specific conditions it can be “trap” people into
poverty. The innovative feature of this kind of tests is to consider a complex system with a set of
elements adapting or reacting to the pattern created by the elements themselves (Arthur, 2013).
As a final remark, it is worth mentioning that since the original database used for this study is
cross-sectional and not longitudinal, we will accomplish the task of testing for the presence of a
poverty trap by describing a set of conditions that can be at the base of a poverty trap, as a picture
13
4. LITERATURE REVIEW
Before proceeding to the statistical test, following the principles mentioned in the last
paragraph of the former section, it is necessary to select a number of factors capable to explain
the mechanisms leading to the creation of a self-enforcing mechanism, like a poverty trap. Since
the multivariate technique chosen for testing (SEM) relies on the relationship between latent
variables5, we will treat the factors as such, each factor stemming from a different set of observed
variables. The observed independent variables, properly grouped, result into a latent variable, that
is, a common latent factor capable to explain at the same time the whole set of independent
variables chosen in the model (Borsboom, 2008). This section is divided in 4 paragraphs, one
dedicated to each factor: health, market/institutional environment, food security and wealth; the
section goes through the existing literature drawing upon previous research regarding the
above-mentioned factors and their relationship with persistent poverty. Although we will mention each
factor separately in the following paragraphs, the methodology adopted for this research work
takes all the latent variables in account simultaneously. Detailed information about the variables
and descriptive statistics can be found in Table I. The four factors have been chosen according to
their relevance for the rural livelihoods in rural southern Mozambique (Mosca, 2015), as well as
to their observability.
4.1 Health
Intuitively, poor health is likely to translate into poor livelihoods; if we look at insightful
previous research, it appears undeniable the existence of a strong relationship between health and
poverty, with very bad health conditions as a possible cause of trapping mechanisms (Sachs, 2001;
Nyakato & Pelupessy, 2011). Due to the limits imposed by data availability on health conditions,
14
and to the low reliability of some of them (like AIDS, sexual diseases and recurring children
diseases) only data about malaria have been used to define this latent construct. Malaria is a rather
good proxy measure for health in contexts like poor rural Mozambique; many authors consider it
a “poverty disease” (Gallup & Sachs, 2001), with causality between poverty and malaria working
in both ways (Teklehaimanot & Meija, 2008). The set of explicative variables making up this
construct are: rate of usage of mosquito nets, rate of the incidence of malaria (in this case I
considered the percentage of people that did not contract malaria) and rate of repellents’ usage.
The explicative variables chosen are expected to be positively correlated to the latent factor.
Furthermore, they are consistent with the usage of an asset based poverty measurement (that will
be described in the last paragraph of this section), although self-reported health data might result
not fully reliable (Somi et al., 2008).
4.2 Market and Institutional Environment
A market-based poverty trap is described in an insightful theoretical paper from Barret and
Carter (2013), in which the authors demonstrate that a poverty trap may be originated by multiple
financial market failures; likewise, exclusionary political institutions can be the at the base of
persistent poverty, since they can settle permanently inefficient dynamics and social norms
(Bowles, 2006). These two elements are considered simultaneously as a part of the same latent
variable; for instance, we assume that high transactional costs are a result of market inefficiencies,
or failures, and that at the same time the weak state support contributes to increase the fixed costs
for the small producers, contributing to the exclusion and marginalisation of the rural population.
As environmental factors, market and institutions – if not properly working – can become the
cause of a mechanism that can trap entire regions into poverty. In order to measure this construct,
we will consider: the level of state support (calculated as a summated scale of the number of
15
commercialisation network (measured by the distance to which the producers manage to sell their
products) and the degree of market development (calculated as a summated scale of a number of
different factors related to the efficiency of the market, explained in detail in Table I).
4.3 Food security
The concept of food security plays a pivotal role in the formation of the general theory to be
tested in this work, since it is assumed as an ex-ante status with respect to health as well as markets
must complement with governments in creating a food secure environment (Barrett, 2005). It is
also considered strictly correlated to the wealth of rural households, since almost the totality of
the households surveyed are tightly depending on their own food production, regardless weather
they produce enough to sell the exceeding production or not. Therefore, a low level of wealth for
food insecure smallholders’ households is expected. As to Barret (2005), food security can be
defined as the “access by all people at all time to enough and appropriate food to provide the
energy and nutrients needed to maintain an active and healthy life”. It is therefore an ex-ante
status, with respect to a set of conditions in each moment of time, according to which we can
define an individual, household or country vulnerable for a lack of food security; this way of
conceiving food security as a “static” factor is suitable both for the latent-variable approach
adopted in this work, and for the use of cross-sectional data, since they do not enable the
observation of data over time. Moreover, the use of disaggregated data about food security helps
to provide a deeper insight on each household or group, as highlighted by Popkin (1981) and
McLean (1987). Therefore, poverty is treated as an ex-post outcome of food security, also directly
correlated to wealth – as in the theoretical model that we will test ahead. In conclusion, food
insecurity (ex-ante) causes poverty (ex-post). In synthesis, poorer households will be less food
secure, and then even poorer, further reducing food security, and so on, bringing about a loop that
16
Considering also the level of self-sufficiency as a determinant of food security, we chose the
following observed variables to build this third construct are: total land owned, diversification in
consumption, diversification in production, availability of food over the year, and finally, wealth
– measured as an “asset index”, and to which is dedicated the next paragraph.
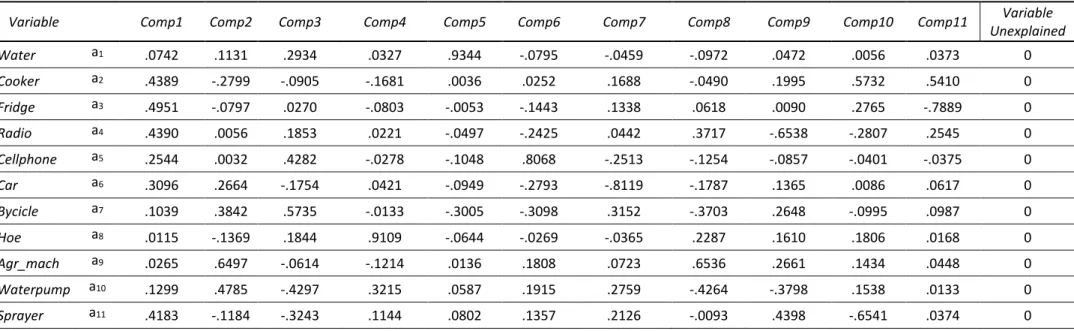
4.4 Wealth
Differently from the three previous constructs, the concept of “Wealth” is represented by an
observed variable, working as a dependent endogenous variable in the theory that will be tested.
Wealth is quantified by an asset-based index, that is, a non-money-metric measure (Carter &
Barret, 2006) that allows to circumvent any problem stemming from the arduous disclosure of
income-related information. This kind of measure has already been used to study welfare
dynamics in Mozambique (Giesbert and Schindler, 2012), with quite satisfactory results; this
observed dependent variable – that we will call also “Asset Index” – has been built weighting and
summating both domestic and productive goods, as indicated in Table I and Table II; the
summated scale of the weighted number of goods owned for each category corresponds to the
asset index. The parameter applied to weight the ownership of the goods included into the index
have been calculated with a multivariate technique called Principal Component Analysis (PCA)6
(Filmer & Pritchett, 2001; UNDESA, 2005); according to the methodology adopted in the
literature considered for this work, the parameters reflect the relevance of each good in the
determination of the final value of the index7. PCA is a widespread technique, often adopted to
create asset indexes from continuous variables (Booysen et al., 2005), as in the case of the data
6 Details about the methodology applied to obtain the asset index are enclosed in appendix B. PCA results
are included in the same appendix, in Table II.
7 For a more comprehensive discussion about the various techniques that can be adopted for the creation of
17
used in the variables that measure the concept of “Wealth” in this work. The assent index is
therefore used as a proxy of households’ well-being, providing a more accurate measure if we
compare it to consumption and income data, which are often biased by several environmental and
exogenous factors (Sahn & Stiefel, 2000). The higher the value of the index, the better the wealth
conditions of the household which the value refers to. As a dependent variable in the model, the
asset index is the key point of the relationship that exists between the latent variables, from which
we mean to obtain information about non-equilibrium wealth dynamics, as we will see in the
following section. By measuring the intensity of the relationship between the asset index and the
three latent variables (Health, Market & Institutional Environment and Food Security), and then
analysing the variations occurring in this complex relationship for different levels of wealth, we
can provide some useful information to describe the non-linarites in which could be found the
roots of persistent poverty. In conclusion, the purpose of the theory exposed in the following
chapter is to statistically validate the multifactorial nature of poverty in this area, and then to
validate the same structure for different levels of wealth, with the purpose of detecting any
18
5. THEORY AND HYPOTHESES
After having defined both the latent constructs considered to test for poverty traps, with their
respective explicative observed variables, the following step is to set up the statistical test to
validate the theory by which we presume the existence of a poverty trap in the three rural districts
of Chóckwe, Guijá and Kamavotha. Before going more into the methodology adopted, it is
necessary to establish a set of theoretical hypotheses that, if confirmed, would reveal the
possibility of the existence of a poverty trap. If all the following hypotheses hold after being
tested, the general theory (that is, the existence of a poverty trap in the context taken in exam)
will be verified. The hypotheses that make up this theory are categorised in two groups: the first
group, the set of structural hypotheses, aims to test the multifactorial structure of poverty through
a Confirmatory Factor Analysis (CFA), which is a specific configuration of SEM techniques; the
last hypothesis, that alone represents the second group, involves the validation of the
multifactorial structure of poverty tested by the first group of hypotheses, and aims to detect the
supposed non-linearity of wealth creation by analysing the variations in the parameters that
describe the relationships involving the measurement of wealth.
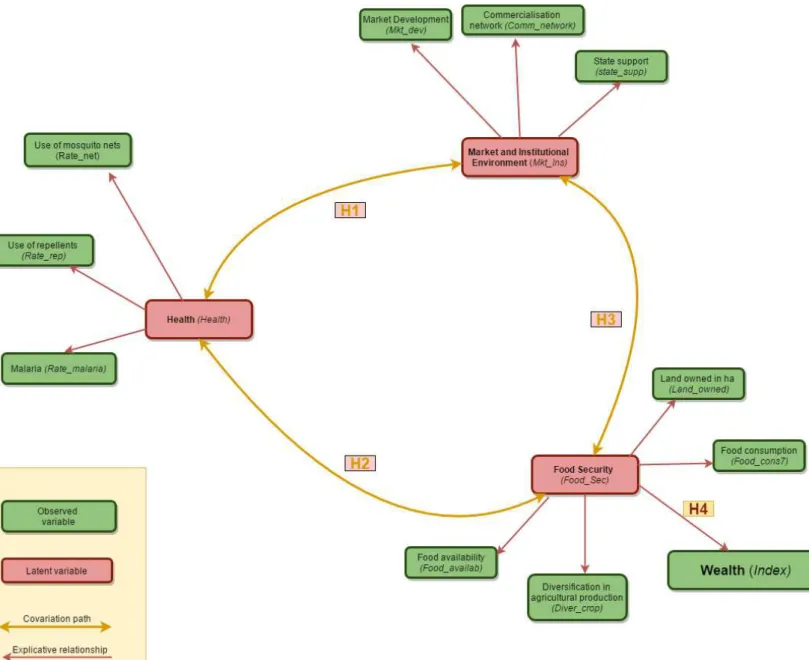
5.1. Structural hypotheses
H1: Health (Health) is positively and significantly correlated to Market and Institutional
Environment (Mkt_Inst);
H2: Health (Health) is positively and significantly correlated to Food Security (Food_sec);
H3: Market and Institutional Environment (Mkt_Inst) is positively and significantly correlated to
Food Security (Food_Sec);
Testing this group of hypotheses represents the first step of theory validation. We assume that the
19
and if it is found statistically significant, the model can be considered coherent, since the latent
variables will be proved able to explain enough of the variability of the data on which we have
run our statistical technique, the Confirmatory Factorial Analysis (CFA) (Hair et al., 2014). These
hypotheses are consistent with the notion of complexity mentioned in the theoretical framework:
they implicitly assume that all the latent variables are correlated to each other, involving more
than one factor in the examination of poverty causation, and verifying the consistency and the
statistical soundness of a multidimensional idea of poverty. If the poverty trap will be detected
(after the verification of the next group of hypotheses), all the factors considered in the model
will be involved in the mechanism that locks the economy into poverty, overtaking the
“mainstream” theory according to which poverty traps are originated by a unique factor, as
described in section 3.1. A graphical formulation of this hypothesis is displayed in Figure 3. If
these hypotheses hold, proving to be statistically significant, the terrain to test for non-linearity
will be ready.
5.2. Non-linearity hypothesis
H4: Food security (Food_sec) has a different effect on Wealth (Index) according to the different
levels of income observed in the sample.
Since in this work we propose an innovative testing process that does not involve the research of
a steady state, opting for a equilibrium detection of persistent poverty, we consider
non-linearity as an outcome of the conditions characterising each household. More precisely, with the
structural hypotheses verified, the same multivariate technique can be run over two different
partitions of the data available (the poorest quartile and the three richest quartiles) in order to
observe a difference in the relationship among the variables, i.e., if there is a discrepancy in the
intensity of the correlation between the latent variable (Food_sec) that explains the dependent
20
for the detection of a mechanism that might be locking the economy into an inefficient path,
preventing the take-off of the economy. This last step will also serve as a validation of the whole
model. Figure 3 provides the general overview of these two groups of hypotheses, forming the
21
6. METHODOLOGY
This section will focus on the methodology adopted to test the theory described in the former
sections of this work; for this purpose, the first part of the section will be consecrated to the
description of the original database that allows to empirically test the underpinning theory of this
work, whereas the second part will briefly describe the multivariate analysis technique used to
analyse the relation between the variables chosen for the study: the Structural Equation Model.
6.1 Data
The data used in this work consists of the outcome of a survey made up of closed questions,
submitted to machamba-owning families in three southern districts of Mozambique; inquiry and
survey8 submission have been carried out in 2015, between July and September. Surveys have
been validated basing on the clarity of the given responses; hesitant and uncertain responses have
not been considered. Furthermore, observation with incomplete answers where not deleted from
the database; the missing data have been imputed following the all-available approach, or
pairwise9approach(Hair et al., 2014). Considering all the limitations imposed by this kind of fieldwork, as well as the low quality of official population data, we obtained the sample using a
random and not systematic method, applying a post-sampling methodology that will be explained
in detail ahead in this section. For each of the areas taken in exam, more than 400 individuals
have been surveyed, in representation of their own household – the unit of analysis of this
research. This process resulted in a database made of 1200 valid observations, amid the totality
of households surveyed. Nevertheless, before the estimation, all the observations for each variable
have been weighted using as a sample weight variable the masculinity rate inside each household,
8 Survey can be found in appendix A
9 Hair et al. (2014) recommend this approach for cases in which missing data do not exceed the 10% of the
22
compared to the regional population gender rate (population data from INE, 2015). This operation
allows to attribute a loading to all the values in the dataset, in order to make the sample more
representative of the whole regional population, leading to a much more reliable and accurate
result (Hahs-Vaughn & Lomax, 2006). Furthermore, a stratification variable based on the original
district of each household is adopted, creating mutually exclusive and internally homogeneous
subgroups, that allow for a lower standard error in the estimation. Both stratification and
weighting are applied through the survey data option made available by the statistical package.
Surveys have been randomly submitted directly in the machambas, with the support of some
representatives of the most important Mozambican farmers’ association, the UNAC (União
Nacional dos Agricultores e Camponeses –National Union of Peasants and Farmers), that joins together a considerable number of smaller farmers’ associations. Altogether, the research group
that conducted the fieldwork beneficiated from the support of a team of five surveyors provided
by the OMR; local surveyors were also recruited in each district, in a number decided on a weekly
base according to the number of people to be inquired foreseen for each day of work. Nonetheless,
the influence of measurement error merely due to the data gathering method must be taken in
account. The collection of data obeyed to the criteria of the highest relevance of the variables
considered for the study of poverty; the surveys have been submitted to farmers (in representation
of the whole household) in the three southern districts, as mentioned in paragraph 2.2 of this work.
The database resulting of the above-mentioned data-gathering process contains the rough
information that, properly elaborated, enables the identification of the nature and strength of the
relationship among latent variables, providing information about the mechanism that is supposed
to be at the origin of persistent poverty in these rural areas. The cross-sectional database thus
obtained, despite the several limitations imposed by this kind of data, allows the researcher to
23
inference basing on the evolution of observed data over time, cross-sectional data allow to make
an ex-ante assessment, providing a picture of the state of a conjoint of variables in a specific
moment of time (Chaudhuri et al., 2002). Variables regarding demographic, social, and economic
features of the rural livelihoods entail all the aspects relevant for the analysis of persistent poverty.
The variables observed will be properly grouped, forming the latent variables that represent the
three constructs described in chapter The three latent variables are directly unobservable, but at
the same time they are determined by the data available in the dataset. Therefore, the correlation
relationship between the latent variables, as well as the way in which they interact, represents the
backbone for the testing strategy implemented through the SEM technique.
6.2 The Structural Equation Model (SEM): an implementation through Confirmatory Factor Analysis (CFA)
According to Hair et al. (2014), Structural Equation Modelling (SEM) is a family of statistical
models that aims to explain the relationships among multiple variables. SEM is increasingly
gaining popularity in a wide range of research disciplines, mostly because of its capability to
analyse complex relationships among latent variables (Grace, 2006). In the specific case of
poverty, SEM provides insightful information regarding the several determinants and dimensions
of poverty (Ningaye et al., 2013), not measuring poverty with a unique indicator – regardless the
dimension or set of dimensions it might refer to – but measuring the intensity and describing the
nature of the relationship between the factors that create a situation of chronic poverty. One of
the reasons of the increasing adoption of SEM in empirical research is the fact that, like other
multivariate techniques, it reduces the number of observed variables grouping them into latent
constructs, the interaction among which represents the general model. Furthermore, comparing to
other techniques that do basically the same, SEM allows for a much smaller measurement error
24
represent which independent observed values, and not the statistical tool, as occurs for example
with Exploratory Factor Analysis (Walker et al., 2009). On the other hand, this advantage
translates into the necessity of a strong theory behind the statistical model; the face validity of
each construct requires each latent variable to be underpinned by several strong theoretical
assumptions already proved by previous research (Hair et al.,2014). However, since the model
relies on the use of latent variables, it is obviously not immune from further measurement error;
in fact, inference conducted with latent variables has a much lower degree of certainty than any
estimation run on observed data (Borsboom, 2008); moreover, a construct can be theoretically
inconsistent or weak, so that the related observed variables might be not fully able to explain the
construct, originating a biased or non-explicative latent variable.
The SEM configuration that fits the best to the data and to the theory to be tested is represented
by Confirmatory Factor Analysis (CFA); this technique allows to assess the validity of a set of
constructs, set up by the researcher before the data gathering. In CFA, all the latent variables
chosen by the researcher work as measurement components, and are supposed to covariate
saturating the model10 (although it is important to remark that covariation does not correspond to
causation). The measurement model thus obtained undergoes goodness-of-fit tests, as we will see
in the next section. If the result of this assessment is satisfactory,
Therefore, this approach involves on hand the assessment of both the validity and the reliability
of the latent variables; on the other, it is an analysis of the accuracy and the significance of the
covariation relationships existing between the constructs. By analysing the parameters estimated
both for the relationship that exist between the observed and latent variable, and those estimated
10 For “model saturation” it is meant that all the constructs covariate among them, reaching the maximum
25
for the correlation between latent variables, the model provides information about the
multidimensional structure of poverty, resulting from the interpretation of the parameters
estimated through CFA. This first part of the model estimation will be used to test the first three
hypotheses of the theory articulated in chapter 5.
The second step of the estimation process is carried out by running the same CFA model
(keeping unchanged the paths and relationships showed in Figure 3) upon two different partitions
of the dataset, more specifically on two sub-samples corresponding to the poorest quartile and to
the three richest quartiles. If these two new estimations are capable to keep the explanatory
capability of the previous estimation, the model will be validated. But more importantly, any
potential differences in the standardised parameters resulting from the new estimation over the
two sub-samples can provide useful information about the dynamics of poverty in the model,
especially detecting non-linarities in the creation of wealth, as we will see in the next section.
Despite the limits resulting from the use of cross-sectional data, that often are not sufficient to
go beyond the mere description of a phenomenon (Dasgupta, 2009), SEM allows also to explain
the nature of the phenomenon analysed estimating the magnitude of the relationship between
latent constructs, providing us with a powerful theory-testing tool. The theory tested through the
CFA approach is said reflective (it is always the latent variables to explain the observed ones),
while the model arrangement is congeneric, that means that each independent variable is
associated to only one latent variable (absence of cross-loadings of the same observed variables
explained by more than one latent variable). Furthermore, a cogeneric model foresees that the
error terms related to the observed variables from the same construct are not correlated to each
other, neither they are correlated with error terms of variables that refer to another construct: this
26
chosen is the Maximum Likelihood with Missing Values (MLMV)11 (Enders & Peugh, 2004),
widely used for Structural Equation Models; this involves a powerful tool that provides an
unbiased estimation compared to other techniques, particularly concerning non-normality issues
(Olsson et al., 2000) and provides acceptable estimations also in presence of missing values in
the observations, if they less than the 10% of the complete data available (Savalei, 2008).
Confidence interval has been set at 95%.
27
7. RESULTS AND DISCUSSION
After passing through the methodology adopted to test our theory, we finally discuss the results
of the CFA estimations, to validate the two sets of hypotheses that make up the theory that
undergoes the statistical test performed by CFA. The main goal of the estimations is firstly to
affirm the coherence of the measurement components; the outcome of the estimation entails
relevant information about the nature of poverty in rural poverty, especially regarding the
relationship between food security (Food_Sec) and wealth, in a dynamic system in which all the
aspects of rural life related are correlated to each other. All the parameters and covariance values
in the following paragraphs will be shown in their standardised values, in order to ease
comparability.
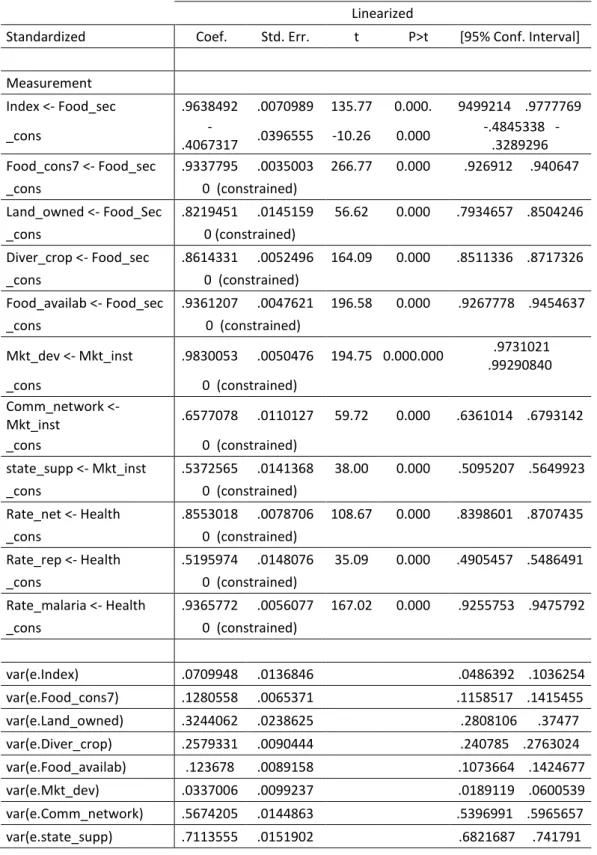
7.1 Confirmatory Factor Analysis: results
The descriptive statistics of the observed variables can be consulted in Table I, whereas the
results of the CFA estimation are graphically shown in Figure 4, and displayed more in detail in
Table III. The measurement model describes the relationships between the latent variables and
their respective observed variables, as well as the correlations supposed to exist between the three
latent constructs (Von-Gaeddert & Oerther, 2014); since the survey data option adopted by the
statistical package does not allow for the use of more classical and widespread absolute
goodness-of-fit (GoF) indexes, as the Chi-square (χ ) absolute GoF Index (Bollen et al., 2013), the only
class of indexes that can be used to assess the overall quality and explicative power of the model
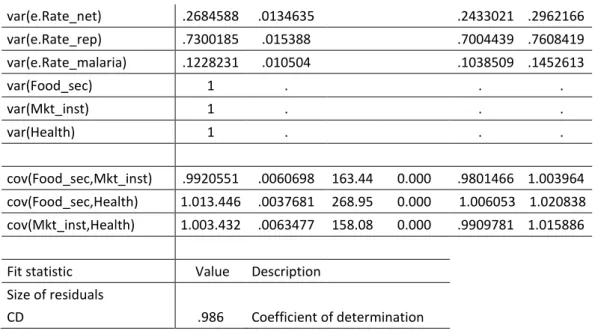
are those based on the residuals of the estimation. For instance, Stata 13 permits to estimate the
Multivariate Coefficient of Determination (CD), an index whose characteristics can be compared
to the classical coefficient of determination (R2) often used to assess linear regressions’ goodness
-of-fit; the CD evaluates the proportion of generalized variance in a set of latent variables explained
28
CFA estimation is close to 1 (0.986), we can consider the measurement model’s overall fit and
variance explained rather satisfactory.
With respect to the individual parameters estimated through CFA corresponding to the
regression coefficient between the observed variable and the latent construct, normally the
loadings are considered acceptable only if their standardised values range between -1 and 1, with
p-value12<0.05; it is often recommended to re-specify the model if some of the parameters
associated to any latent-observed variable relationship has a value lower than 0.7, as it happens
only three of the independent variables of our model (Comm_network, 0.65; State_supp, 0.54;
Rate_rep, 0.50). However, since these values are still higher than 0.5 they can be considered still
statistically relevant (Hair et al., 2014). Furthermore, they are in line with the reality examined:
for instance, if we consider the context of a “traditional” economy characterised by informality –
not necessarily corresponding to a non-market economy as it is shown by Sindzingre (2004) – we
can expect a reduced influence of formal commercialisation networks in the creation of wealth,
since the largest part of the production is addressed to self-subsistence rather than to the markets.
Regarding the role of the support from the State, its low relevance can be imputed to the flawed
governmental policy inefficiencies, in what concerns the struggle against poverty as well as the
assistance addressed to rural land smallholders and farmers’ associations in general. Overall,
loadings that determine the latent variables chosen show satisfactory values, the strongest
pertaining to food security that appears as the best-explained latent variable in the model. On the
other hand, also the parameters that indicate the degree of correlation between the latent variables
(curved double-headed arrows in Figure 4) are proved to be statistically significant, with values
that suggest the consistency of the relationship between the constructs that represent Health,
12 P-values are determined by the confidence interval, that in this case has been set at 95%; consequently,
29
Market & Institutional Environment and Food Security. However, the presence of these
correlations does not imply the idea of causation between the constructs, but it exclusively counts
for the mutual influence that exist between the three latent variables, demonstrating that the three
factors must be considered simultaneously in the analysis of poverty and wealth creation.
In conclusion, the estimation of the measurement model by CFA confirms the set of structural
hypotheses, that is, it validates the internal consistency of each latent variable given the
significance of the parameters that link the latent variable with the respective observed variable
(conceptual coherence has already been theoretically verified by relying of previous research to
make up the constructs), and above all, it confirms the correlation that exist between the three
latent variables, that validates the three-dimensional nature of poverty in the context analysed.
7.2 Sub-sample estimation: results
By estimating the measurement model in the former paragraph, it has been confirmed the
relationship between the latent variables, as well as the soundness of the coefficient attributed to
the relationship between each construct and the respective observed variables, thus validating the
first set of structural hypotheses enounced in section 5. However, to provide a more insightful
overview about poverty dynamics, and to be enabled to make any kind of supposition over the
possible causes of persistent poverty among the small-scale farmers’ households in the rural areas
analysed, we must validate also the last hypothesis (H4) that supposes the presence of
non-linearity in the process of wealth creation, that is, a poverty trap. To this aim, the same CFA
estimation needs to be conducted over two different sub-samples, in order to appreciate potential
changes according to the level of wealth (or poverty) of each household. To do so, the sample has
been split into quartiles, basing on the variable Index; the lowest quartile (households with an
asset index below the value corresponding to the first quartile, corresponding to the value 0.4143)