Predicting reduced TLC in patients with low FVC
and a normal or elevated FEV
1/FVC ratio*
,**
Predizendo redução da CPT em pacientes com CVF reduzida e relação VEF1/CVF normal ou elevada
Luiz Carlos D’Aquino, Sílvia Carla Sousa Rodrigues, João Adriano de Barros, Adalberto Sperb Rubin, Nelson Augusto Rosário Filho, Carlos Alberto de Castro Pereira
Abstract
Objective: To use clinical and spirometry findings in order to distinguish between the restrictive and nonspecific patterns of pulmonary function test results in patients with low FVC and a normal or elevated FEV1/FVC ratio. Methods: We analyzed the pulmonary function test results of 211 adult patients submitted to spirometry and lung volume measurements. We used the clinical diagnosis at the time spirometry was ordered, together with various functional data, in order to distinguish between patients presenting with a “true” restrictive pattern (reduced TLC) and those presenting with a nonspecific pattern (normal TLC). Results: In the study sample, TLC was reduced in 144 cases and was within the normal range in 67. The most common causes of a nonspecific pattern were obstructive disorders, congestive heart failure, obesity, bronchiolitis, interstitial diseases, and neuromuscular disorders. In patients given a working diagnosis of pulmonary fibrosis, pleural disease, or chest wall disease, the positive predictive value (PPV) for restriction was ≥ 90%. In males, an FVC ≤ 60% of predicted had a PPV for restriction of 98.8%. In females, the restrictive pattern was found in 84.4% of those with an FVC ≤ 50% of predicted. A difference of ≥ 0% between the FEV1% and the FVC% had a PPV for restriction of 89.5%. After
performing logistic regression, we developed a point scale for predicting the restrictive pattern. Conclusions: In many patients with reduced FEV1, reduced FVC, and a normal FEV1/FVC ratio, the restrictive pattern can be
identified with confidence through the use of an algorithm that takes the clinical diagnosis and certain spirometry measurements into account.
Keywords: Spirometry; Airway resistance; Respiratory function tests; Vital capacity.
Resumo
Objetivo: Utilizar os dados clínicos e espirométricos para distinguir entre os padrões restritivo e inespecífico dos resultados dos testes de função pulmonar em pacientes com CVF reduzida e relação VEF1/CVF normal ou elevada. Métodos: Foram avaliados resultados de testes de função pulmonar de 211 pacientes adultos submetidos à espirometria e a medidas de volumes pulmonares. O diagnóstico clínico na solicitação do exame e diversos dados funcionais foram utilizados para diferenciar pacientes com o padrão restritivo “verdadeiro” (CPT reduzida) daqueles com o padrão inespecífico (CPT normal). Resultados: Na amostra estudada, a CPT estava reduzida em 144 casos e estava dentro da faixa normal em 67. As causas mais comuns do padrão inespecífico foram doenças pulmonares obstrutivas, insuficiência cardíaca congestiva, obesidade, bronquiolite, doenças intersticiais e doenças neuromusculares. Em pacientes com hipótese diagnóstica de fibrose pulmonar, doenças pleurais ou doenças da parede torácica, o valor preditivo positivo (VPP) para restrição foi ≥ 90%. Em homens, a CVF ≤ 60% do previsto teve um VPP para restrição de 98,8%. Em mulheres, o padrão restritivo foi encontrado em 84,4% daquelas com CVF ≤ 50% do previsto. Uma diferença entre VEF1% e CVF% ≥ 0% teve um VPP para restrição de 89,5%. Após
regressão logística, uma escala de pontos foi desenvolvida para predizer o padrão restritivo. Conclusões: O padrão restritivo pode ser identificado com segurança em diversos casos com VEF1 e CVF reduzidos e relação VEF1/CVF normal usando-se um algoritmo que leva em conta o diagnóstico clínico e alguns achados espirométricos.
Descritores: Espirometria; Resistência das vias respiratórias; Testes de função respiratória; Capacidade vital.
* Study carried out in the Department of Pulmonology, São Paulo Hospital for State Civil Servants, São Paulo, Brazil. Correspondence to: Carlos A. C. Pereira. Avenida Iraí, 393, conjunto 33/34, Moema, CEP 04082-001, São Paulo, SP, Brasil. Tel 55 11 5543-8070. E-mail: pereirac@uol.com.br
Financial support: None.
Submitted: 11 February 2010. Accepted, after review: 15 March 2010.
at four different laboratories in Brazil, were reviewed retrospectively. The reference values were those recommended for the Brazilian population.(11,12) The study design was approved
by the research ethics committees of all four facilities.
We included pulmonary function tests that met the following criteria: meeting the acceptability and reproducibility criteria for spirometric and lung volume measurements(13,14);
and evaluating patients who presented with reduced FVC and VC (values below the 5th percentile) and for whom the diagnosis cited on the clinical spirometry request form could result in obstructive or restrictive lung impairment. The exclusion criteria were as follows: evaluating patients whose age or stature did not fall within the range of the reference values(11,12); evaluating
patients in whom the FEV1/FVC or FEV1/VC ratio
was below the 5th percentile(12); and evaluating
patients in whom the clinical diagnosis at the time spirometry was ordered precluded making a clear inference about the pattern of pulmonary function test results, dyspnea being one example of such a diagnosis.
In three of the four laboratories, spirometry was performed using a mass flow sensor (SensorMedics model 2200; Viasys Health Care, Yorba Linda, CA, USA), and lung volume measurements were taken using a whole-body plethysmograph (SensorMedics model 6200 Bodybox; Viasys Health Care). In the remaining laboratory, spirometry and lung volume measurements were performed using a Collins CPL system (Ferraris Respiratory, Louisville, CO, USA), lung volumes being determined by helium dilution. Tests from this last facility included only those of patients with neuromuscular, pleural, or chest wall diseases. In a subset of patients, At all four facilities, subsets of patients performed a second set of spirometry maneuvers 15 min after the administration of a bronchodilator (inhaled albuterol, 400 µg).
Patients with normal TLC were classified as presenting a nonspecific pattern, whereas those with reduced TLC were classified as presenting a restrictive pattern.
Initially, the patients were divided into six groups, according to the suspected diagnosis prior to pulmonary function tests and the pathophysiological study, in order to calculate the probability of restrictive impairment:
Introduction
Abnormal patterns of pulmonary function test results are broadly classified as obstructive, restrictive, or mixed. Obstructive lung diseases are diagnosed based on a spirometric finding of a low FEV1/FVC or FEV1/VC ratio (using the highest VC in the calculation).(1) The criterion
currently considered to be the gold standard for the identification of a restrictive pattern is decreased TLC.(2) Low FVC in the presence
of a normal or elevated FEV1/FVC ratio, has
traditionally been classified as a restrictive pattern, although TLC remains normal in many patients presenting with this pattern.(3,4)
In various lung diseases, a significant amount of air can remain trapped during forced expiration. In some cases, this air trapping results in proportional decreases in FVC and FEV1, thereby maintaining a normal FEV1/FVC ratio.(5,6) In such cases, RV increases and TLC
remains normal. This pattern of pulmonary function test results has been designated the nonspecific pattern.(7,8)
In the absence of lung volume data, there are a number of findings that could facilitate the differentiation between the restrictive and nonspecific patterns. Clinical diagnoses could change the predictive value of spirometry data. Since VC constitutes the greatest part of TLC, marked decreases in VC without apparent airflow obstruction would suggest a decrease in TLC.(9) Other findings, such as an increased FEV
1/
FVC ratio, an increase in the difference between FEV1% and FVC%, or a supernormal maximal mid-expiratory flow rate, could be used in order to increase the positive predictive value for the restrictive pattern. A large difference between VC and FVC(10) or a significant bronchodilator
response(8) could, even when the FEV
1/FVC ratio
is normal, indicate obstructive lung diseases with air trapping, thus reducing the predictive value for the diagnosis of a restrictive pattern.
The objective of the present study was to determine the predictive value of clinical and spirometric findings for the identification of the “true” restrictive pattern in patients with low FVC and normal or elevated FEV1/FVC ratio.
Methods
5) significant bronchodilator response (> 12% and > 0.20 L increase in FEV1)(13)
All values are expressed as mean ± SD. Comparisons between the nonspecific pattern and restrictive pattern groups were made with Student’s t-test and the chi-square test (χ2).
We created ROC curves for all of the parameters evaluated. The variables with the largest area under the curve (AUC) were included in a logistic regression model in order to estimate the probability of restriction. After multiple simulations, a score was generated, considering several cut-off points for the best discrimination between the nonspecific and restrictive pattern. The statistical analysis was performed using the Statistical Package for the Social Sciences, version 10.0 for Windows (SPSS Inc., Chicago, IL, USA). The level of significance was set at 0.05.
Results
The pulmonary function tests of 211 patients were included. The mean age of the patients was 56 ± 15 years (range, 20-81 years), and 54% were female.
The TLC was measured by plethysmography in 193 cases and by helium dilution in 18. The restrictive pattern (reduced TLC) was identified in 144 cases, and the nonspecific pattern (normal TLC) was identified in 67. The proportion of smokers/ex-smokers did not differ significantly between the two groups (24% in the restrictive pattern group vs. 16% in the nonspecific pattern
• group 1—patients with interstitial lung
diseases (ILDs)
• group 2—patients with a working clinical
diagnosis of obstructive lung disease, such as asthma or COPD
• group 3—patients with congestive heart
failure (CHF)
• group 4—patients with pleural or chest
wall diseases, such as pleural effusion or kyphoscoliosis
• group 5—patients with neuromuscular
diseases and diaphragmatic paralysis
• group 6—obese patients (BMI ≥ 30 kg/ m2), without CHF or COPD, the diagnosis
of obesity being specified on the request form for the test
The clinical diagnoses were submitted to a priori rearrangement into three categories, according to the probability of presenting a restrictive pattern: high probability = 2 (≥ 90%); intermediate probability = 1 (50-89%); and low probability = 0 (< 50%).
The spirometric parameters employed in order to distinguish the cases presenting a nonspecific pattern from those presenting a restrictive pattern were as follows:
1) FVC% and VC%
2) difference between VC and FVC
3) FEV1/FVC% ratio and difference between FEV1% and FVC%
4) FEF25-75%/FVC%, both calculated as observed values and as the percentage of predicted values(12)
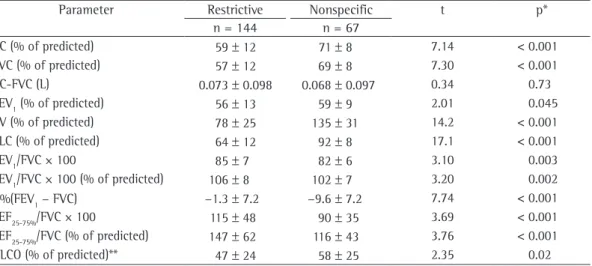
Table 1 - Values for pulmonary function tests in patients with reduced FVC and normal or elevated FEV1/FVC ratio, by TLC: reduced (restrictive pattern) or within the normal range (nonspecific pattern).a
Parameter Restrictive Nonspecific t p*
n = 144 n = 67
VC (% of predicted) 59 ± 12 71 ± 8 7.14 < 0.001 FVC (% of predicted) 57 ± 12 69 ± 8 7.30 < 0.001 VC-FVC (L) 0.073 ± 0.098 0.068 ± 0.097 0.34 0.73 FEV1 (% of predicted) 56 ± 13 59 ± 9 2.01 0.045 RV (% of predicted) 78 ± 25 135 ± 31 14.2 < 0.001 TLC (% of predicted) 64 ± 12 92 ± 8 17.1 < 0.001
FEV1/FVC × 100 85 ± 7 82 ± 6 3.10 0.003
FEV1/FVC × 100 (% of predicted) 106 ± 8 102 ± 7 3.20 0.002 Δ%(FEV1 − FVC) −1.3 ± 7.2 −9.6 ± 7.2 7.74 < 0.001
FEF25-75%/FVC × 100 115 ± 48 90 ± 35 3.69 < 0.001
FEF25-75%/FVC (% of predicted) 147 ± 62 116 ± 43 3.76 < 0.001 DLCO (% of predicted)** 47 ± 24 58 ± 25 2.35 0.02
aData expressed as mean ± SD. Δ%(FEV
1 − FVC): percentage difference between FEV1 and FVC. *Student’s
group, VC, FVC, and DLCO were lower, whereas the FEV1/FVC and FEF25-75%/FVC ratios were higher. As expected, RV was higher in the nonspecific pattern group, being elevated in 52%, in comparison with 4% of the cases in the restrictive pattern group (χ2 = 70.8, p < 0.001).
The most common diagnoses listed on the request form for spirometry, as well as the proportion of cases of restrictive pattern found in the various diagnostic categories, are shown in Table 2. Only patients with interstitial pulmonary fibrosis (IPF) and those with pleural or chest wall disorders had a high probability (≥ 90%) for presenting the restrictive pattern.
Forced expiratory maneuvers were repeated after bronchodilator administration in 169 patients. Significant increases were found in 2 (2.7%) of the 73 cases presenting a restrictive pattern, compared with 7 (15.2%) of the 46 presenting a nonspecific pattern (χ2 = 6.28;
p = 0.012).
Significant differences were found between the restrictive pattern group and the nonspecific pattern group in terms of the AUC values for functional parameters (Table 1). The findings for the most discriminatory variables are shown in Figure 1. Among all variables, the AUC was highest for difference between FEV1% and FVC%
(0.798; 95% CI: 0.729-0.866). The AUC for VC and FVC were very similar (0.795 and 0.793, respectively), whereas The FEV1/FVC ratio had the lowest AUC (0.644; 95% CI: 0.564-0.724).
In the logistic regression analysis, the probability for restriction is expressed as follows:
+ +
=
+
(a bx) (a bx)
e p
1 e
where a and b are the parameters fitted by the logistic model.
Considering the score for the clinical probability of restriction, FVC%, and Δ%(FEV1 − FVC), the following equation was devised:
1
6.354 [ FVC% 0.089] [ prestriction 0.679] [ %( FEV FVC) 0.099]
p=e − × + × + Δ − ×
where e is the basis of the natural logarithm (i.e., 2.7183). The overall corrected percentage, classified according to the logistic regression, was 81%.
Using two-by-two contingency tables,
true-positive (sensitivity) and false-positive (1 −
specificity) values were calculated for various group; p = 0.44). Of the 211 patients evaluated,
69 (33%) were obese. The proportion of obese patients did not differ significantly between the two groups (39% in the nonspecific pattern group vs. 30% in the restrictive pattern group; p = 0.20).
The functional data for the two groups are shown in Table 1. In the restrictive pattern
Table 2 - Clinical diagnosis and proportion of cases with reduced TLC in 211 patients with reduced FVC% and normal or elevated FEV1/FVC ratio.
Clinical diagnosis Total Reduced TLC n n (%) Interstitial lung diseases 92 73 (79) Pulmonary fibrosis 51 46 (90)
Sarcoidosis 15 8 (53)
Other
(includes “interstitial disease”)
26 19 (73)
Suspected obstructive diseases 48 43 (58)
Asthma 21 4 (19)
COPD 15 10 (67)
Bronchiolitis/bronchiectasis 12 6 (50) Congestive heart failure 15 9 (60) Chest wall and pleural diseases 14 13 (93) Neuromuscular diseases (isolated) 20 14 (70) Obesity (isolated) 22 15 (68)
Discussion
The present study shows that, by using clinical findings and data derived from spirometry, the reliability of the identification of the restrictive pattern can be increased in a significant percentage of cases presenting reduced FVC and normal FEV1/(F)VC ratio.
Incomplete expiration is a common cause of reduced FVC. Therefore, special attention must be paid to end-of-test criteria for spirometric curves in order to determine the true FVC value.(13) In
the present study, lung volumes were measured by plethysmography in all patients suspected of having intrapulmonary restriction. Because lung volume measurements by gas dilution can underestimate RV and TLC in patients with air trapping, such measurements were accepted only for patients with chest wall diseases.
Spirometry is quite useful for excluding the restrictive pattern. When VC is within the normal range, the probability of restriction is quite low.(2,3,9)
Various conditions can result in a nonspecific pattern of pulmonary function test results.(8)
Elevated RV is found in many patients presen-ting with this pattern, which some authors suggest is exclusively attributable to small airway obstruction.(5) However, in asthma,
constriction of the large airways can also result in airway closure during expiration.(15) Therefore,
it would be incorrect to imply that small airway obstruction is the mechanism in all cases. One group of authors studied a random sample of 100 individuals presenting with the nonspecific pattern.(8) Patients with reduced DLCO were
excluded. The authors found the most common causes to be asthma, obstructive lung diseases other than asthma, and obesity. In 33 individuals, FVC cut-off points: true-positive values, defined
as those associated with the restrictive pattern (reduced TLC), and false-positive values, defined as those associated with the nonspecific pattern (normal TLC). The results and cut-off points for FVC%, as well as the percentage difference between FEV1 and FVC, together with high
clinical probability, are shown in Table 3. Following several simulations using the logistic regression equation described above and ROC curve data collection, a point scale was devised in order to estimate the probability of restriction (Table 4). There were 78 patients (37%) who scored ≥ 3 points. Of those, 76 (97%) presented with reduced TLC.
Table 3 - True-positive (sensitivity) values, false-positive (1 − specificity) values, positive predictive values,
and likelihood ratios for cut-off values of predictors of reduced TLC in patients with low FVC and normal or elevated FEV1/FVC ratio.
Parameter Sensitivity 1 − specificity PPV LR p
% % % %
FVC ≤ 50%, females 30.5 3.7 90 8.24 < 0.001
FVC ≤ 50%, males 24.7 7.7 95 3.20 1.88
FVC ≤60%, females 52.5 14.8 79 3.55 < 0.001
FVC ≤ 60% males 60.0 7.7 98 7.79 < 0.001
Δ%(FEV1 − FVC) ≥ 0 70.1 23.8 86.3 2.94 < 0.001 High clinical probability 40.9 8.9 90.6 4.96 < 0.001 PPV: positive predictive value; LR: likelihood ratio; and Δ%(FEV1 − FVC): percentage difference between FEV1 and FVC.
Table 4 - A point scale for estimating the probability of a restrictive pattern in spirometric tests with reduced FVC and normal or elevated FEV1/FVC ratio.
Parameter Points
FVC ≤ 60% in males 3
FVC ≤ 50% in females 2 FVC > 60% in males or > 50% in females 0 Clinical probability of restriction
Higha 2
Intermediateb 0
Lowc −2
Δ%(FEV1 vs. FVC)
FVC% − FEV1% > 5 −1
FVC% − FEV1% between 1 and 5 1
FEV1% − FVC% ≥ 0 2
Δ%(FEV1 vs. FVC): percentage difference between FEV1 and
FVC. aPulmonary fibrosis; chest wall and pleural diseases;
and pulmonary resection. bNon-fibrosing interstitial lung
diseases, obesity, congestive heart failure, connective tissue diseases, and others. cObstructive lung diseases, such as
have been performed in order to exclude other common conditions, such as asthma.
In individuals with ILD, reduced FVC and preserved FEV1/FVC ratio typically indicate reduced TLC, although the involvement of the small airways (in diseases such as sarcoidosis) or concomitant emphysema (common in IPF) can result in increased RV with normal TLC.(23)
Patients with CHF can display a range of pulmonary function test result patterns, the restrictive pattern being the most common, although the nonspecific pattern can also be found.(24,25)
In individuals with neuromuscular diseases, respiratory muscle weakness is common. Reduced maximal expiratory pressure can result in increased RV with normal TLC.(26)
In relation to restriction, the specificity of spirometric criteria is greater than is their sensitivity.(2,3,9) However, our data show that,
by combining clinical and spirometric data, restriction can, in many cases, be reliably diagnosed. A large decrease in FVC is thought to reflect reduced TLC in patients presenting with an FEV1/FVC ratio above the lower limit of normality.(3,9) In a recent study involving patients
without obstruction,(9) restrictive impairment
could be predicted with a probability of > 95% if the measured value of FVC fell below 55% of the predicted value in males or below 40% of that in females. In the present study, gender-based differences in FVC cut-off values were also found, but the values with the best discriminatory power were slightly different: < 60% in males; and < 50% in females.
In the present study, clinical diagnoses were valuable for increasing or decreasing the predictive value for a diagnosis of restriction. As expected, many patients with a working clinical diagnosis of obstructive disease presented normal TLC. However, the final diagnosis could not be ascertained for the cases in which the clinical diagnosis on the spirometry request form was COPD and the patient presented with reduced TLC on plethysmography.
The percentage difference between FEV1
and FVC proved to be of value in estimating the probability of restriction. It is expected that, in lung diseases that increase lung recoil, such as pulmonary fibrosis, FVC% is decreased to a greater degree than is FEV1%. However, a smaller reduction in FVC% results in a lower probability the diagnosis of asthma was made based on
a positive bronchodilator response or on the results of a methacholine bronchial provocation test. A significant bronchodilator response can discriminate between the restrictive pattern and the nonspecific pattern. However, in the present study, the bronchodilator response had a low sensitivity for identifying the nonspecific pattern. In our study, the nonspecific pattern was seen in 67 of the 211 cases analyzed. The most common causes were similar, but interstitial and neuromuscular diseases were also found. We did not exclude patients with low DLCO.
In asthma, the closure of susceptible airways can result in extensive air trapping in the areas of the lung that do not contribute to the expiratory flow, consequently increasing RV and maintaining TLC within the normal range.(6,8,16) However, a “true” restrictive pattern,
as evidenced by reduced TLC on plethysmography, is found in a proportion of patients, albeit a small proportion.(17)
Various diseases can result in bronchiolitis and a nonspecific pattern of pulmonary function test results. An expiratory CT should be obtained in nonsmoking patients who do not have asthma but present with dyspnea, reduced FVC, normal FEV1/FVC, and irrelevant or normal chest X-ray findings.(18) In patients with bronchiectasis,
bronchiolitis obliterans is common, and RV can be elevated.(19)
Obesity is a common cause of nonspecific lung disease.(8) Obesity results in reductions
in TLC, functional residual capacity, and FVC, together with a slight decrease in RV. In obese males, airway narrowing seems to be greater than what would be expected to result from reduced lung volume alone.(20) In
population-based studies, asthma has been associated with obesity, especially in females.(21)
In individuals with asthma, the increase in RV is greater than the decrease in FVC, due to a simultaneous increase in TLC. The neural drive to the inspiratory muscles increases the outward recoil of the chest wall, resulting in greater TLC.(15) The combination of obesity and airflow
obstruction can result in increased RV, without proportional increases in TLC, due to lower chest wall compliance, thereby reducing FVC and FEV1
in a proportional manner.(22) In obese individuals,
11. Neder JA, Andreoni S, Castelo-Filho A, Nery LE. Reference values for lung function tests. I. Static volumes. Braz J Med Biol Res. 1999;32(6):703-17.
12. Pereira CA, Sato T, Rodrigues SC. New reference values for forced spirometry in white adults in Brazil. J Bras Pneumol. 2007;33(4):397-406.
13. Standardization of Spirometry, 1994 Update. American Thoracic Society. Am J Respir Crit Care Med. 1995;152(3):1107-36.
14. Wanger J, Clausen JL, Coates A, Pedersen OF, Brusasco V, Burgos F, et al. Standardisation of the measurement of lung volumes. Eur Respir J. 2005;26(3):511-22. 15. Brown RH, Pearse DB, Pyrgos G, Liu MC, Togias A, Permutt
S. The structural basis of airways hyperresponsiveness in asthma. J Appl Physiol. 2006;101(1):30-9.
16. Samee S, Altes T, Powers P, de Lange EE, Knight-Scott J, Rakes G, et al. Imaging the lungs in asthmatic patients by using hyperpolarized helium-3 magnetic resonance: assessment of response to methacholine and exercise challenge. J Allergy Clin Immunol. 2003;111(6):1205-11.
17. Miller A, Palecki A. Restrictive impairment in patients with asthma. Respir Med. 2007;101(2):272-6.
18. Hansell DM. Small airways diseases: detection and insights with computed tomography. Eur Respir J. 2001;17(6):1294-313.
19. Landau LI, Phelan PD, Williams HE. Ventilatory mechanics in patients with bronchiectasis starting in childhood. Thorax. 1974;29(3):304-12.
20. King GG, Brown NJ, Diba C, Thorpe CW, Muñoz P, Marks GB, et al. The effects of body weight on airway calibre. Eur Respir J. 2005;25(5):896-901.
21. Chinn S, Downs SH, Anto JM, Gerbase MW, Leynaert B, de Marco R, et al. Incidence of asthma and net change in symptoms in relation to changes in obesity. Eur Respir J. 2006;28(4):763-71.
22. Nicolacakis K, Skowronski ME, Coreno AJ, West E, Nader NZ, Smith RL, et al. Observations on the physiological interactions between obesity and asthma. J Appl Physiol. 2008;105(5):1533-41.
23. Brådvik I, Wollmer P, Simonsson B, Albrechtsson U, Lyttkens K, Jonson B. Lung mechanics and their relationship to lung volumes in pulmonary sarcoidosis. Eur Respir J. 1989;2(7):643-51.
24. Johnson BD, Beck KC, Olson LJ, O’Malley KA, Allison TG, Squires RW, et al. Pulmonary function in patients with reduced left ventricular function: influence of smoking and cardiac surgery. Chest. 2001;120(6):1869-76. 25. Light RW, George RB. Serial pulmonary function in
patients with acute heart failure. Arch Intern Med. 1983;143(3):429-33.
26. Rochester DF, Esau SA. Assessment of ventilatory function in patients with neuromuscular disease. Clin Chest Med. 1994;15(4):751-63.
of restriction than does a greater reduction in FEV1%.
In conclusion, the interpretation of a restrictive pattern, identified by means of spirometry, can be made more accurately by incorporating the magnitude of the reduction in FVC, the probability of a restrictive pattern being calculated on the basis of the clinical diagnosis, as well as on the percentage difference between FEV1 and FVC. A significant bronchodilator
response suggests an inapparent obstructive component or defect. The application of the present data to another cohort of cases with suspected restriction is needed in order to validate the present findings.
References
1. Pellegrino R, Viegi G, Brusasco V, Crapo RO, Burgos F, Casaburi R, et al. Interpretative strategies for lung function tests. Eur Respir J. 2005;26(5):948-68. 2. Aaron SD, Dales RE, Cardinal P. How accurate
is spirometry at predicting restrictive pulmonary impairment? Chest. 1999;115(3):869-73.
3. Venkateshiah SB, Ioachimescu OC, McCarthy K, Stoller JK. The utility of spirometry in diagnosing pulmonary restriction. Lung. 2008;186(1):19-25.
4. Stănescu D, Veriter C. A normal FEV1/VC ratio does not exclude airway obstruction. Respiration. 2004;71(4):348-52.
5. Stănescu D. Small airways obstruction syndrome. Chest. 1999;116(1):231-3.
6. Olive JT Jr, Hyatt RE. Maximal expiratory flow and total respiratory resistance during induced bronchoconstriction in asthmatic subjects. Am Rev Respir Dis. 1972;106(3):366-76.
7. Hyatt RE, Scanlon PD, Nakamura M. Static (Absolute) Lung Volumes. In: Hyatt RE, Scanlon PD, Nakamura M, editors. Interpretation of Pulmonary Function Tests. Philadelphia: Lippincott-Raven; 1997. p. 27-40. 8. Hyatt RE, Cowl CT, Bjoraker JA, Scanlon PD. Conditions
associated with an abnormal nonspecific pattern of pulmonary function tests. Chest. 2009;135(2):419-24. 9. Vandevoorde J, Verbanck S, Schuermans D, Broekaert
L, Devroey D, Kartounian J, et al. Forced vital capacity and forced expiratory volume in six seconds as predictors of reduced total lung capacity. Eur Respir J. 2008;31(2):391-5.
About the authors
Luiz Carlos D’Aquino
Assistant Professor. Joinville Regional University School of Medicine, Joinville, Brazil.
Sílvia Carla Sousa Rodrigues
Physician in Charge of the Department of Pulmonary Function, São Paulo Hospital for State Civil Servants, São Paulo, Brazil.
João Adriano de Barros
Physician in Charge of the Department of Pulmonary Function, Universidade Federal do Paraná – UFPR, Federal University of Paraná – Hospital de Clínicas, Curitiba, Brazil.
Adalberto Sperb Rubin
Physician in Charge of the Department of Pulmonary Function, Santa Casa Hospital Complex in Porto Alegre, Porto Alegre, Brazil.
Nelson Augusto Rosário Filho
Director. Department of Pediatric Allergy, Universidade Federal do Paraná – UFPR, Federal University of Paraná – Hospital de Clínicas, Curitiba, Brazil.
Carlos Alberto de Castro Pereira