Financial health and customer satisfaction in
private health care providers in Brazil
Desempenho fi nanceiro e satisfação do consumidor
das operadoras de saúde suplementar no Brasil
1 Escola de Administração de Empresas de São Paulo, Fundação Getulio Vargas, São Paulo, Brasil.
2 Universidade Presbiteriana Mackenzie, São Paulo, Brasil.
Correspondence R. F. Schiozer
Escola de Administração de Empresas de São Paulo, Fundação Getúlio Vargas. Rua Itapeva 474, 8o andar, São Paulo, SP
01332-000, Brasil. [email protected]
Rafael Felipe Schiozer 1 Cristiana Checchia Saito 2 Richard Saito 1
Abstract
This paper analyzes the relationship between the financial health and organizational form of private health care providers in Brazil. It also examines the major determinants of customer satisfaction associated with the provider’s organ-izational form. An adjusted Altman’s z-score is used as an indicator of financial health. A proxy variable based on customer complaints filed at the Brazilian National Agency for Supplemen-tary Health is used as an indicator for customer satisfaction. The study uses a sample of 270 pri-vate health care providers and their operations over the period 2003-2005. Panel data analysis includes control variables related to market, op-erations, and management. Principal results indicate that: (1) private health care providers benefit from economies of scale; (2) self-funded health plans have better financial health; (3) spending on marketing does not have a signif-icant impact on customer satisfaction in Brazil; (4) weak empirical evidence exists showing that good financial performance enhances customer’s satisfaction.
Prepaid Health Plans; Supplemental Health; Consumer Satisfaction
Introduction
The private health industry in Brazil has grown in recent years. From 1998 to 2008 the proportion of the population covered by private health plans increased from 24.5% to 26.3%, which is equiva-lent to a 26.8% increase in the total number of beneficiaries during this period 1.
Information on the effect of the main deter-minants of the financial health of private health care providers is important to help regulators and market players create appropriate policies and strategies and strike a balance between qual-ity service delivery and a profitabilqual-ity margin that reflects the provider’s risk. Customers may suffer from lack of assistance or service rationing due to financial difficulties experienced by private health providers. The financial stability of insur-ers is therefore essential for an effective supple-mentary health system. To address this potential problem, in 2006 the Brazilian National Agency for Supplementary Health (Agência Nacional de Saúde Suplementar – ANS) created a resolution that established a program whose ultimate aim is to assess the overall performance of private health care providers 2.
providers in Brazil, adopting five modalities in the supplementary health care system: (i) health insurance companies, (ii) commercial insurers, (iii) medical cooperatives, (iv) non-profit health insurers, and (v) self-managed health plans.
Second, we test whether better financial health implies a greater level of customer satis-faction. Milan & Trez 3 tested variables related to customer satisfaction in commercial health in-surance companies in Brazil; however, these vari-ables did not concern the financial performance of these companies. Badia 4 also characterizes health plan organizations and proposes a meth-od to measure the level of customer satisfaction. Our study tests a range of determinants of finan-cial health and customer satisfaction, including organizational form, company size, marketing efforts and pricing strategies.
The findings of this study show that private health care providers in Brazil benefit from econ-omies of scale; these findings are similar to those of Browne et al. 5 in a study of the private health market in the United States. We also highlight that the financial health of providers improves as the number of beneficiaries increases. We also provide evidence showing that the organization-al form that enjoys the best financiorganization-al heorganization-alth is the self-managed health plans and that the organ-izational form that has the worst financial per-formance is the non-profit health insurers. We also observe that levels of customer satisfaction in the organizational form self-managed plans is greater than in others, showing a positive as-sociation between good financial health and customer satisfaction. This may be due to the fact that most self-managed plans are partially funded by the beneficiaries’ employers, which could result in a more advantageous cost-ben-efit relationship for beneficiaries compared to other organizational forms; however, our dataset does not allow us to formally test this hypothesis. Finally, in contrast to Goodman 6, we find that there is little or no relationship between market-ing efforts or company size and level of customer satisfaction.
Theoretical framework, previous
empirical findings and hypotheses
Literature review
Findings of empirical research sustain that eco-nomic and market variables are important deter-minants of solvency of private health care pro-viders. Browne et al. 5 highlight the influence of economies of scale on companies’ operations, as size increases negotiation power with health care
providers and allows for overheads to be spread across a broader client base.
Furthermore, the financial health of the pro-vider is believed to be positively associated with consumer satisfaction, as solvency and surplus funds create the flexibility necessary to elaborate programs that better meet customers’ demands 7. Anderson et al. 8 provide empirical evidence of a positive association between customer satisfac-tion and profitability.
Irvine 9 outlines the relationship between market share and level of customer satisfaction. Other authors, such as Knutson et al. 10 and Scan-lon et al. 11 examined the use of information on customer satisfaction in the United States. De-terminants of customer satisfaction found in the literature include the average cost of the health insurance premium and the comprehensiveness of coverage frequently associated with quality.
Christianson et al. 12 infer that the type of or-ganizational form of health insurers has an influ-ence on level of customer satisfaction. Likewise, Tae-Seale 13 describes client retention in private health plans in the United States in a study which adopts definitions of organizational form similar to those used in the present work. According to Tae-Seale’s findings, the “type of insurer” (type of organizational form) has a definite influence on client retention.
Kolodinsky’s 14 extensive review and summa-ry of findings of literature on consumer satisfac-tion in managed health care plans suggest that consumer satisfaction is influenced by a number of factors, such as experiences with health care, access to care, availability of resources, continu-ity of care, the health care delivery process, and a reciprocal process that is influenced by both the consumer and provider of medical services. Da-vis et al. 15 shed light on customer dissatisfaction with the private health care system in the United States, linking satisfaction with the client’s degree of choice of providers and how this is related to the customers’ experiences with care.
Another recurring determinant of customer satisfaction is “how plans work”, or “access mo-dality”. Figueiredo 16 categorizes the means of providing access, use and choice of health ser-vices to beneficiaries in Brazil as follows: “total free choice”, “directed free choice”, “preferred provider”, and “steering”.
plan. They are similar to the “staff” or the “group” modalities of Health Maintenance Organizations in the United States 17. Although this modality is often disliked by consumers, insurers claim that it reduces costs and mitigates moral hazard prob-lems, so enabling companies to reduce the cost of premiums.
The main characteristic of “directed free choice” modality is the availability of a network of health care providers commonly listed in a directory from which the customer can choose the provider and service observing the condi-tions established by the contract. Like “steering”, this modality does not require the beneficiary to make any payment to the health care provider, who is compensated by the insurer according to a pre-established price list.
Under the “total free choice” modality, there is no restriction regarding the selection of the pro-vider. Beneficiaries freely decide based on prefer-ence in which practice, diagnosis center, hospital etc., they want to receive services. The service is paid directly to the provider by the beneficiary, who requests a total or partial reimbursement from the provider.
The “preferred provider” modality is by far the least common in Brazil (an example of one of the few providers that use this modality is Nipomed). Under this modality, the customer pays the pro-vider directly for the service delivered. The charg-es are lower than the usual “out-of-pocket” cost of the “total free choice” modality as the general concept is that beneficiaries use providers that have agreed to give them a price discount.
There is also a stream of literature investigat-ing customer satisfaction in other insurance-related industries. Fiegenbaum & Thomas 18 carried out a seminal study between 1970 and 1984 where they developed a methodology for identifying strategic action groups in the life in-surance industry in the United States. Although the analysis did not focus on the health sector, the general conclusions of this study are consis-tent with the extant findings regarding health in-surance companies. The authors identified key factors that define competitive strategy in the industry: product scope, product diversification, company size, average premium, financial lever-age and investments.
Types of organizational form and their association with different access modalities
ANS registers each health insurer in Brazil ac-cording to the organizations’ activity and mis-sion, i.e., its organizational form. Organizational form is defined in this study according to the cri-teria adopted by ANS and, as the term implies,
refers to how the plan is organized, planned and perceived by those who are involved in the man-agement and regulation of the system. There are five types of organizational forms: health insur-ance companies, commercial insurers, medical cooperatives, non-profit health insurers, and self-managed health plans. This definition is consistent with the types of organizational form posed by Malta et al. 19 and Ocké-Reis 20.
Self-managed health plans are managed di-rectly by the sponsor or by a third-party manage-ment company chosen by the sponsor. Medical cooperatives are organizations in which physi-cians deliver health care services and also co-own the organization. A popular example of a medical cooperative in Brazil is Unimed. Health insurance companies do not own health care fa-cilities and the relationship with subscribers is based on an insurance policy, as in other types of insurance (life, property etc). Companies catego-rized as commercial health insurers frequently own the health care facilities where their benefi-ciaries receive health services. Non-profit organi-zations generally provide health care to enrollees through self-owned health care facilities.
As mentioned above in the Literature Review section, one can infer an association between perceived quality, beneficiary satisfaction and access modality as defined by Figueiredo 16. Since information about the prevailing access modality adopted by each private health insurer is not sys-tematically provided, we cannot use access mo-dality as a variable in our model. However, there is a clear association between access modality and organizational form which allows us to infer the characteristics of health plans that were high-lighted by the literature as being determinants of customer satisfaction.
Pinto & Soranz 20 conducted a study in which they characterized private health plans in Brazil in terms of the relationship between access mo-dality and coverage and organizational form. Al-though the use of access modalities such as total free choice has recently become more common among commercial health insurers, the steer-ing and directed free choice modalities, where payment is not required when using health care services, are the most commonly adopted by pro-viders that act under this type of organizational form 22.
compa-nies started to work with networks of hospitals as they faced an increasingly saturated niche and decreasing demand and margins. Self-managed organizations also generally work with the to-tal free choice and directed free choice modali-ties, while in the case of non-profit plans and medical cooperatives the steering and directed free choice modalities are the most commonly adopted options.
Thus, since there is a correlation between organizational form and access modality, and considering that organizational form is a precise piece of information systematically published by ANS, organizational form is used in this work as a direct variable to define access modality. Fur-thermore, since the organizational form of a pro-vider is formally defined and disclosed by ANS, we consider that this directly observable measure is the best option for providing clear-cut results and interpretations for policymakers.
In light of the above theory, and based upon the studies presented, we selected market, mana-gerial and financial variables to model the dy-namics of the operations of health providers in Brazil.
Statement of hypotheses
There are many reasons to believe that factors that determine the financial health of Brazilian companies follow the same pattern as those ob-served in the United States regarding the ben-efits of scale. Large-sized insurers have greater capacity for risk diversification and enjoy greater negotiation power with health care providers. Furthermore, their operations involve signifi-cant fixed and administrative costs that can be spread across a larger number of clients. Based on these conclusions, we formulated the follow-ing hypothesis.
• Hypothesis 1: the financial health of health providers is positively associated with their size.
Our second hypothesis is founded on the inher-ent characteristics of the organizational forms studied in this article. Self-managed health plans cover a specific community of beneficiaries (gen-erally company workers and their families), and depend on financial support from sponsor or-ganizations which employ these workers. This financial support, per se, places self-managed plans in a privileged situation in terms of sol-vency in comparison to other types of organiza-tional form. Furthermore, in self-managed plans the beneficiary of the health care services pro-vided by the plan and the sponsor are the same entity and it is therefore the company that pays
for the services (as it is the workers that receive the services). Conversely, in other types of orga-nizational form, such as commercial health in-surance, the insured patient is the beneficiary of a health care service, but the financial burden, risks and costs related to this service fall on the health insurer. Thus, self-managed plans do not have a “third-party” figure and so are less prone to suffer from problems of moral-hazards caused by a natural tendency towards excessive service use. In cases where moral hazard is more likely to occur, the marginal cost of health care is greater than the marginal benefit 24. This thinking leads us to the following hypothesis:
• Hypothesis 2: self-managed plans enjoy bet-ter financial health than other types of organiza-tional form.
Our next hypothesis concerns customer satisfac-tion. In light of the findings from the literature 25, it can be assumed that there is a negative asso-ciation between average premium cost and cus-tomer satisfaction. Miller & Luft 26, Ashish 27 and Buchmueller & Feldstein 28 present empirical evidence that average premium cost has a nega-tive impact on the level of health insurance cus-tomer satisfaction. Buchmueller & Feldstein 29 also show that increases in premium cost, ceteris paribus, lead to a reduction in level of customer satisfaction. Thus, we are able to devise the third hypothesis as follows:
• Hypothesis 3: there is a negative association between the premium paid by the beneficiary and his/her satisfaction.
Furthermore, based on the theory presented above, we can hypothesize that good financial health leads to access to more comprehensive health services, since the negotiating power of insurers results in lower costs, potentially ex-panding the comprehensiveness of services. This in turn should lead to greater customer satisfac-tion:
• Hypothesis 4: there is a positive relationship between the financial health of the insurer and customer satisfaction.
• Hypothesis 5: customer satisfaction in the self-managed plans form is greater than in other types of organizational form.
The following section presents the methodolog-ical procedures for testing these five hypotheses.
Data and methodology
Data
Data was drawn from publically available infor-mation on ANS’s website, where financial state-ments of private health care providers are ac-cessible. Annual data is available for the period 2003-2005. The sample is composed of medium and large-sized health care providers which, ac-cording to the ANS definition, had a minimum of 17,000 beneficiaries as of 2005. We excluded small companies (i.e., those with less than 17,000 ben-eficiaries) and insurers focused on dental care. Small companies were excluded for two reasons: (i) there was a lot of missing data for these firms; (ii) these companies possess a completely differ-ent operational structure; most act locally and according to specific needs in the regions where they operate.
The exclusion of small insurers does not negatively affect representativeness, since the sample encompasses more than 75% of the total number of beneficiaries of health insurance (ex-cluding dental-specific insurers) in all the years studied.
Insurance plans that focused on providing dental care were excluded since it was consid-ered that the type of service provided by these plans is incomparable with broader health care plans. It should therefore be noted that caution should be taken when interpreting the results since they apply only to medium and large-sized medical health insurers.
Using the financial data collected, we de-signed an indicator of the financial health of health care providers that reflects liquidity, op-erational efficiency and level of debt. The Altman z-score 30, adapted for use with the financial data made available by ANS, was used as the main measure of financial health. The z-score is largely used as a general measure of the financial health and probability of bankruptcy of a company and in its original version is calculated as follows: Z = 6,56X1 + 3,26X2 + 6,72X4 + 1,05X4 (1),
where:
X1: working capital/total assets; X2: retained earn-ings/total assets; X3: EBIT (earnings before inter-est expenses and taxes)/total assets; X4: market value of equity/book value of liabilities.
Since there was no available data on retained earnings and market value of equity (since most companies in our sample are privately held), we removed the second factor (X2) from the equa-tion and substituted market value in X4 with the book value of equity. Our adapted z-score equa-tion is thus:
Z = 6,56X1 + 6,72X3 + 1,05X4 (2),
where:
X1: net working capital/total assets; X3: EBIT/to-tal assets; X4: book value of equity/book value of debt.
It is important to note that, although this equation is incomplete, the adapted z-score is an appropriate measure for comparing the financial health of companies within the sample.
ANS also provides data on its website on con-sumer complaints about each health care pro-vider. Consumers may register a complaint using a toll-free telephone number or ANS’s website. Each complaint is analyzed by technical staff to judge whether it is “reasonable” so as to avoid dis-closure of unreasonable complaints. Using this data, we computed a complaints index, based on the annual number of reasonable complaints per hundred beneficiaries for each company.
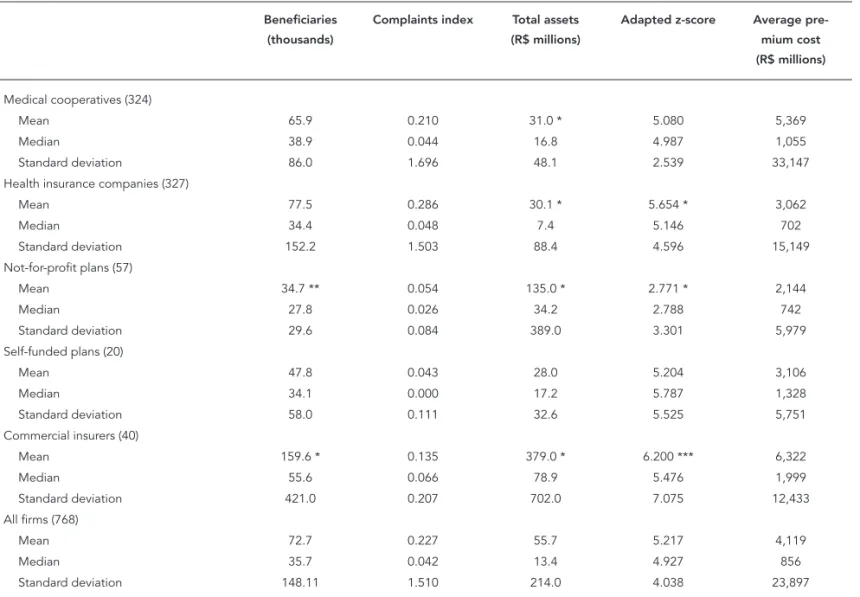
Our final database is thus composed of a total of 270 health care providers for which financial and complaints data were available, resulting in an unbalanced panel of 768 company-years. Of this total, 115 are health insurance companies, 7 are self-managed health plans, 20 are non-profit health providers, 14 are commercial insurance companies and 114 are medical cooperatives. Table 1 shows descriptive statistics on the main variables of this sample, and t-tests (adjusted for autocorrelation) comparing the average value of each variable for each type of organizational form to the average for the whole sample (for example, we compare the average number of beneficiaries of medical cooperatives to the average number of beneficiaries of the 4 other types of organiza-tional forms, and conclude that the difference is not statistically significant).
Table 1 shows that health insurance compa-nies have the highest number of beneficiaries (over 151,000, on average). This number is statis-tically different from the rest of the sample and is highly skewed due to the presence of one single company (Bradesco Seguros), which has around 1.3 million beneficiaries. Such right-tail asymme-try was confirmed to a minor extent for all types of health care providers.
significant at the 1% and 10% level respectively). With regard to total assets, non-profit organiza-tions have significantly greater assets, which in-dicates that non-profit organizations own a large part of the facilities used by their customers.
Table 1 also shows the cost of the average an-nual premium, which differs depending on the type of organizational form. The cost of the annu-al premium of heannu-alth insurance companies and self-managed plans is a little over 3,000 Brazilian Reais (R$). In smaller non-profit organizations the cost is around R$ 2,100. Costs are greater in larger medical cooperatives (over R$ 5,000) and commercial insurers (over R$ 6,000). However,
since there is a large degree of cross sectional dis-persion between all types of organizational forms (indicated by high standard deviations for each type of organizational form), there is no statisti-cal difference between them. Furthermore, there was no statistical difference in the complaints index between the groups, which can also be at-tributed to great dispersion within the sample.
Figure 1 shows the evolution of the com-plaints index during the period 2003-2005. The increase in the number of complaints in 2004 is due to a regulatory reform made in the private health care system in Brazil that came into effect at the end of 2003. During this period, major rule
Table 1
Descriptive statistics of the main variables.
Beneficiaries (thousands)
Complaints index Total assets (R$ millions)
Adapted z-score Average pre-mium cost (R$ millions)
Medical cooperatives (324)
Mean 65.9 0.210 31.0 * 5.080 5,369
Median 38.9 0.044 16.8 4.987 1,055
Standard deviation 86.0 1.696 48.1 2.539 33,147
Health insurance companies (327)
Mean 77.5 0.286 30.1 * 5.654 * 3,062
Median 34.4 0.048 7.4 5.146 702
Standard deviation 152.2 1.503 88.4 4.596 15,149
Not-for-profit plans (57)
Mean 34.7 ** 0.054 135.0 * 2.771 * 2,144
Median 27.8 0.026 34.2 2.788 742
Standard deviation 29.6 0.084 389.0 3.301 5,979
Self-funded plans (20)
Mean 47.8 0.043 28.0 5.204 3,106
Median 34.1 0.000 17.2 5.787 1,328
Standard deviation 58.0 0.111 32.6 5.525 5,751
Commercial insurers (40)
Mean 159.6 * 0.135 379.0 * 6.200 *** 6,322
Median 55.6 0.066 78.9 5.476 1,999
Standard deviation 421.0 0.207 702.0 7.075 12,433
All firms (768)
Mean 72.7 0.227 55.7 5.217 4,119
Median 35.7 0.042 13.4 4.927 856
Standard deviation 148.11 1.510 214.0 4.038 23,897
Note: this table shows the number of benefi ciaries, the complaints index (defi ned as the number of proper and reasonable complaints per thousand
changes were made to health services contracts and the new regulatory framework was still un-clear for both customers and health care provid-ers. This explains why the number of complaints was higher in 2004 compared to 2003 and 2005. A more detailed analysis (unreported) shows that the increase in the number of complaints was greater in medical cooperatives and health insur-ance companies.
The model
We are fundamentally interested in understand-ing: (i) what types of organizational form (com-mercial insurers, health insurers, medical coop-eratives, non-profit health care providers and self-managed health plans) enjoy potentially bet-ter financial health; (ii) whether the operations involving health care provision include econo-mies of scale; (iii) whether there is any relation-ship between the cost of the premium and the financial health of the company.
For this purpose we used the Generalized Least Squares (GLS) panel regression method, using the following independent variables: type of organizational form (using a dummy variable to represent each type), company size and the average premium cost. Since the organizational form variable is time-invariant, an estimate is made using random effects. We also used cluster-robust standard errors in order to mitigate prob-lems with heteroskedasticity and non-normality.
To analyze customer satisfaction, we used the complaint index as a dependent variable – in fact the number of complaints is obviously a proxy variable for consumer dissatisfaction. Also, as dependent variables, we used a dummy variable to represent each type of organizational form, fi-nancial health (z-score) and company size. Since there was a significant number of firms which received no complaints, we used a truncated re-gression model (TOBIT) using observed infor-mation matrix (OIM) standard errors.
The operational definitions of the variables used are as follows: financial health (the adapted z-score calculated as described above); size (meas-ured as the natural logarithm of the number of beneficiaries of each firm, considering that us-ing the logarithm mitigates problems with right-tail asymmetry observed in the data); premium (average annual premium cost per beneficiary, measured as total revenue divided by the aver-age number of beneficiaries); customer satis-faction (the complaints index, measured as the number of complaints per hundred beneficiaries in a given year. It is important to note that this is actually a proxy variable for customer dissat-isfaction. Thus, in the second set of regressions the relationship between customer satisfaction and each of the independent variables showed an opposite sign to that obtained for each of the coefficients).
Figure 1
Average complaints index: 2003-2005.
0
Complaints index
0.05 0.1 0.15 0.2 0.25 0.3 0.35
2003 2004 2005 Year
Results
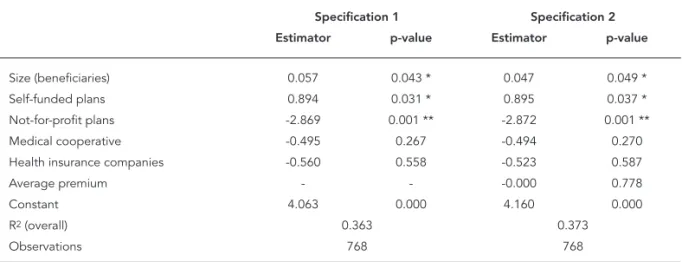
Table 2 shows the results of the GLS panel regres-sion, using the adapted z-score as the dependent variable. The first specification used dummy variables, representing organizational form, and company size as independent variables. The sec-ond specification also used the average annual cost of premium variable. The benchmark for or-ganizational form (omitting the dummy variable during the regression) is commercial insurance companies. Table 2 shows that size is positively and significantly related to a company’s financial health, confirming our first hypothesis on econo-mies of scale.
There is also strong evidence to suggest that self-managed health plans are in better financial health compared to other types of organizational form, particularly non-profit companies that ob-tained the lowest z-score. The results obob-tained after controlling for firm size and average pre-mium show a marked contrast to those shown in Table 1, suggesting that insurance companies and commercial insurers obtain better z-scores, confirming our second hypothesis. Table 1 shows that non-profit organizations charge a lower pre-mium which in turn may have a negative impact on economies of scale in these organizations. Another possible explanation for this result is that non-profit organizations are possibly less focused on financial performance and this has a notable impact on the second component of the z-score (X3) which concerns earnings before interest expenses and taxes.
Table 3 shows the results from the TOBIT panel regression which was used because the use of the least squares method was inappropriate due to the fact that 219 of the 737 valid obser-vations (company-years) showed a complaints index equal to zero.
Natural logarithm was used in order to mitigate problems caused by the pronounced right-tail asymmetry shown by the z-scores dis-tribution obtained for our sample. Also, since the z-score is partially explained by some of the other variables used in the regression, taking its logarithm reduces collinearity problems in the estimation. The correlation between this new indicator, ln(z-score), and each of the other in-dependent variables is not significant at the 10% level. This procedure is thus able to sufficiently mitigate (although not completely avoid) these problems.
There is no evidence in the results shown in Table 3 to suggest that customer satisfaction is related to company size . The same can also be said for the average premium cost. Therefore, hy-pothesis 3 could not be confirmed empirically. Once again, the organizational form benchmark is commercial insurance companies. There is strong evidence to suggest that the complaints index is lower for non-profit organizations (5% significance) and self-managed plans (10% sig-nificance). This evidence is not sufficient to con-firm our fifth hypothesis. When the benchmark is altered to “non-profit”, the coefficient for “self-managed” is not significant and the coefficients obtained for the other organizational forms are
Table 2
Determinants of company fi nancial health.
Specification 1 Specification 2 Estimator p-value Estimator p-value
Size (beneficiaries) 0.057 0.043 * 0.047 0.049 *
Self-funded plans 0.894 0.031 * 0.895 0.037 *
Not-for-profit plans -2.869 0.001 ** -2.872 0.001 **
Medical cooperative -0.495 0.267 -0.494 0.270
Health insurance companies -0.560 0.558 -0.523 0.587
Average premium - - -0.000 0.778
Constant 4.063 0.000 4.160 0.000
R2 (overall) 0.363 0.373
Observations 768 768
positive and significant (results unreported). We thus conclude that customer satisfaction is great-est for self-managed plans followed by non-profit organizations. It is not possible to precisely state the reasons why the level of customer satisfac-tion is on average greater in non-profit organiza-tions and self-managed health plans. However, it is undeniable that these organizational forms share some similarities, such as a major concern with long term sustainability of the organization as opposed to a major orientation towards profit, which is a characteristic of other organizational modalities.
Finally, there is also evidence that better fi-nancial health increases customer satisfaction (or, more precisely, reduces consumer dissatis-faction), which is consistent with our fourth hy-pothesis; however, the statistical significance of this result was 6.8% in specification 2. It seems reasonable to assume that health care providers in better financial health have a greater capacity to provide a wider and better range of medical services, which in turn leads to an increase in lev-els of customer satisfaction.
Robustness tests
In this section we describe three major robust-ness tests. First, we assess whether customer satisfaction is related to spending on marketing, as suggested by Goodman 6. Since spending on marketing is not disclosed by the companies,
we used the ratio administrative expenses/total revenues as a proxy variable for marketing ex-penses. This ratio was suggested by Lemieux 31 and is widely used in the international literature and by ANS to monitor company activities. The premise of this approach is that if these expenses are disproportionably high in one firm compared to others, this may indicate that this particular firm is neglecting its operational function in fa-vor of expenditure on activities that are unrelated to providing health care services.
Second, we performed the tests excluding self-managed plans. This procedure was ad-opted for two reasons: first, in these plans, the beneficiary-insurer relationship is generally built through an employer, which means that the customer probably has direct access for mak-ing complaints, meanmak-ing that the users of these plans are less likely to make formal complaints to ANS. Therefore, our proxy variable for cus-tomer satisfaction (complaints index) is open to measurement error. Second, our variable that measures the premium cost does not include the contribution of the sponsor. Furthermore, premiums for these plans are generally calcu-lated using a different methodology, which could make the premium incomparable to other orga-nizational forms.
Finally, we tested whether our results were resistant to the changes that occurred in the reg-ulatory environment at the end of 2003, which caused the overall number of complaints in
Table 3
Determinants of customer satisfaction.
Specification 1 Specification 2 Coefficient p-value Coefficient p-value
Size 0.004 0.945 0.002 0.975
Financial status - - -0.037 0.068 *
Self-managed -1.180 0.059 * -1.111 0.061 *
Not-for-profit plans -0.477 0.082 * -0.624 0.043 **
Medical cooperative 0.021 0.891 -0.040 0.801
Health insurance companies -0.332 0.481 -0.275 0.644
Premium -0.000 0.557 -0.000 0.503
Constant 0.219 0.041 0.060 0.012
Wald-χ2 (F-prob) 38.9 (0.000) 40.3 (0.000)
Observations 737 737
2004 to increase. To check, we performed TOBIT regressions using only the data from 2005.
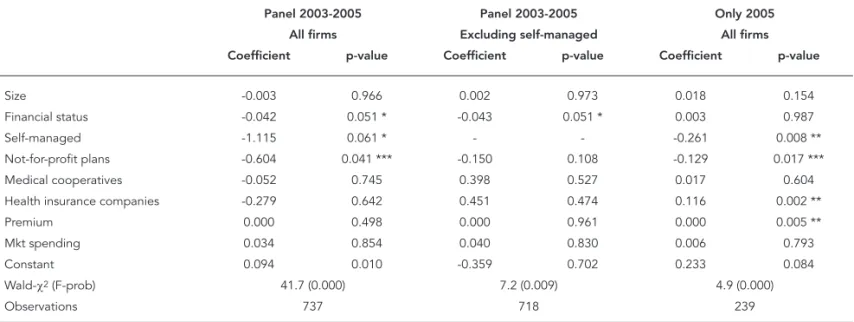
Table 4 shows the results of the robustness tests. The first specification shows that spend-ing on marketspend-ing does not explain the number of complaints (the other two specifications in Table 4 confirm this result), while the results ob-tained for the other variables are qualitatively unchanged from before, confirming that our baseline specification does not suffer from the omission of this variable. It is important to note at this point that an endogeneity problem may exist with regard to spending on marketing. It is perfectly arguable that the decision to invest in marketing campaigns is derived from the need to improve customer’s perception of the quality of the product/service. It is, therefore, difficult to identify a causal relationship between spending on marketing and customer satisfaction. In the future, with the availability of long term time se-ries data, it might be possible to identify causal-ity using, for example, simultaneous equations models that take endogeneity into account.
In the second specification (excluding self-managed plans), there is only a slight change in results compared to the results in Table 3, i.e.: (i) financial health is positively related to customer satisfaction (confirming our fourth hypothesis), and (ii) the level of customer satisfaction in non-profit insurers is greater than that of customers of
other organizational forms. However, statistical significance was lost (slightly above 10%) and the coefficient magnitude is less (-0.150 compared to -0.604 on the previous specification).
The third specification shown in Table 4 in-cludes all types of organizational form but ex-cludes data from 2003 and 2004. Caution should be taken in interpreting these results since the individual characteristics of the companies can-not be identified by this estimation procedure (as can be done with the panel regressions in the previous specifications) and variables that are stable through time, such as size and the average annual premium, tend to gain significance due to possibly biased estimators. In fact, the results shown in Table 4 show a positive and statistically significant relationship between customer dis-satisfaction and the average annual premium that may result from estimation problems. How-ever, through controlling for other variables, we are able to confirm that levels of customer satis-faction in non-profit and self-managed plans can be considered greater than that of customers of the benchmark organizational form (health in-surance companies). It is also interesting to note that levels of customer dissatisfaction are great-est in health insurance companies. Although it is not possible to draw empirical inferences about the reasons for these results, it is possible to ar-gue that the 2003-2004 regulatory reforms caused
Table 4
Robustness tests.
Panel 2003-2005 Panel 2003-2005 Only 2005 All firms Excluding self-managed All firms Coefficient p-value Coefficient p-value Coefficient p-value
Size -0.003 0.966 0.002 0.973 0.018 0.154
Financial status -0.042 0.051 * -0.043 0.051 * 0.003 0.987
Self-managed -1.115 0.061 * - - -0.261 0.008 **
Not-for-profit plans -0.604 0.041 *** -0.150 0.108 -0.129 0.017 ***
Medical cooperatives -0.052 0.745 0.398 0.527 0.017 0.604
Health insurance companies -0.279 0.642 0.451 0.474 0.116 0.002 **
Premium 0.000 0.498 0.000 0.961 0.000 0.005 **
Mkt spending 0.034 0.854 0.040 0.830 0.006 0.793
Constant 0.094 0.010 -0.359 0.702 0.233 0.084
Wald-χ2 (F-prob) 41.7 (0.000) 7.2 (0.009) 4.9 (0.000)
Observations 737 718 239
adverse changes for the costumers of health in-surance companies.
Conclusions
This study investigates the determinants of the financial health and level of customer satisfac-tion in health care providers in Brazil. We use an adapted version of Altman’s z-score as an indica-tor of financial health. The indicaindica-tor of customer satisfaction is an index based on information on customer complaints provided by ANS. The sam-ple consists of 270 health care providers and their operations during the period 2003-2005.
We first identify the importance of the type of organizational form of the health care provider in its financial health. Controlling for other vari-ables, there is strong evidence that non-profit health plans suffer from the poorest financial health and that self-managed plans are in the best financial health. It is also shown that larger firms tend to benefit from economies of scale, since health care providers face high fixed costs. Larger firms also have greater negotiation power when dealing with service providers such as hos-pitals and health care professionals.
It was also possible to identify that the lev-el of customer satisfaction tends to be greater when the health care provider is in better finan-cial health. Controlling for size, premium and spending on marketing, the level of customer satisfaction tends to be greater in non-profit and self-managed health plans. It is arguable that the beneficiaries of self-managed plans have more freedom to choose their favorite medical service provider than customers of other organi-zational forms and that this may be considered valuable advantage. Customers of non-profit plans may be less dissatisfied than customers of other plans for a number of reasons including: a perception that they receive more “humanized” care; a recognition that their health provider is more concerned with providing good medical care than with financial performance, or simply because they expect less from their health care providers given that they pay a lower premium compared to customers of other types of insur-ers; because it is also possible that customers of non-profit plans are less informed than other customers, which results in fewer complaints to ANS.
In contrast to the theory proposed, we found no relationship between spending on marketing and customer satisfaction. However, this may be due to an endogenous relationship between these two variables, which could not be assessed by our specifications due to the nature of the data.
We recognize that the adapted z-score and the complaints index may be imperfect measures of financial health and customer satisfaction, es-pecially of the latter because it is possible that customers use other channels to make com-plaints, such as the consumer protection agency (Procon) linked to state governments instead of ANS which is linked to the central government. Additionally, some types of organizational form are more likely to have direct channels to handle customer complaints (for example, self-managed plans), which reduces the number of complaints made to ANS and most companies have a first-stage channel to handle complaints. It is there-fore reasonable to think that a complaint does not reach ANS when these channels are able to solve the customer’s problem,
It is also important to highlight the limitation of the adapted z-score as a single indicator of financial health. Different health care providers may have distinct strategies and goals. While the managers of a self-managed plan may be con-cerned with long-term financial stability and the quality of the service provided, commercial in-surance companies may drive their efforts mainly towards profitability, sometimes in the short run. In the future, with the availability of long-term time series data, it will be possible to calibrate a model to predict bankruptcy/survival of Brazil-ian health providers, which should give rise to a more accurate measure of financial health.
Resumo
Este artigo analisa a situação financeira das operado-ras de saúde suplementar no Boperado-rasil, de acordo com a modalidade de gestão. Adicionalmente, examina os principais determinantes para a satisfação do consu-midor desses serviços. Como indicador principal de saúde financeira, utiliza-se uma versão adaptada do z-score de Altman. A proxy para satisfação do consumi-dor é o nível de reclamações fundamentadas registra-das junto à Agência Nacional de Saúde Suplementar. Utilizamos uma amostra de 270 operadoras de saúde suplementar para o período 2003-2005, e regressões de dados em painel, com variáveis de controle de merca-do, operacionais e de gestão. Os resultados principais indicam que (1) as operadoras de saúde se beneficiam de economias de escala; (2) as empresas que operam no modelo de autogestão têm situação financeira me-lhor que as demais; (3) as despesas com marketing não impactam a satisfação dos consumidores dos planos de saúde; (4) finalmente, encontra-se também alguma evidência empírica indicando que a boa situação fi-nanceira implica maior satisfação do consumidor.
Planos de Pré-Pagamento em Saúde; Saúde Suplemen-tar; Satisfação dos Consumidores
Contributors
R. F. Schiozer participated in project coordination, data collection, statistic tests and drafting the final version of this article. C. C. Saito and R. Saito collaborated with da-ta collection, sda-tatistic tests and drafting of this article.
Acknowledgments
The authors acknowledge the financial support received from EAESP/FGV (GV-Pesquisa). We are also grateful for the excellent research assistance provided by Graziella Laureano and the comments received from participants during the Enanpad and AIB meetings in 2007 and 2008 respectively.
References
1. Instituto Brasileiro de Geografia e Estatística. Pes-quisa Nacional por Amostra de Domicílios 2008: um panorama da saúde no Brasil. Acesso e utiliza-ção dos serviços, condições de saúde e fatores de risco e proteção à saúde. Brasília: Instituto Brasi-leiro de Geografia e Estatística; 2010.
2. Agência Nacional de Saúde Suplementar. Reso-lução Normativa nº. 139, de 24 de novembro de 2006. Diário Oficial da União 2006; 27 nov. 3. Milan GS, Trez G. Pesquisa de satisfação: um
mo-delo para planos de saúde. RAE-eletrônica 2005; 4(2). http://www.rae.com.br/eletronica/index.cfm ?FuseAction=Artigo&ID=2165&Secao=ARTIGOS& Volume=4&Numero=2&Ano=2005.
4. Badia BD. Característica do plano e satisfação dos beneficiários. São Paulo: Instituto de Estudos em Saúde Supletiva; 2008.
5. Browne MJ, Carson JM, Hoyt RE. Economic and Market Predictors of Insolvencies in the Life-Health Insurance Industry. J Risk Insur 1999; 66:643-59. 6. Goodman E. Freedom of choice enslaves dazed
consumer: a landscape of too many consumer choices. Boston Globe 1992; 29 mar.
7. Booske BC, Sainfort F, Hundt AS. Eliciting consum-er prefconsum-erences for health plans. Health Sconsum-erv Res 1994; 34:839-54.
9. Irvine C. Satisfaction with HMO coverage: an em-pirical study of a medical school’s faculty, staff, and administrators. Hosp Top 2001; 79:14-20. 10. Knutson D, Kind E, Fowlers J, Adlis S. Impact of
report cards on employees: a natural experiment. Health Care Financ Rev 1998; 20:5-27.
11. Scanlon D, Chernew M, McLaughlin C, Solon G. The impact of health plan report cards on man-aged care enrollment. J Health Econ 2002; 21: 19-41.
12. Christianson J, Parente ST, Feldman R. Consumer experiences in a consumer-driven health plan. Health Serv Res 2004; 39:1123-40.
13. Tae-Seale M. Does consumer satisfaction infor-mation matter? Evidence on member retention in FEHBP plans. Med Care Res Rev 2004; 61:171-86. 14. Kolodinsky J. Consumer satisfaction with a
man-aged health care plan. J Consum Aff 1999; 33: 223-36.
15. Davis K, Collins KS, Schoen C, Morris C. Choice matters: enrollees’ views of their health plans. Health Aff 1995; 14:99-112.
16. Figueiredo LF. O processo de regulamentação dos planos e seguros de saúde. Brasília: Agência Nacio-nal de Saúde Suplementar; 2002.
17. Thorpe KE, Knickman JR. Financing for health care. In: Kovner AR, Jonas S, editors. Health care delivery in the United States. New York: Springer; 1999. p. 32-63.
18. Fiegenbaum A, Thomas H. Strategic groups and performance: the US insurance industry, 1970-84. Strategic Management Journal 1990; 11:197-215. 19. Malta DC, Cecílio LCO, Merhy EE, Franco TB, Jorge
AO, Costa MA. Perspectivas da regulação na saú-de suplementar diante dos mosaú-delos assistenciais. Ciênc Saúde Coletiva 2004; 9:1413-23.
20. Ocké-Reis CO. Challenges of the private health plans regulation in Brazil. Brasília: Instituto de Pesquisa Econômica Aplicada; 2004. (Text for Dis-cussion, 1013).
21. Pinto LF, Soranz DR. Planos privados de assis-tência à saúde: cobertura populacional no Brasil. Ciênc Saúde Coletiva 2004; 9:85-98.
22. Médice AC. A medicina de grupo no Brasil. Brasí-lia: Organização Pan-Americana da Saúde; 1991. (Série Desenvolvimento de Políticas de Saúde). 23. Lopes LTA. A diferenciação como vantagem
com-petitiva: um estudo de caso [Dissertação de Mes-trado]. São Paulo: Escola de Administração de Empresas de São Paulo, Fundação Getulio Vargas; 2004.
24. Cutler DM, Zeckhauser RJ. The anatomy of health insurance. Cambridge: National Bureau of Eco-nomic Research; 1999. (Working Paper, 7176). 25. Miller RH, Luft HS. Does managed care lead to
bet-ter or worse quality of care? Health Aff 1997; 16:7-25.
26. Miller RH, Luft HS. HMO plan performance up-date: an analysis of the literature, 1997-2001. Health Aff 2002; 21:63-85.
27. Ashish C. Healthcare client satisfaction. Hosp Top 2001; 79:5-6.
28. Buchmueller TC, Feldstein PJ. Consumers’ sen-sitivity to health plan premiums: evidence from natural experiment in California. Health Aff 1996; 15:143-51.
29. Buchmueller TC, Feldstein PJ. The effect of price on switching among health plans. J Health Econ 1997; 16:231-47.
30. Altman RI. Predicting financial distress of compa-nies: revisiting the z-score and Zeta® models. 2000. http://pages.stern.nyu.edu/~ealtman/Zscores.pdf (accessed on 30/Sep/2009)
31. Lemieux J. Perspective: administrative costs of pri-vate health insurance plans. Washington DC: Cen-ter for Policy and Research; 2005.
Submitted on 09/Sep/2009