PROTEOLYSIS OF PRATO TYPE CHEESE
PRODUCED USING ULTRAFILTRATION
Leila Maria Spadoti*; José Raimundo Ferreira Dornellas; Salvador Massaguer Roig
UNICAMP/FEA - Depto. de Tecnologia de Alimentos, C.P. 6121 - 13083-970 - Campinas, SP - Brasil. *Corresponding author <[email protected]>
ABSTRACT: The application of milk ultrafiltration technology for cheese manufacture presents several advantages. However, it also influences proteolysis and, consequently, cheese ripening. The effects of five different processing methods for Prato cheese were evaluated with respect to the time evolution of the extent and depth of proteolysis indexes (EPI and DPI). The following treatments (T) for cheese production were studied: T1 – without ultrafiltration (standard); T2, T3, T4 and T5 – using milk concentrated by ultrafiltration (UFCM) and respectively: T2 – without pre-fermentation of the UFCM; T3 – pre-fermentation of 10% of the UFCM; T4 – pre-fermentation of 20% of the UFCM, and T5 – pre-fermentation of 20% of the UFCM plus indirect heating. Treatments affected the EPI and DPI of the cheeses (T1 lower values for EPI and DPI and T4 higher values for EPI and DPI). The time influenced the extent and depth of proteolysis indexes. Key words: milk, membrane technology, ripening
PROTEÓLISE DE QUEIJO TIPO PRATO PRODUZIDO
UTILIZANDO ULTRAFILTRAÇÃO
RESUMO: A aplicação da tecnologia de ultrafiltração do leite para fabricação de queijos apresenta inúmeras vantagens, porém, ela também influi na proteólise, e conseqüentemente na maturação dos queijos. Foram avaliados os efeitos de cinco diferentes métodos de processamento de queijo Prato sobre a evolução dos índices de extensão e profundidade da proteólise (EPI e DPI). Os seguintes tratamentos (T) para produção de queijo foram estudados: T1 – sem ultrafiltração (padrão); T2, T3, T4 e T5 – usando leite concentrado por ultrafiltração (UFCM) e respectivamente: T2 – sem pré-fermentação do UFCM, T3 – pré-fermentação de 10% do UFCM; T4 – pré-fermentação de 20% do UFCM e T5 – pré-fermentação de 20% do UFCM com aquecimento indireto. O tratamento afetou o EPI e o DPI dos queijos (T1 menores valores para EPI e DPI e T4 maiores valores para EPI e DPI). O tempo influenciou os índices de extensão e profundidade da proteólise. Palavras-chave: leite, tecnologia de membrana, maturação
INTRODUCTION
Prato cheese, typical from Brazil, is produced by enzymatic coagulation and partial cooking stage, carried out by the addition of hot water or by heating of the vat. It must be ripened for 25 days minimum (Souza, 1960; Nova legislação…, 1998).
For most cheeses, proteolysis is the main indica-tor of ripening, usually expressed by the extent and depth of proteolysis indexes (EPI and DPI). EPI reflects the per-cent of decomposed protein molecules, mostly to large peptides, and DPI the percent to which these large pep-tides are degraded into smaller molecules (Baldini, 1998; Farkye & Fox, 1990; Sousa et al., 2001; Wolfschoon-Pombo, 1983).
Milk concentrated by ultrafiltration can alter the cheese ripening process in various ways, as a result of the residual whey proteins content and their state; coagu-lation pHs; the final curd pH after pressing and salting; the ratio of coagulant/raw milk or coagulant/casein
be-ing transformed on cheese (Green et al., 1981; Hickey et al., 1983; Koning et al., 1981; Lelievre & Lawrence, 1988; Renner & Abd El-Salam, 1991). Other factors such as moisture, temperature, salt content etc, which normally influences cheese ripening, also will influence quality of Prato cheese.
Ribeiro (1996) produced Prato cheese from ultra filtration-concentrated milk (UFCM) with various concen-tration factors (CF) (1.5:1; 2.5:1; 3.5:1 and 5.0:1) and obtained cheeses with typical organoleptic and textural characteristics, and better yield than traditional process. However it was only possible to obtain adequate texture with a CF = 5:1 and by pre-fermenting 10% of the retentate with a lactic culture.
MATERIAL AND METHODS
Milk ultrafiltration
Whole raw milk (250 kg) from Campinas Region (State of São Paulo – Brazil), was heat treated at 68ºC for 2 min. Part of this milk (50 kg) was cooled to 35ºC and used to produce a batch of standard Prato cheese (T1). The remaining 200 kg were cooled to 55ºC and sub-mitted to concentration by ultrafiltration on the same day the milk was delivered to the pilot plant.
The milk was concentrated with Carbosep min-eral membranes (Tech-sep, Soc. An. – Groupe Rhône Poulenc, Saint-Maurice de Beynost, France) with a mo-lecular mass cut-off of 20,000 Daltons, inlet and outlet pressures of 2.45 × 10⁵ and 1.47 × 10⁵ Pa respectively, up to CF 4:1. The ultrafiltration concentration process last approximately 10 hours. The ultrafiltered milk was then pasteurized at 62ºC for 30 min, cooled to 7ºC and divided into four equal parts to be used for manufacture of cheeses T2, T3, T4 and T5 on the next day.
Cheese manufacture
Three processing procedures were carried out on different dates. In each processing, five batches of Prato cheese were manufactured.
In for the UFCM, manufactured cheese (T2, T3, T4 and T5), after cooling the UFCM, a certain portion was removed from each batch (0% from T2; 10% from T3 and 20% from T4 and T5) and submitted to pre-fer-mentation with mesophilic starter (G3 MIX 6-VISBYVAC®
-B50 - composed of multiple mixed strains ofLactococcus lactis ssp. lactis and Lactococcus lactis
ssp. cremoris) at 32ºC. The rest of the UFCM was stored at 5 ± 1ºC until the next day.
After the separated portions had reached pH 5.0, they were mixed with their respective UFCM batches and heated to 35ºC to start the processing of the cheese. Both the standard cheese and those prepared from UFCM were manufactured according to regular processing of Prato cheese.
For the standard cheese, calcium chloride (0.4 mL kg-1 milk of a 50% w/w solution) was added to the milk already heated to 35ºC, followed by the addition of freeze dried, ready to use starter (one tenth of the quantity rec-ommended by the manufacturer), annatto dye (Bixa orellana) (Chr. Hansen Ind. e Com. Ltda, Valinhos, SP, Brazil) and rennet (calf rennet – 90% chymosin) (BV Ind. e Com. Ltda, Valinhos, SP, Brazil) sufficient to coagu-late the milk at 35ºC.
For cheeses manufactured from UFCM, starter, dye and coagulating agent were used in quantities equiva-lent to what would be used if UFCM were converted into milk, but without the addition of calcium chloride. After coagulation (40 min), the curd was cut into 0.4 cm × 0.5 cm cubes, and allowed to rest for 5 min. The curds were
then submitted to slow continuous mixing for 20 min (1st mixing), followed by removal of part of the whey and fur-ther heating of the curd (2nd
mixing) to 41ºC with the ad-dition of hot water, to obtain the correct consistency for Prato cheese.
For cheeses obtained from UFCM, no 1st mixing or whey removal was carried out, the curd being heated soon after the resting period, resulting in 30-min reduc-tion of the processing time. For the cheeses T2, T3 and T4, the curd was heated directly by the addition of hot water. For T5, the curd was heated indirectly. After heat-ing, curds were pre-pressed for 20 min in a draining press with twice the weight of the curd, and then placed in plas-tic molds and pressed for 6 h in a verplas-tical press, with stainless steel weights. The cheeses were turned after 20 min during pressing and then every hour until removed from the press. The weights were gradually increased from 10 to 20 times the weight of the curd. After press-ing was completed cheeses were stored at 7 ± 1ºC and the next day placed in a 20% NaCl solution for a period of 8 h at 4 ± 1ºC. Finally, cheeses were dried at 7 ± 1ºC, weighed, sealed under vacuum in plastic bags and stored at 7 ± 1ºC for 45 d.
Analysis
Total nitrogen (TN) was determined by Kjeldahl method AOAC (1995). Soluble nitrogen at pH 4.6 and soluble nitrogen in 12% trichloroacetic acid (TCA) were determined according to Barbano et al. (1991) and AOAC (1995), respectively. Total solid (TS) content was deter-mined using AOAC method 925.23 (AOAC, 1995) and Moisture (M) content using the equation: M = 100 – TS. The values for pH were determined by the potentiomet-ric method and those for titratable acidity (TA) and salt content using the AOAC method 920.124 (AOAC, 1995) and the Volhard method (Richardson, 1985), respectively. The salt content in the moisture (S/M) was calculated from equation: S/M = (salt x 1000)/moisture. All the above determinations were carried out in triplicate on the cheeses after 10 d. The cheeses were monitored for pH, TA, and proteolysis during 45 days. The analyses were carried out after 10, 25 and 45 days of refrigerated stor-age (D10, D25 and D45). Proteolysis was evaluated by the extent and depth of proteolysis indexes using the fol-lowing equations:
EPI = (% soluble nitrogen at pH 4.6) x 100 (1) % total nitrogen
DPI = (% solubre nitrogen in 12% TCA) x 100 (2) % total nitrogen
Experimental design and statistical analysis
and time the sub-plots. The batches of milk constituted the blocks. Three batches were carried out, one for each complete replicate. Data were submitted to analysis of variance, using the procedure of multiple comparisons between pairs of means (Tukey’s method) on the tenth day after manufacture of the cheeses. The data for the analyses of pH, titratable acidity and proteolysis indexes were evaluated in the same way as those for composition, on the tenth, twenty-fifth and forty-fifth days of storage. All the calculations were carried out with the aid of the SAS statistical program (SAS System for Windows, Re-lease 8.02 – SAS Institute Inc, 2001).
RESULTS AND DISCUSSION
Cheese composition
The use of ultrafiltration tended to increase pro-tein concentration of the cheese (whey propro-teins and caseins), although treatments did not differ among them-selves (Table 1). One of the advantages of the use of ul-trafiltration is the inclusion of whey proteins in the cheese, as a result of the decrease or elimination of the whey removal stage (Hydamaka et al., 2001). Also the values of salt in moisture showed no difference for the treatments (Table 1). According to Fox et al. (2000), they were in the normal range for cheeses similar to Prato cheese which avoid flavor defects due to improper salt-ing.
Evolution of Titratable Acidity and pH values
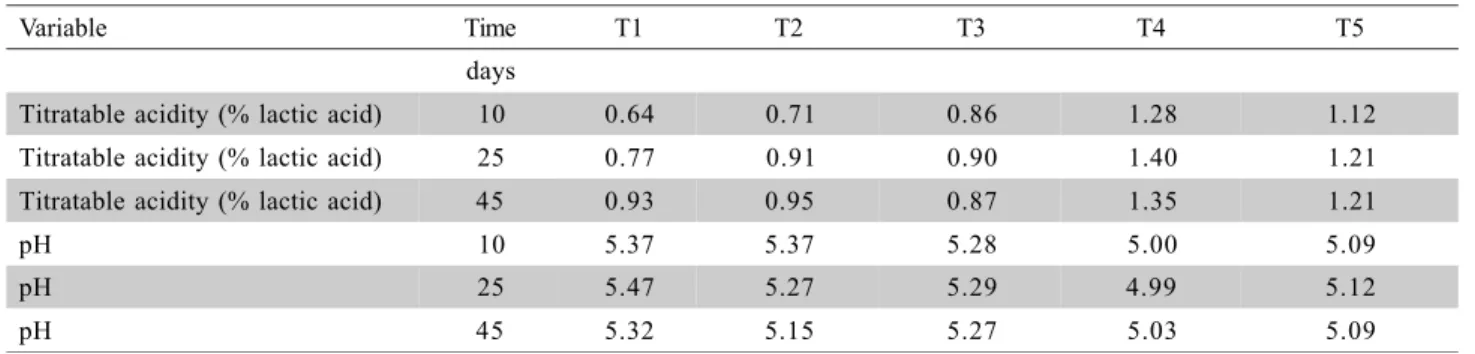
There was no interaction for titratable acidity x time (P = 0.24), and the values for TA of the cheeses showed variations with time (P < 0.01) and with the type of treatment adopted (P = 0.02). Between the dates D10 and D25, an increase of the treatments TA was observed, although there were no differences between days D25 and D45. Tukey’s test with respect to the treatments showed that T1 did not differ from treatments T2, T3 and T5, but differed from T4; T4 also did not differ from treatments T2, T3 and T5.
There was no interaction of pH data x time (P = 0.75) and the pH values of the different cheeses were not influenced by the factor time (P = 0.45). However they were influenced (P = 0.03) by the type of treatment. T1 did not differ from treatments T2, T3 and T5, but differed from T4; T4 also did not differ from treatments T2, T3 and T5 (P > 0.05).
The behavior of the pH and titratable acidity of the cheeses during storage (Table 2) showed similar val-ues to those observed by Cichoscki et al. (2002). For a period of 60 days, Cichoscki et al. (2002) evaluated the evolution of the pH and TA of 18 batches of Prato cheese, manufactured in eight municipalities in the region of Alto Uruguai (State of Rio Grande do Sul, Brazil), and showed that the pH of the cheeses did not vary during storage, remaining in the range from 5.3 to 5.5 (as the standard cheese in this experiment). They also observed that the
Variable T1 T2 T3 T4 T5
%
Total solids 51.77ab 48.77b 52.89ab 54.95a 55.47a
Total protein 18.42a 21.38a 22.51a 21.86a 22.24a
Salt 1.60a 1.67a 1.48a 1.36a 1.44a
Moisture 48.23ab 51.23a 47.11ab 45.05b 44.53b
Salt/Moisture 3.31a 3.26a 3.14a 3.09a 3.23a
Table 1 - Average composition (n = 3) of the ten day-old cheeses obtained: without ultrafiltration (T1) and with ultrafiltration (CF 4:1): without pre-fermentation (T2), with 10% pre-fermentation (T3), with 20% pre-fermentation (T4) and with 20% pre-fermentation and indirect heating (T5).
*Means with the same letter, in the same line, do not differ (P> 0.05) by Tuckey’s multiple comparison method.
Variable Time T1 T2 T3 T4 T5
days
Titratable acidity (% lactic acid) 10 0.64 0.71 0.86 1.28 1.12
Titratable acidity (% lactic acid) 25 0.77 0.91 0.90 1.40 1.21
Titratable acidity (% lactic acid) 45 0.93 0.95 0.87 1.35 1.21
pH 10 5.37 5.37 5.28 5.00 5.09
pH 25 5.47 5.27 5.29 4.99 5.12
pH 45 5.32 5.15 5.27 5.03 5.09
TA values increased during the first month of storage, but that the TA values did not vary between 30 and 45 days of storage.
Evolution of proteolysis
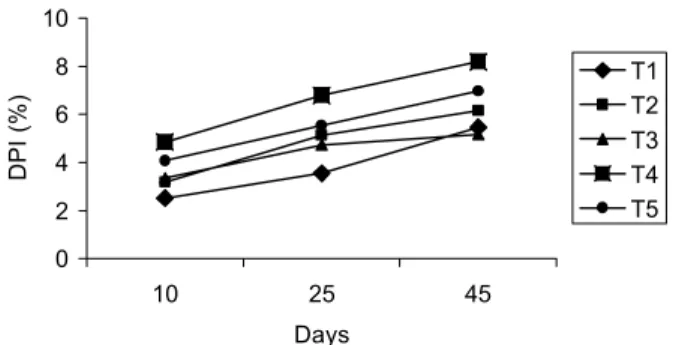
There was no treatment X time interaction for EPI and DPI (P = 0.88 and P = 0.33, respectively), and the values for EPI and DPI of the cheeses showed variation with storage time (P< 0.01) and with the type of treat-ment (P < 0.01 and P= 0.04, respectively). The two in-dexes increased during storage, the values for D10<D25<D45 in both cases (Figures 1 and 2).
Extent of proteolysis
The EPI values of cheeses T3, T4 and T5 did not differ, even though in absolute terms cheeses T4 and T5 showed the highest indexes. In addition, cheese T3 did not differ from cheese T2. The standard cheese showed the lowest EPI, differing from the other treatments.
Wolfschoon-Pombo (1983) and Baldini (1998) found EPI values for Prato cheese in the range of 11.9 to 14% after about one month of storage. The cheese T1 presented an EPI value near to 14% after 25 days of storage, but the cheeses from the other treatments pre-sented higher values than the standard (Figure 1). These results contradicts data from (Lelievre & Lawrence, (1988); and Renner & Abd El-Salam, (1991) who re-ported that cheeses manufactured from UFCM tended to present less proteolysis than cheeses made from non-ultrafiltered milk.
In the break up of casein into large peptides, chymosin is the main enzyme responsible for cheese pro-teolysis (Fox et al., 2000). Therefore, EPI depends on the quimosin concentration used, the amount of quimosin re-tained on the curd after the whey removal, and on its ac-tivity as function of the final curd pH, being that both, the percent retention of this enzyme in the cheeese and its activity during ripening, are pH dependente and
fa-vored by low pH values (Walstra et al., 1999). The quimosin action, besides pH, is also influenced by the presence of whey proteins, which tend to dificult quimosin access to caseins (Lelievre & Lawrence, 1988; Walstra et al., 1999).
Therefore, the behavior of the cheeses probably resulted from the pH values presented by the cheeses from the different treatments, during storage (Table 2). Thus, cheeses showing not only lower pH values (T4 and T5), but also larger whey protein content, presented greater EPI values; highest pH value (T1), were associated to lowest EPI value.
Depth of proteolysis
The DPI values of cheeses T2, T3, T4 and T5 did not differ within the group, the T4 cheese showing the highest index followed by the T5 cheese and then by cheeses T3 and T2. However, cheese T3 at 25 and 45 days of ripening presented a even lower DPI than cheese T2 made without pre-fermentation, and cheese T2 made without pre-fermentation did not differ from cheeses T3, T4 and T5. The standard cheese (T1) pre-sented the lowest DPI, although not different from cheeses T2, T3 and T5.
The depth of proteolysis in a cheese is mainly determined by the action of enzymes from the lactic starter (Walstra et al., 1999). Thus cheeses T4 and T5 probably presented greater DPI values due to a greater development of the lactic starter.
Analyses carried out by Baldini (1998) in Prato cheese manufactured with non-ultrafiltered milk regis-tered the following DPI values: 4.18% for cheeses with one week of storage, 6.57 after four weeks of storage, and 7.26 after six weeks. These values are greater than those obtained for the standard cheese in this experiment, al-though close to those determined for the cheeses T4 and T5 (Figure 2).
Figure 1 - Evolution of the extent of proteolysis index (EPI) during storage of the cheeses obtained: without ultrafiltration (T1) and with ultrafiltration (CF 4:1): without pre-fermentation (T2), with 10% pre-pre-fermentation (T3), with 20% fermentation (T4) and with 20% pre-fermentation and indirect heating (the only one) (T5).
0 5 10 15 20 25 30
10 25 45
Days
EPI (%)
T1 T2 T3 T4 T5
Figure 2 - Evolution of the depth of proteolysis index (DPI) during storage of the cheeses obtained: without ultrafiltration (T1) and with ultrafiltration (CF 4:1): without pre-fermentation (T2), with 10% pre-pre-fermentation (T3), with 20% fermentation (T4) and with 20% pre-fermentation and indirect heating (the only one) (T5).
0 2 4 6 8 10
10 25 45
Days
DPI (%)
CONCLUSIONS
The possibility of obtaining Prato cheese from milk concentrated by ultrafiltration at a concentration fac-tor of 4:1, was confirmed with a ripening behavior, evalu-ated by the extent and depth of proteolysis indexes, more intense than a standart Prato cheese made by the tradi-tional process, and similar to values reported on the lit-erature for Prato cheese made from milk by the traditional process. The modifications alow the acceleration or re-tardation of proteolysis of Prato cheese manufactured from milk concentrated by ultrafiltration, which is impor-tant for the industry either for when it is of interest to increase the commercialization window, during the sea-son of larger milk production, as well for when it is of interest to reduce the time between production and com-mercialization.
ACKNOWLEDGEMENTS
To CNPq (doctorate scholarships authors 1 and 2) and to FAPESP (Research grant 00/14079-8).
REFERENCES
ASSOCIATION OF ANALYTICAL CHEMISTS-AOAC.Official methods of analysis of AOAC international. Washington: AOAC, 1995. 109p. BARBANO, D.M.; LYNCH, J.; FLEMING, J.R. Direct and indirect determination of true protein content of milk by Kjeldahl analysis: collaborative study. Journal of the AOAC, v.74, p.281-288, 1991. BALDINI, V.L.S. Proteólise em queijo tipo Prato durante a maturação. São
Paulo: USP/FCF, 1998. 208p. (Tese - Doutorado).
CICHOSCKI, A.J.; VALDUGA, E.; VALDUGA, A.T.; TORNADIJO, M.E.; FRESNO, J.M. Characterization of Prato cheese, a Brazilian semi-hard cow variety: evolution of physico-chemical parameters and mineral composition during ripening. Food Control, v.13, p.329-336, 2002. FARKYE, N.Y.; FOX, P.F. Objective indices of cheese ripening. Trends in
Food Science & Technology, v.1, p.37-40, 1990.
FOX, P.F.; GUINEE, T.P.; COGAN, T.M.; McSWEENEY, P.L.H. Fundamentals of cheese science. Gaithersburg: Aspen Publishers, 2000. 587p.
GREEN, M.L.; GLOVER, F.A.; SCURLOCK, E.M.W.; MARSHALL, R.J.; HATFIELD, D.S. Effect of use of milk concentrated by ultrafiltration on the manufacture and ripening of Cheddar cheese. Journal of Dairy Research, v.48, p.333-341, 1981.
HICKEY, M.W.; VAN LEEUWEN, H.; HILLIER, A.J.; JAGO, G.R. Amino acid accumulation in cheddar cheese manufactured from normal and ultrafiltered milk. Australian Journal of Dairy Technology, v.38, p.110-113, 1983.
HYDAMAKA, A.W.; WILBEY, R.A.; LEWIS, M.J.; KUO, A.W. Manufacture of heat and acid coagulated Cheese from ultrafiltered milk retentates.Food Research International, v.34, p.197-205, 2001. KONING, P.J.; BOER, R.; BOTH, P.; NOOY, P.F.C. Comparison of
proteolysis in a low fat semi-hard type of cheese manufactured by standard and by ultrafiltration techniques. Netherlands Milk and Dairy Journal, v.35, p.35-46, 1981.
LELIEVRE, J.; LAWRENCE, R.C. Manufacture of cheese from milk concentrated by ultrafiltration. Journal of Dairy Research, v.55, p.465-478, 1988.
NOVA LEGISLAÇÃO de produtos lácteos e de alimentos para fins especiais, diet, light e enriquecidos. São Paulo: Fonte Comunicações e Editora, 1998. 212p.
RENNER, E.; ABD EL-SALAM, M.H. Application of ultrafiltration in the dairy industry. London: Elsevier Applied Science, 1991. 371p. RIBEIRO, E.P. Aplicação da ultrafiltração de leite no processo de fabricação
de queijo tipo prato. Campinas: UNICAMP/FEA, 1996. 144p. (Tese -Doutorado).
RICHARDSON, G.H. Standard methods for examination of dairy products. Washington: APHA, 1985. p.339-344.
SAS INSTITUTE INC. Statistical analysis systems. Version 8.02, Cary, 2001.
SOUZA, E.A. Tecnologia da fabricação de queijos. Juiz de Fora: Editora Lar Católico, 1960. 116p.
SOUSA, M.J.; ARDO, Y.; McSWEENEY, P.L.H. Advances in the study of proteolysis during cheese ripening. International Dairy Journal, v.11, p.327-345, 2001.
WALSTRA, P.; GEURTS, T.J.; NOOMEN, A.; JELLEMA, A.; VAN BOEKEL, M.A.J.S. Dairy technology. New York: Marcel Dekker, 1999. 726p.
WOLFSCHOON-POMBO, A.F. Índices de proteólise em alguns queijos brasileiros.Boletim do Leite, v.55, p.1-8, 1983.