FREE THEMES
1 Departamento de Alimentos e Nutrição, Universidade Federal de Mato Grosso (UFMT). Av. Fernando Corrêa da Costa 2367, Boa Esperança. 78060-900 Cuiabá MT Brasil. [email protected] 2 Departamento de Epidemiologia, Instituto de Medicina Social, Universidade do Estado do Rio de Janeiro.
3 Departamento de Estatística, Instituto de Ciências Exatas e da Terra, UFMT.
Self-reported dyslipidemia in central-west Brazil:
prevalence and associated factors
Abstract Lipid disorders are risk factors for ath-erosclerotic disease and its control may reduce morbidity and mortality from coronary artery disease. Knowledge of the factors associated with this injury may subsidize campaigns to encour-age change in the population’s lifestyle. The ob-jective of this study is to estimate the prevalence of dyslipidemia and to identify associated factors. Cross-sectional population-based study, with in-dividual data from the Telephone Survey on Risk Factors and Protection for Chronic Diseases Sur-veillance System (VIGITEL). It included 7,975 individuals of both sexes, aged ≥ 18 years living in state capitals in the central-west of Brazil, in the year 2009. Associations were estimated using Poisson regression. The prevalence of dyslipid-emia was 15%, increased with age (p = < 0.01) did and not differ significantly according to sex. After adjustments, the variables that were direct-ly associated with the outcome were overweight (p = < 0.01), obesity (p = < 0.01) and self-rated health as poor (p = < 0.01). Regular consumption of bean (≥ 5 days/week) was inversely associated with the prevalence of dyslipidemia (p = < 0.01). The prevalence of dyslipidemia in the central-west of Brazil was increased with age and was associ-ated with bean consumption, excess weight (over-weight and obesity) and self-rated health as poor. Key words Dyslipidemias, Prevalence, Informa-tion systems, Risk factors
Lídia Pitaluga Pereira 1
Rosely Sichieri 2
Neuber José Segri 3
Regina Maria Veras Gonçalves da Silva 1
P
e
r
e
ir
Introduction
The World Health Organization (WHO)1 esti-mates that more than 20 million people will die from cardiovascular diseases by 2030. In Brazil, cardiovascular diseases were the second leading cause of death based on hospital admission data from the Brazilian National Health System in 20122.
Dyslipidemias are chronic conditions that affect cardiovascular risk3and are widely recog-nized as associated with atherosclerotic disease4.
Environmental factors play an important role in the genesis of dyslipidemias. Continu-ous monitoring of key risk indicators can pro-vide data to support health policies to promote healthy lifestyles.
Studies on the prevalence of dyslipidemias based on population surveys are scarce in Brazil, possibly because of their high cost, limited avail-ability of respondents and use of invasive mea-surements.
Self-reported surveys are an effective ap-proach to health monitoring. Studies have showed that self-reported and measured values are highly correlated, which allows to making approximate estimates5. In 2006, a health monitoring system was implemented in Brazil, the Telephone-based Surveillance System of Risk and Protective Fac-tors for Chronic Diseases (VIGITEL). VIGITEL conducts annual surveys for monitoring chronic diseases in state capitals of the 26 states and the Federal District in Brazil6.
The aim of this study was to estimate the prevalence of self-reported dyslipidemia in cen-tral-west Brazil and to assess associated factors.
Methods
Cross-sectional population-based study con-ducted using VIGITEL data. Our sample includ-ed 7,975 female and male respondents aginclud-ed ≥18 years living in state capitals in the central-west macroregion of Brazil in 2009.
Data on self-reported dyslipidemia was col-lected between 2006 and 2009. A second round of data collection was conducted in 2013, but microdata has not yet become available. Thus, we analyzed the most recent data available for the outcome of interest.
VIGITEL used probability sampling to select people aged ≥18 years who lived in a residence with at least one landline telephone in the sur-vey year. The minimum sample size for each
city was 2,000 respondents selected from 5,000 households. Details of sampling plan and pro-cedures and weighting propro-cedures are available elsewhere6,7.
There were included in the study both female and male respondents aged ≥ 18 years. Women who reported being pregnant at the time of in-terview were excluded.
In 2009, there were interviewed 54,367 re-spondents using VIGITEL, of which 8,046 lived in central-west Brazil (2,010 in the Federal Dis-trict, 2,011 in Goiânia, 2,012 in Cuiabá and 2,013 in Campo Grande). We excluded 71 pregnant women and thus our final sample consisted of 7,975 respondents.
Self-reported dyslipidemia was the dependent variable of this study collected using the follow-ing question, “Have you been told by your doctor that your cholesterol or triglycerides are high?.” Thus, the outcome of interest denotes a previous medical diagnosis of dyslipidemia based on high levels of cholesterol or triglycerides in the blood.
The independent variables included demo-graphic characteristics (gender, age, race/skin color, education level, marital status, employ-ment status in the last three months); lifestyle information (alcohol use/excessive alcohol use, consumption of foods such as beans, red meat, red meat with fat, chicken skin, whole milk, soft drinks or processed juices and other variables as-sociated with food intake such as recommended regular consumption of fruit and vegetables, salt adding after meal preparation, and eating out of home, in addition to TV watching and time spent watching TV, smoking and number of cigarettes smoked, physical activity, types of physical activ-ities, leisure-time physical activity and/or active commuting); self-rated health; and weight clas-sification.
Excessive alcohol use was defined as consum-ing four or more drinks of beer, wine or spirits for women and five or more drinks of beer, wine or spirits for men on the same occasion in the last 30 days.
Regular consumption of fruit and vegetables was defined as eating five or more servings a day of fruit and vegetables on five or more days a week. For estimating the recommended total dai-ly consumption of fruit and vegetables, each fruit or cup of fruit juice was considered equivalent to a serving. It was set a maximum of three daily servings of fruit, one serving of juice, and four daily servings of vegetables7.
aúd
e C
ole
tiv
a,
20(6):1815-1824,
2015
physical activity for at least 30 minutes on five or more days a week or vigorous physical activity for at least 20 minutes on three or more days a week. Work or school commuting by cycling or walking was also included when people engaged at least 30 minutes a day7.
The variable self-rated health was categorized as very good, good, fair, poor and very poor. For the multivariate analysis, it was dichotomized as either good (very good / good) or poor (fair / poor / very poor).
The WHO Body Mass Index (BMI) classi-fication8 was used for weight categorization in different age groups (adolescents [18–19 years old]; adults [20–59 years old] and elderly [≥ 60 years old]). For adolescents, BMI was categorized by gender and age as underweight (< –2); nor-mal weight (≥ –2 and ≤ +1); overweight (>+1 and ≤ +2); and obesity (> +2). BMI values were expressed as z-scores9. For adults, we defined BMI cutoff points as follows: <18.5 kg/m2 (un-derweight); ≥ 18.5 and <25.0 kg/m2 (normal weight); ≥ 25.0 and <30.0 kg/m2 (overweight); and ≥ 30.0 kg/m2 (obesity). For the elderly, we used BMI cutoff points as proposed by Lip-schitz10 and recommended by WHO8: < 22.0 kg/ m2 (underweight); ≥ 22.0 and < 27 kg/m2 (nor-mal weight); and ≥ 27.0 kg/m2 (overweight).
For all analyses, weighting was applied to ac-count for differences in sociodemographic sample composition (people aged ≥ 18 years) at each cap-ital city based on information obtained from the 2000 Population Census. We performed data anal-yses using Stata version 11 with svy commands for weighting factors. The distribution of the vari-ables was described as proportion/prevalence (%) and 95% confidence intervals (95% CIs).
We conducted a bivariate analysis to test the association of dyslipidemia with sociodemo-graphic and lifestyle variables, self-rated health, and weight classification by estimating the prev-alence of dyslipidemia (P) as well as crude preva-lence ratios (PR) and related 95% CIs.
A multivariate Poisson regression model was constructed including the variables of interest in hierarchical blocks as proposed by Victora et al.11 Sociodemographic variables were the most distal factors included at level 1, followed by life-style variables at level 2, and self-rated health and weight classification at level 3. Those variables with p-value ≤ 0.20 in the bivariate analysis were included. For the final model, a significance level of 5% was set.
VIGITEL survey was approved by the Nation-al Board of HeNation-alth through the Brazilian Ministry
of Health National Research Ethics Committee. Respondents gave their free informed verbal con-sent before participating in the telephone-based interview. The present study was approved by the Research Ethics Committee at Júlio Müller Uni-versity Hospital under protocol number 331,226, on July 10, 2013.
Results
We analyzed data from 7,975 respondents, of which 52.6% were female, mean age of 44.4 years (SD = 16.4), and living in state capitals in cen-tral-west Brazil. The prevalence of self-reported dyslipidemia was 15% (95% CI 13.5–16.5).
The bivariate analysis of sociodemographic variables showed no difference in prevalences between female and male respondents (PR 1.09; 95% CI 0.89–1.34). However, it evidenced a di-rect association of dyslipidemia with age, being more prevalent among one-third of the respon-dents aged ≥ 55 years. Level of education was not associated with dyslipidemia (PR 1.03; 95% CI 0.84–1.25). The prevalence of dyslipidemia was 61% higher (PR 1.61; 95% CI 1.32– 1.97) among those who reported being unemployed com-pared to those employed in the last three months (Table 1).
Regarding lifestyle variables, we found an inverse association of dyslipidemia with weight training (PR 0.66; 95% CI 0.44–0.98) and soccer playing (PR 0.32; 95% CI 0.18–0.59). Leisure-time physical activity and active commuting were also inversely associated with dyslipidemia, being 29% more prevalent among those who did not report them (PR 0.71; 95% CI 0.54–0.89). In addition, the prevalence of dyslipidemia was higher among respondents who reported watching TV every day (PR 1.31; 95% CI 1.01–1.68) compared to those who did not report it (Table 2).
P
e
r
e
ir
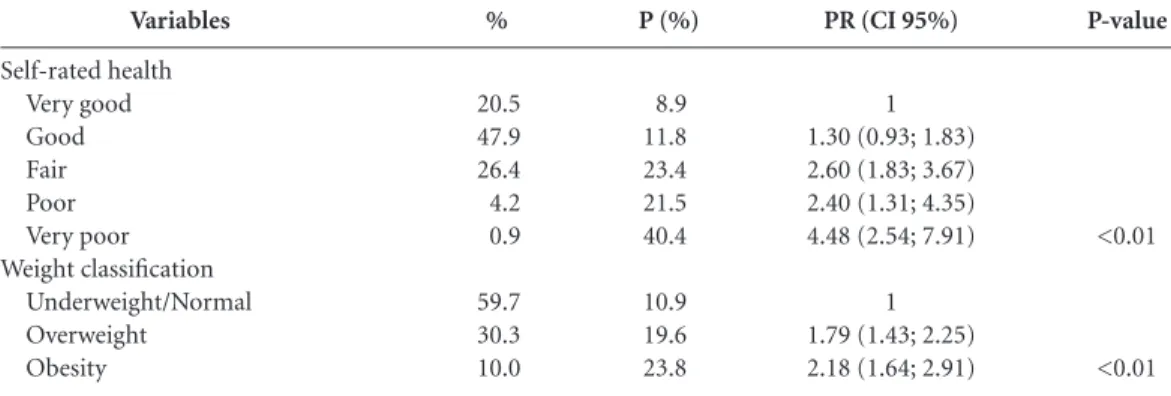
The bivariate analysis also showed a lin-ear increase in the prevalence of dyslipidemia with self-rated health, being three times as high among those who rated their health as very poor compared to those who rated it very good (PR 4.48, 95% CI 2.54–7.91). A similar trend of linear increase (p<0.01) was seen for weight classifica-tion with a dose-response gradient between dys-lipidemia and the magnitude of excess weight: PR 1.79 (95% CI 1.43–2.25) for overweight and PR 2.18 (95% CI 1.64–2.91) for obesity (Table 4).
In the multivariate analysis, only age showed a direct linear association with dyslipidemia at level 1 (sociodemographic variables). The vari-able gender remained in the model for it has an explanatory power for the outcome of interest regardless of significance level. After adjusting for level 1 variables, consumption of beans was the single level 2 (lifestyle) variable that was
asso-ciated with dyslipidemia. Dyslipidemia was 32% more prevalent (PR 1.32; 95% CI 1.06–1.65) among respondents who did not report regular consumption of beans (≥ 5 days a week) com-pared to those who reported it. After adjusting for level 1 and 2 variables the most proximal factors that were significantly associated with dyslipidemia were self-rated health and weight classification. Dyslipidemia was 49% more prev-alent among respondents classified as overweight than those underweight / normal weight (OR 1.49; 95% CI 1.20-1.84) and 83% more prevalent (PR 1.83; 95% CI 1.44-2.31) among obese than those in the reference category. Respondents who self-rated their health as poor (fair / poor / very poor) had a prevalence of dyslipidemia 56% higher (OR 1.56; 95% CI 1.15–2.12) than those who rated it as good and very good (Table 5).
Variables
Gender Male Female Age (years)
18 – 24 25 – 34 35 – 44 45 – 54 55 – 64 65
Race/skin color White Non-white Education level (years)
0 – 8 9 e + Marital status
Married Not married City
Cuiabá Campo Grande Goiânia Distrito Federal
Empolyed (last three months) Yes
No
%
47.4 52.6
23.6 27.1 21.6 13.9 7.7 5.9
35.3 64.7
52.2 47.8
52.6 47.4
11.6 15.3 26.9 46.2
69.9 30.1
P (%)
14.3 15.6
4.4 8.7 16.4 22.2 34.5 37.5
16.5 14.1
14.8 15.2
17.8 11.8
11.8 14.5 16.9 14.8
12.6 20.4
Table 1. Socioeconomic and demographic characteristics of the population (%), prevalence of dyslipidemia (%),
Prevalence Ratio (PR), and 95% Confidence Interval (95% CI). VIGITEL, central-west Brazil, 2009.
P- value
0.40
<0.01*
0.11
0.79
<0.01
<0.01
<0.01
PR (CI 95%)
1 1.09 (0.89; 1.34)
1 1.96 (1.17; 3.30) 3.72 (2.27; 6.10) 5.03 (3.17; 8.01) 7.83 (4.87; 12.60) 8.51 (5.36; 13.54)
1 0.85 (0.70; 1.04)
1 1.03 (0.84; 1.25)
1 0.67 (0.54; 0.81)
1 1.23 (1.00; 1.51) 1.43 (1.16; 1.75) 1.25 (0.98; 1.59)
1 1.61 (1.32; 1.97)
aúd e C ole tiv a, 20(6):1815-1824, 2015 Discussion
The present study evidenced an increasing linear trend of dyslipidemia with age (p < 0.01) in cen-tral-west Brazil, with no difference in prevalence between female and male respondents. Excess weight and poor self-rated health were proximal variables directly associated with the outcome of interest. In addition, we found an inverse associ-ation of dyslipidemia with regular consumption of beans.
There scarce studies on the prevalence of dyslipidemia in the general population as well as in specific population groups in different mac-ro-regions in Brazil12. Most studies included small samples and used lipid profile to assess the prevalence of dyslipidemia13,14. Moreover, studies using self-reported data were conducted in very specific samples15,16.
The prevalence of dyslipidemia found in this study did not show any significant difference by gender, which corroborates the findings of the
Variables
Alcohol use No Yes
Excessive alcohol use No
Yes
Salt adding after meal preparation No
Yes
Physical activity ( last three months) No
Yes
Types of physical activity No Walking Running Weight training Gymnastics Soccer playing Other
Leisure-time physical Activity No
Yes
Watching TV No
Yes
Time spent watching TV (hour) No
< 1 – 3 > 3 Tobacco use
No Yes Cigarette/day
No 1 – 4 5 – 9
≥ 10
% 59.4 40.6 80.6 19.4 89.7 10.3 50.3 49.7 50.3 20.1 2.5 5.5 2.8 11.4 7.4 69.1 30.9 20.3 79.7 20.3 55.9 23.8 84.7 15.3 84.7 3.1 3.1 9.0 P (%) 15.5 14.2 15.1 14.3 14.9 15.8 16.0 13.9 16.0 18.0 19.4 10.6 15.8 5.2 16.1 16.5 11.6 12.0 15.7 12.0 16.1 14.8 15.3 13.5 15.2 12.6 6.4 16.0
Tabela 2. Lifestyle of the population, prevalence of dyslipidemia (%), Prevalence Ratio (PR), and 95%
Confidence Interval (95% CI). VIGITEL, central-west Brazil, 2009.
P-value 0.42 0.64 0.73 0.16 <0.01 <0.01 0.04 0.08 0.52 0.03
PR (CI 95%)
1 0.91 (0.73 – 1.14)
1 1.06 (0.83 – 1.35)
1 1.06 (0.75 – 1.51)
1 1.15 (0.94 – 1.41)
1 1.12 (0.92 – 1.37) 1.21 (0.78 – 1.89) 0.66 (0.44 – 0.98) 0.98 (0.67 – 1.45) 0.32 (0.18 – 0.59) 1.00 (0.60 – 1.68)
1 0.71 (0.54 – 0.89)
1 1.31 (1.01 – 1.68)
1 1.34 (1.04 – 1.72) 1.23 (0.87 – 1.73)
1 0.87(0.58 – 1.32)
P
e
r
e
ir
Framingham cohort study that reported sim-ilar risk ratios for total cholesterol in men and women17. It has not been well established wheth-er thwheth-ere is any diffwheth-erence in prevalence rates of dyslipidemia between men and women. Stud-ies of lipid profile found a higher prevalence in females18,19 while others have showed a higher prevalence in males14,20. It is noteworthy a high prevalence of dyslipidemia in menopausal wom-en21, possibly due to loss of hormone protec-tion22 during menopause23.
The prevalence of dyslipidemia increased lin-early with age. Several studies have confirmed an increased prevalence of comorbidities with ad-vancing age in both sexes, with many conditions co-occurring as age advances24-26.
In this study, after adjusting for potential confounding factors, the single lifestyle variable that remained associated with dyslipidemia was regular consumption of beans. We found a lower prevalence of dyslipidemia among respondents
who reported consuming beans at least five times a week, which supports the positive effect of beans on lipid profile. It is likely that soluble fiber found in beans help decrease blood cholesterol levels27. In view of these potential health bene-fits of beans it is important to encourage regular consumption of beans among Brazilian popula-tion, as there has been a dietary change and the Brazilian traditional diet based on rice and beans has been replaced with other foods28.
Our study evidenced a significant dose-re-sponse gradient between dyslipidemia and the magnitude of excess weight. Dyslipidemia was 49% more prevalent among overweight respon-dents than those with normal weight or under-weight, and 83% more prevalent in obese com-pared to the reference category. This association has been well documented in the literature29-30.
Self-rated health is a subjective perception of individuals regarding their own health with a physical and an emotional component31. We
Variables
Beans (≥ 5 days/week) No
Yes
Red meat (≥ 5 days/week) No
Yes
Red meat with fat No
Yes Chicken skin
No Yes
Regular consumption of fruits and vegetables (≥ 5 days/week)
No Yes
Recommended consumption of fruits and vegetables No
Yes
Soft drinks/processed juices (≥ 5 days/week) No
Yes Whole milk
No Yes
Out-of-home eating No
Yes
%
22.7 77.3
54.2 45.8
70.4 29.6
77.5 22.5
65.9 34.1
78.3 21.7
76.7 23.3
44.6 55.4
49.0 51.0
P (%)
19.1 13.7
15.9 13.8
15.8 13.0
15.4 13.5
13.9 16.9
14.6 16.2
16.5 8.3
16.3 13.8
16.1 13.9
Tabela 3. Food consumption (%), prevalence of dyslipidemia (%), Prevalence Ratio (PR), and 95% Confidence
Interval (95% CI). VIGITEL, central-west Brazil, 2009.
P-valor
<0.01
0.16
0.15
0.35
0.04
0.32
<0.01
0.11
0.14
PR (CI 95%)
1.38 (1.10; 1.75) 1
1 0.87 (0.71; 1.06)
1 0.83 (0.64; 1.07)
1 0.88 (0.66; 1.16)
0.82 (0.68; 0.99) 1
0.90 (0.73; 1.10) 1
1 0.60 (0.45; 0.78)
1 0.85 (0.69; 1.04)
aúd
e C
ole
tiv
a,
20(6):1815-1824,
2015
found a strong association between dyslipidemia and self-rated health; dyslipidemia was estimat-ed to be 56% more prevalent among those who rated their health as poor. This variable is be-lieved to be a good indicator of people’s lack of
health26, and a predictor of morbidity and mor-tality32.
One of the limitations of this study is its cross-sectional design that does not allow to in-ferring causality, and allowed simply to assessing
Tabela 4. Self-assessment of health status and weight status (%), Prevalence Ratio (PR), and 95% Confidence
Interval (95% CI). VIGITEL, central-west Brazil, 2009.
Variables
Self-rated health Very good Good Fair Poor Very poor Weight classification
Underweight/Normal Overweight
Obesity
%
20.5 47.9 26.4 4.2 0.9
59.7 30.3 10.0
P (%)
8.9 11.8 23.4 21.5 40.4
10.9 19.6 23.8
P-value
<0.01
<0.01
PR (CI 95%)
1 1.30 (0.93; 1.83) 2.60 (1.83; 3.67) 2.40 (1.31; 4.35) 4.48 (2.54; 7.91)
1 1.79 (1.43; 2.25) 2.18 (1.64; 2.91)
Level
1 – Sociodemographic variables Gender
Male Female Age(years)
18 – 24 25 – 34 35 – 44 45 – 54 55 – 64
≥ 65 2 – Lifestyle*
Bean consumption (≥ 5 day/week) Yes
No
3 – Weight classification**
Weight classification Underweight/Normal Overweight
Obesity
Self-rated health as poor No
Yes
PRad
1 1.06
1 1.97 3.72 5.03 7.82 8.49
1 1.32
1 1.49 1.83
1 1.56
Table 5. Adjusted Prevalence Ratios (PRad) and 95% Confidence Interval (95% CI) between dyslipidemia and
variables of the study. VIGITEL, central-west Brazil, 2009.
P-value
0.56
<0.01
0.01
<0.01 <0.01
<0.01
CI 95%
0.88 ; 1.27
1.17 ; 3.30 2.26 ; 6.10 3.16 ; 8.00 4.86 ; 12.6 5.34 ; 13.5
1.06 ; 1.65
1.20 ; 1.84 1.44 ; 2.31
1.15 ; 2.12
P
e
r
e
ir
factors associated with dyslipidemia. Another limitation is regarding consistency of self-report-ed data, which may lead to reporting bias and re-sult in either an underestimate or overestimate of the true prevalence. However, some studies com-paring self-reported and measured data found similar results5,33.
Key strengths of telephone-based surveys are the speed with which they can be conduct-ed and low-cost monitoring5. These surveys are valuable because they help map out the preva-lence of chronic diseases and can provide oth-er central information for rational planning of health services. Continuous monitoring of dys-lipidemias is crucial because on-the-spot health interventions such as nutritional counseling can effectively reduce high prevalences.
Kin-choku et al.34 assessed changes in lipid profile following nutritional counseling in individuals with dyslipidemia and found a reduction of up to 36% in lipids and lipoproteins because of this intervention.
Conclusions
aúd
e C
ole
tiv
a,
20(6):1815-1824,
2015
References
World Health Organization (WHO). Cardiovascular diseases. 2013. [acessado 2013 jun 10]. Disponível em: http://www.who.int/cardiovascular_diseases/en/ Brasil. Ministério da Saúde (MS). DATASUS. Informa-ções de Saúde. Banco de dados do Sistema Único de Saú-de-DATASUS. Brasília: MS; 2012. [acessado 2013 jul 7]. Disponível em: http://www.datasus.gov.br
Xavier HT, Izar MC, Faria Neto JR, Assad MH, Rocha VZ, Sposito AC, Fonseca FA, dos Santos JE, Santos RD, Bertolami MC, Faludi AA, Martinez T LR, Diament J, Guimarães A, Forti NA, Moriguchi E, Chagas ACP, Co-elho O R, Ramires JAF.V Diretriz Brasileira de Dislipi-demias e Prevenção da Aterosclerose. Arq Bras Cardiol 2013; 101(4 Supl. 1):1-20.
Sociedade Brasileira de Cardiologia. Sociedade Brasi-leira de Endocrinologia. II Consenso Brasileiro sobre dislipidemias. Detecção, avaliação e tratamento. Arq Bras Endocrinol Metab 1999; 43(4):287-305.
Francisco PMSB, Barros MBA, Segri NJ, Alves MCGP. Comparação de estimativas de inquéritos de base po-pulacional. Rev Saude Publica 2013; 47(1):60-68. Moura EC, Neto OL, Malta DC, Moura L, Silva NN, Bernal R, Claro RF, Monteiro CA. Vigilância de Fatores de Risco para Doenças Crônicas por Inquérito Telefô-nico nas capitais dos 26 estados brasileiros e no Dis-trito Federal (2006). Rev Bras Epidemiol 2008; 11(Supl. 1):20-37.
Brasil. Ministério da Saúde (MS). Departamento de Análise de Situação de Saúde. Vigilância de Fatores de Risco e Proteção para Doenças Crônicas por Inquérito Telefônico, Vigitel 2009. Brasília: MS; 2010.
World Health Organization (WHO). Physical status: the use and interpretation of anthropometry. Report WHO expert committee. Geneva: WHO; 1995. Onis M, Onyango AW, Borghi E, Siyam A, Nishida C, Siekmanna J. Development of a WHO growth refer-ence for school-aged children and adolescents. Bulletin of theWorld Health Organization 2007; 85(9):660-667. Lipschitz DA. Screening for nutritional status in the el-derly. Primary Care 1994; 21(1):55-67.
Victora CG, Huttly SR, Fuchs SC, Olinto MTA. The role of conceptual frameworks in epidemiological analysis: a hierarchical approach. Int J Epidemiol 1997; 26(1):224-227.
Krause MP, Hallage T, Miculis CP, Gama MPR, SSG. Análise do perfil lipídico de mulheres idosas em Curiti-ba - Paraná. Arq Bras Cardiol. 2008; 90(5):327-332. Oliveira A, Mancini FJ. Perfil nutricional e lipídico de mulheres na pós-menopausa com doença arterial coro-nariana. Arq Bras Cardiol 2005; 84(4):325-329. Nunes Filho JR, Debastiani D, Nunes AD, Peres KG. Prevalência de Fatores de risco cardiovascular em adul-tos de Luzerna, Santa Catarina, 2006. Arq Bras Cardiol 2007; 89(5):319-324.
Fernandes RA, Christofaro DGD, Casonatto J, Codog-no JS, Rodrigues EQ, Cardoso ML, Kawaguti S, Zanes-co A. Prevalência de dislipidemia em indivíduos fisica-mente ativos durante a infância, adolescência e idade adulta. Arq Bras Cardiol 2011; 97(4):317-323.
1.
2.
3.
4.
5.
6.
7.
8.
9.
10. 11.
12.
13.
14.
15. Collaborators
LP Pereira was involved in all stages of this re-search project: concept and design of the study, acquisition of data and data analysis, interpreta-tion of results and manuscript preparainterpreta-tion. R Si-chieri and RMVG da Silva helped with interpre-tation of results and review of the manuscript. NJ Segri help with data analysis and review of the manuscript. MG Ferreira was involved in the concept and design of the study, acquisition of data and data analysis, interpretation of results and manuscript preparation. All authors ap-proved the final version of the manuscript sub-mitted for publication.
Acknowledgments
P
e
r
e
ir
Malta DC, Oliveira MR, Moura EC, Silva SA, Zouain CS, Santos FP, Neto OLM, Penna GO. Fatores de risco e proteção para doenças crônicas não transmissíveis entre beneficiários da saúde suplementar: resultados do inquérito telefônico Vigitel, Brasil, 2008. Cien Saude Colet 2011 ; 16(3):2011-2022.
Ingelsson E, Schaefer EJ, Contois JH, McNamara JR, Sullivan L, Keyes MJ, Pencina MJ, Schoonmaker C, Wil-son PW, D’Agostino RB, Vasan RS. Clinical utility of di-fferent lipid measures for prediction of coronary heart disease in men and women. JAMA. 200; 298(7):776-785. Lessa I, Conceição JL, Souza ML, Oliveira V, Carneiro J, Melo J, Pinheiro J, Meireles F, Netto J, Reis F, Gou-vêa R, Couto M, Souza S, Oliveira MR. Prevalência de dislipidemias em adultos da demanda laboratorial de Salvador, Brasil. Arq Bras Cardiol 1997; 69(6):395-400. Kolankiewicz F, Giovelli FMH, Bellinaso ML. Estudo do perfil lipídico e da prevalência de dislipidemias em adultos. Rev. bras. anal. clin. 2008; 40(4):317-320. Luo J, Ma Y, Yu Z, Yang Y, Xie X, Ma X, Liu F, Li X, Chen B. Prevalence, awareness, treatment and control of dyslipidemia among adults in Northwestern China: the cardiovascular risk survey. Lipids in Health and Di-sease 2014; 13:4.
Phan BAP, Toth PP. Dyslipidemia in women: etiology and management. Int J Womens Health 2014; 6:185-194.
Edmunds E, Lip GYH. Cardiovascular risk in women: the cardiologist perspective. Q J Med. 2000; 93(3):135-145.
Mudali S, Dobs AS, Ding J, Cauley JA, Szklo M, Gol-den SH. Endogenous postmenopausal hormones and serum lipids: the atherosclerosis risk in communities study. J. Clin. Endocrinol. Metab. 2005; 90(2):1202-1209.
Humayun A, Shah AS, Alam S, Hussein H. Relationship of body mass index and dyslipidemia in different age groups of male and female population of Peshawar. J Ayub Med Coll Abbottabad 2009; 21(2):141-144. Iser BPM, Yokota RTC, Sá NNB, Moura L de, Malta DC. Prevalência de fatores de risco e proteção para doenças crônicas nas capitais do Brasil - principais resultados do Vigitel 2010. Cien Saude Colet 2012; 17(9):2343-2356.
16.
17.
18.
19.
20.
21.
22.
23.
24.
25.
Thorp AA, Owen N, Neuhaus M, Dunstan DW. Sed-entary behaviors and subsequent health outcomes in adults a systematic review of longitudinal studies, 1996-2011. Am J Prev Med 2011; 41(2):207-215. Bernaud FSR, Rodrigues TC. Fibra alimentar: ingestão adequada e efeitos sobre a saúde do metabolismo. Arq Bras Endocrinol Metab 2013; 57(6):397-405.
Sichieri R, Coitinho DC, Monteiro JB, Coutinho WF. Recomendações de alimentação e nutrição saudável para a população brasileira. Arq Bras Endocrinol Metab 2000; 44(3):227-232.
Sclavo M. Cardiovascular risk factors and prevention in women: similarities and differences. Ital Heart J Suppl 2001; 2(2):125-141.
Veghari G, Sedaghat M, Joshghani H, Banihashem S, Moharloei P, Angizeh A, Tazik E, Moghaddami A. Obe-sity and risk of hypercholesterolemia in Iranian north-ern adults. ARYA Atheroscler 2013; 9(1):2-6.
Szwarcwald CL, Souza-Júnior PRB de, Esteves MAP, Damacena GN, Viacava F. Socio-demographic deter-minants of self-rated health in Brazil. Cad Saude Publi-ca 2005; 21(1):54-64.
Latham K, Peek CW. Self-rated health and morbidity onset among late midlife U.S. adults. J Gerontol B Psy-chol Sci Soc Sci 2013; 68(1):107-116.
Conde WL, Oliveira DR, Borges CA, Baraldi LG. Con-sistência entre medidas antropométricas em inquéritos nacionais. Rev Saude Publica 2013; 47(1):69-76. Kinchoku H, Castanho VS, Danelon MRG, Faria EC de. Lipid and lipoprotein responses of dyslipidemic pa-tients to exclusive nutritional counseling by gender and age. Rev. Nutr. 2013; 26(2):215-224.
Article submitted 27/08/2014 Approved 27/10/2014
Final version submitted 29/10/2014 26.
27.
28.
29.
30.
31.
32.
33.