Happiness and Social Exclusion of Indigenous
Peoples in Taiwan - A Social Sustainability
Perspective
Jiun-Hao Wang*
Department of Bio-industry Communication and Development, National Taiwan University, Taipei, Taiwan, Republic of China
*wangjh@ntu.edu.tw
Abstract
Introduction
Happiness and social inclusion are important indicators of social sustainability, as recom-mended in the Sustainable Development Goals; however, little is known about the social sustainable development of ethnic minorities. To fill this knowledge gap, special attention is paid to understanding the issues of social exclusion and happiness in relation to the indige-nous peoples in Taiwan.
Methods
Data used were drawn from a nationwide representativeness survey of the Taiwanese In-digenous People in 2007; it included 2,200 respondents. This study employed binary logis-tic regression to examine the effects of different domains of social exclusion on the
likelihood of perceiving happiness; other exogenous factors, were controlled.
Results
The results show that among the respondents, mountain indigenous peoples, females, the elderly and those who are healthier, wealthier, highly educated, possessing western beliefs, and are more likely to be happy, compared to their counterparts. As expected, the results re-veal that the likelihood of being happy is higher for those who have received medical bene-fits, as well as those persons without housing problems or financial difficulties, compared to their excluded counterparts. However, no significant association is found between happi-ness and some social exclusion domains, such as child and youth benefits, and
unemployment benefits.
Conclusions
The disengagement of the indigenous peoples in mainstream society, with respect to the accessibility of welfare provisions, is a crucial element in regard to social exclusion and hap-piness. Several policy implications for the social sustainability of indigenous peoples can be
OPEN ACCESS
Citation:Wang J-H (2015) Happiness and Social Exclusion of Indigenous Peoples in Taiwan - A Social Sustainability Perspective. PLoS ONE 10(2): e0118305. doi:10.1371/journal.pone.0118305
Academic Editor:Peter James Hills, Bournemouth University, UNITED KINGDOM
Received:September 14, 2014
Accepted:January 14, 2015
Published:February 19, 2015
Copyright:© 2015 Jiun-Hao Wang. This is an open access article distributed under the terms of the
Creative Commons Attribution License, which permits unrestricted use, distribution, and reproduction in any medium, provided the original author and source are credited.
Data Availability Statement:All“Happiness and Social Exclusion of Indigenous Peoples in Taiwan”
files are available from the“Social Change and Policy of Taiwanese Indigenous Peoples Survey (TIPS)”
database. URL:http://tips.sinica.edu.tw/tips/plan_02. html#TIPS_P2_1.
inferred from these findings. For example, providing a mobile clinical tour, on-site health counseling, or homecare service can contribute to the removal of institutional and geo-graphic barriers to medical welfare provisions for the mountain indigenes. Moreover, the government may devote more welfare resources to assist indigenous families and tribal communities to develop their own social safety net, instead of the individual-oriented welfare provisions.
Introduction
Given the expressed concerns for social sustainability, the promotion of Sustainable Develop-ment Goals (SDGs) has achieved a broad consensus in the Rio+20 Earth Summit [1]. The Unit-ed Nations (UN) conference on sustainable development reachUnit-ed the conclusion that Bhutan’s Gross National Happiness (GNH) initiative had become a relevant pillar for social develop-ment policy [2]. In addition to happiness, achieving social inclusion for all is also an important indicator of social sustainability; this perspective will be recommended by the forthcoming post-2015 development agenda of the UN [1,3].
Although a considerable body of literature has examined the determinants of happiness of diverse groups in Taiwan, relatively little is known about the ethnic minorities’subjective well-being [4–7]. To fill this knowledge gap, special attention is paid herein to understanding the is-sues of happiness and institutional exclusion in regard to the social sustainable development of the indigenous peoples in Taiwan.
Societal progress has traditionally been measured in terms of general economic growth or Gross Domestic Product (GDP) per capita. Previous studies have addressed the negative im-pacts of the economic growth approach on sustainable development, including social inequali-ties, poverty, unhappiness and environmental degradation [8]. In contrast to the economic growth model, the Bhutanese GNH paradigm moves beyond GDP towards sustainable long-term social progress. The social progress approach of the GNH aims at enhancing spiritual wellbeing, environmental improvement and social equity, rather than just focusing on material living conditions [2,9]. Similarly, the United Nations Statistics Office should support countries to look beyond gross domestic product and propose the SDGs as a new developmental indica-tor to measure progress in human wellbeing. Given the spatial and environmental constraints inherent in the remote indigenous communities, any development policy which overempha-sizes economic performance, capital accumulation and productivity improvements will be problematic. Current trends within the indigenous development policy and practices, particu-larly development experiences of ethnic groups in Bhutan, the Maori in New Zealand and the Menominee in the USA, suggest that enhancing happiness and social inclusion is an appropri-ate approach for the indigenous peoples in remote areas [10]. Consequently, it is encouraging to observe the social progress made with regard to increasing indigenous peoples’subjective wellbeing and ensuring their access right to social welfare programs on a sustainable basis.
With regard to the current situation of the indigenous peoples in Taiwan, there are, in total, 530,000 indigenous peoples, accounting for 2.3% of the overall population; this ratio is similar to that of Australia or Canada [11,12]. Although there are 14 distinctive tribes officially recog-nized by the Council of Indigenous Peoples (CIP) in Taiwan, the indigenous groups are gener-ally divided into plains and mountain categories: Pingpu (Plains tribes) and Gaoshan
(Mountain tribes), based on their geographical distribution. The mountain aborigines account for 53% of all indigenous peoples; a quarter of them live in remote mountain areas [13]. Due to
analysis, decision to publish, or preparation of the manuscript.
the natural constraints of living in traditional territories, namely geographic remoteness, spatial isolation and high vulnerability to disasters, the mountain indigenous peoples are not only na-tional minorities, but also one of the most disadvantaged groups in Taiwan, in
socio-economic terms.
In addition, the life expectancy at birth and the unemployment rate for indigenous peoples were 70.1 years and 8.85%, respectively, in 2009. Compared to 79.0 years and 6.04% for other Taiwanese, i.e. the indigenous peoples have 9 years less in life expectancy at birth and 2.81% more in their unemployment rate, respectively, in data for 2009 [14]. Furthermore, the
socio-economic status of indigenous peoples is characterized by poverty, substance abuse, alco-holism, relative lower socio-economic status, political marginalization and suffering discrimi-nation in Taiwanese society [13]. For example, the remote indigenous mountain communities did not evenly share the benefits of economic growth in Taiwan over the past decades. Second, in their everyday life, they face challenging obstacles in regard to sustainable development, especially in their lack of infrastructure, poor access to welfare provisions, and insufficient edu-cation and job opportunities; these factors resulted in many social barriers imposed on indige-nous peoples in mountain areas. Consequently, it is evident that the social development issues and policies of indigenous peoples different from those of mainstream society.
In order to narrow the socio-economic gap between the indigenous peoples and the general population, the Taiwanese government has launched several specific social welfare and benefit programs for the indigenous peoples. The cash payments to indigenous peoples include old-age indigenes' welfare living allowance (for those old-aged 55–64 years), aid for emergencies con-fronting indigenes, scholarships for indigenous education development and tuition subsidies. Moreover, social benefits for indigenous peoples include: child care and teaching subsidies for indigenous children, school lodging and meal allowance for indigenous students, subsidies for employment and career plans, loans, National Health Insurance subsidies, medical allowance (i.e. transportation subsidies for those seeking medical advice), interest subsidies for building and repairing houses or for house rent and community reconstruction [14].
This paper focuses on the social dimensions of the indigenous people’s development. Special attention is paid to understanding their social exclusion and happiness or unhappiness. The objective of this study was twofold. First, a nationwide representativeness survey was used to investigate the sample distributions of the different domains of social exclusion and the happi-ness status of the indigenous peoples. Secondly, this study distinguished the extent to which different social exclusion status and socio-demographic characteristics are associated with the likelihood of perceiving happiness among the indigenous peoples. The remainder of this article is organized as follows. The next section briefly introduces the data used in this study. The fol-lowing section then presents an empirical model and the results obtained. The final section concludes this article with a brief summary and a discussion of policy implications.
Material and Methods
Data
respondents included 2,299 indigenous peoples aged 18–65. Data used in this study combined information derived from 2,057 respondents of the original survey and 242 observations of an additional survey in eastern Taiwan [15].
After deleting those with missing values in terms of key variables, such as social exclusion related items, 2,200 respondents remained for use in our analysis. The TIPS data include self-reported happiness and detailed social exclusion information, such as government provided in-kind benefits and cash payments due to economic difficulties and special social needs. In ad-dition to public welfare provisions, several variables representing the socio-demographic char-acteristics of the respondents were specified, including gender, age, education, income, religion, health status and residential area.
Measurement
Measure of happinessGiven that the attainment of happiness plays a crucial role in achieving the goals of social sus-tainable development [2], the concept of happiness used in this analysis concerns both overall judgments about the quality of life and life-as-a-whole. Happiness represents the subjective de-gree to which persons judge their entire life quality favorably, also known as overall happiness [16]. In the TIPS questionnaire, happiness was measured by the question:‘Taking all things to-gether, would you say you are, on the whole: Very happy, quite happy, fair, unhappy, or not at all happy?’(A 5-point Likert-type scale was coded from 1 = very happy, to 5 = not at all happy). Due to the low percentage of responses in the“not at all happy”category (3.0%), this study employed a dummy variable indicating whether the interviewees evaluate their overall perception of their life-as-a-whole quality. If they chose unhappy or not at all happy, it would be recorded in the unhappy category (= 0); others were recorded as happy (= 1).
Measures of social exclusion
The independent variable of particular interest in this study is social exclusion. Sen (2000) indi-cated that social exclusion refers to the processes in which marginalized groups are systemati-cally excluded from full participation in the society in which they live, especially being blocked from rights, opportunities and resources that are normally available to members of that society [17]. From the perspective of social sustainability, actions to combat social exclusion concen-trate on welfare provision, including: cash transfer, employment, healthcare, housing and other social services delivery. Thus, this study hypothesizes that the different excluded situations from social welfare benefits are associated with the happiness of the indigenous peoples.
Based on an institutional perspective, social exclusion can be recognized as the relationships with the main welfare agents, and the accessibility of welfare provisions, together with its gaps and failings [18]. For example, although the National Health Insurance program provides a universal right to healthcare for all Taiwanese, the indigenous peoples are often excluded from participation in healthcare programs or are unable to access medical benefits due to insufficient physicians and clinics in remote areas. Considering the institutional basis and dimensions of social exclusion [18,19], this study defines social exclusion as the lack of accessibility of differ-ent welfare provisions.
indicates whether the respondent has a need for specific welfare provision but cannot access the corresponding social services or benefits from the public sectors (= 1 if not received). De-tailed operational definitions of the social exclusion variable are presented inTable 1.
Measures of control variables
The recent World Happiness Report (2012) summarized the major findings of previous happi-ness studies and identified two types of determinants of happihappi-ness. The personal factors in-clude mental and physical health, family experience, education, gender and age. On the other hand, income, work, community and governance, and religion are some of the important exter-nal factors [2]. Since the primary research focus is on examining the relationship between so-cial exclusion and happiness of the indigenous peoples, this study selected several control variables as follows.
The socio-demographic variables include gender (= 1 if male), age (= 1 if aged over 55 years, the cut-off age at 55 is the requirement for applying for the Old-age Indigenes' Welfare Living Allowance in Taiwan) and educational level, categorized into several dummy variables (includ-ing elementary or lower, junior high school, senior high school, vocational school, and college or higher). Other health variables were identified as being well, including physical health status (= 1 if in good health), and having mental health problems (= 1 if one of the listed mental dis-order symptoms was chosen). Aside from socio-demographic variables, the external factors used in the empirical model are household income, defined as average monthly income (in-cluding salary, interest income and government subsidy, in NT$ 10,000 per month), religious beliefs, such as Protestantism, Catholicism, Buddhism, or other religion (= 1 if they chose one).
In addition to the abovementioned relevant external determinants, this study also controls for the residential variable, reflecting the remoteness and lifestyles of the indigenous peoples. All re-spondents were divided into three geographic regions according to the official documentation of the Council of Indigenous Peoples in Taiwan, namely, the remote mountain areas (refers to high and medium altitude mountain), highland areas (refers to low altitude mountains) and plains areas [20]. Detailed definitions and descriptive statistics of all variables are presented inTable 1.
Statistical analysis
Due to the happiness being documented as a binary variable (happy = 1; unhappy = 0), this study employs a binary logistic regression model to examine the effects of different domains of social exclusion on the likelihood of perceiving happiness, while controlling for individual socio-demographic characteristics and other exogenous factors, as shown in the following equation:
‘nð Probability of happiness
Probability of unhappinessÞ ¼ aþb1 12Social Exclusionþ b13 20
Personal factorsþ b21 25External factors þ e
Table 1. Definitions and summary statistics of regression variables (N = 2,200).
Variable Definition and measurement %
Happiness If the respondent self-reports as happy (= 1) 0.87
Social exclusion domains
Medical benefits
no need If the respondent has no need for any medical benefit (= 1), e.g., medical
care, health check, health counseling, National Health Insurance subsidies for indigenous peoples, etc.
0.23
not excluded If the respondent needs and receives medical benefits (= 1) 0.47 excluded If the respondent could not receive needed medical benefits (= 1) 0.30
Housing benefits
no need If the respondent has no need for housing benefits (= 1), e.g.,house
repair subsidy, rent subsidy, housing concessionary loan, etc. 0.24 not excluded If the respondent needs and receives housing benefits (= 1) 0.23 excluded If the respondent could not receive needed housing benefits (= 1) 0.53 Child and youth benefits
no need If the respondent has no need for child & youth benefits (= 1), e.g., child
care allowance, free lunch for low-income students, etc.
0.31
not excluded If the respondent needs and receives child & youth benefits (= 1) 0.28
excluded If the respondent could not receive needed child & youth benefits (= 1) 0.41 Senior benefits
no need If the respondent has no need for senior benefits (= 1), e.g., elderly home
care, meal delivery, old-age welfare living allowance, etc.
0.45
not excluded If the respondent needs and receives senior benefits (= 1) 0.15 excluded If the respondent could not receive needed senior benefits (= 1) 0.40
Unemployment benefits
no need If the respondent has no need for unemployment benefits (= 1), e.g.,
unemployment subsidy, employment assistance, vocational training etc. 0.62 not excluded If the respondent needs and receives unemployment benefits (= 1) 0.12 excluded If the respondent could not receive needed unemployment benefits (= 1) 0.26 Financial assistances
no need If the respondent has no need forfinancial assistance (= 1), e.g., aid for emergency for Indigenous Peoples, emergency assistance for livelihood, living support for low-income family, etc.
0.38
not excluded If the respondent needs and receivesfinancial assistance (= 1) 0.06
excluded If the respondent could not receive neededfinancial assistance (= 1) 0.56
Socio-demographic characteristics
Gender If the respondent is male (= 1) 0.44 Age(42.33±12.26) If the respondent’s age is under 55 years (= 1) 0.84
Educational level Elementary or
lower If graduated from elementary school or uneducated (= 1) 0.27 a
Junior high school If graduated from junior high school (= 1) 0.22 Senior high
school If graduated from senior high school (= 1) 0.13
Vocational school If t graduated from vocational school (= 1) 0.20 College or higher If graduated from college or higher (= 1) 0.18 Health status
Physical health If the respondent self-reports as healthy (= 1) 0.45 Mental health
Results and Discussion
Descriptive statistics of the sample characteristics
The sample statistics of the selected variables are presented inTable 1. Among the 2,200 re-spondents, of which 44% are male, with average age of 42.33 (SD±12.26), nearly half of them graduated from junior high school or below, 41% are Christian, and with average household in-come NT$ 42,000 (Taiwan Dollars) per month, equivalent to approximately USD 1,448. The self-reported health status of respondents is 45% and 23%, signifying good physical and mental conditions, respectively. It also shows that 53% of the respondents live in mountainous or highland area.
In regard to the social sustainability indicators, it is evident that the ratio of happy to unhap-py interviewees is 6.4 (86.5% vs. 13.5%). This result is in accordance with the previous findings of happiness studies in Taiwan [4,6,22,23]. Moreover, the situation of social exclusion varies in different domains of welfare provisions. Financial assistance and housing benefits are the most widely observed exclusion situations in this study. For those who need financial assistance and housing benefits but cannot receive welfare resource accordingly, the figures are 56% and 53%, respectively. In addition, the proportions of other domains of social exclusion, from low to high order are: 26%, 30%, 40% and 41% for unemployment, medical care, seniors, as well as child and youth benefits, respectively.
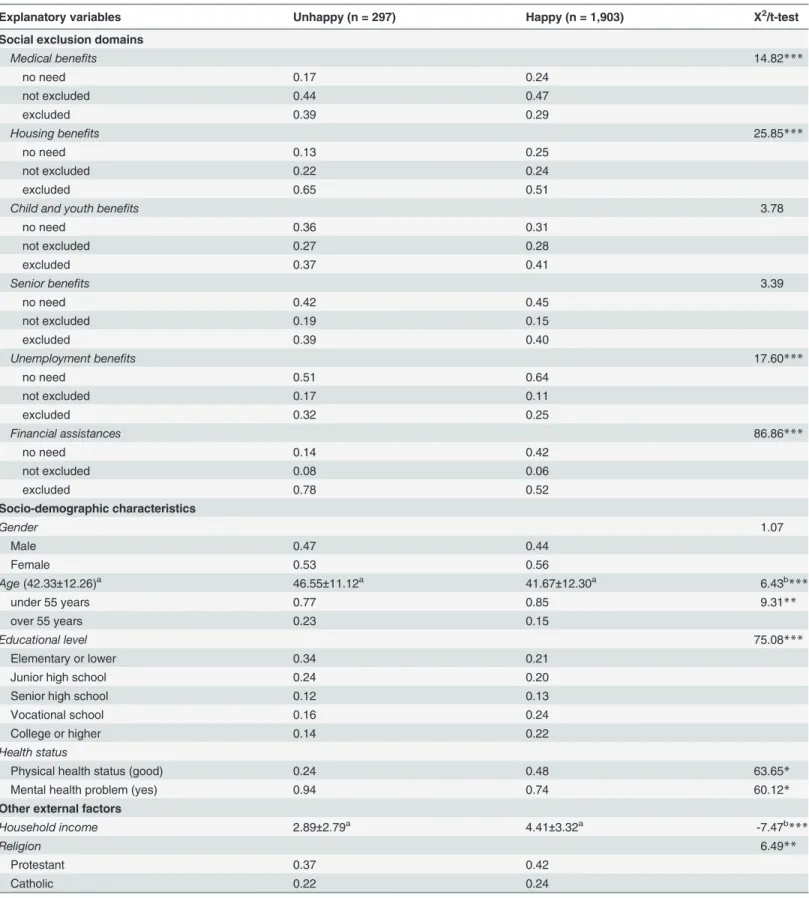
Group comparison between happy and unhappy indigenous peoples
A group comparison of happy and unhappy indigenous peoples is reported inTable 2. Based on the Chi-square and t-test results, most of the exogenous factors between happy and unhap-py groups were statistically significant (p<.001), except for gender. In general, those who self-reported as being happy (86.5%) were younger, more highly educated, richer, physically and mentally healthier, and with western beliefs, as compared with unhappy counterparts. The re-gional heterogeneity in perceived happiness is also statistically significant (p<.001).
Several significant differences of social excluded situations between these two subgroups can be found in the public support for medical, housing, unemployment and financial benefits
Table 1. (Continued)
Variable Definition and measurement %
Other external factors
Household income Average monthly income per household (NT$ 10,000) 4.20
±3.30
Religion
Protestant If the respondent is a Protestant (= 1) 0.41
Catholic If the respondent is a Catholic (= 1) 0.24
Buddhist or
others If the respondent is a Buddhist or other believer (= 1) 0.35 Geographic region
Remote mountain
area If the respondent lives in remote mountain area (= 1) 0.14 Highlands area If the respondent lives in highlands area (= 1) 0.39 Plains area If the respondent lives in plains area (= 1) 0.47
aSince each educational category is coded as a dummy variable, the value "0.27" means that 27% of respondents have graduated from elementary school or are uneducated.
Table 2. Group comparison between happy and unhappy indigenous peoples (N = 2,200).
Explanatory variables Unhappy (n = 297) Happy (n = 1,903) X2/t-test
Social exclusion domains
Medical benefits 14.82***
no need 0.17 0.24
not excluded 0.44 0.47
excluded 0.39 0.29
Housing benefits 25.85***
no need 0.13 0.25
not excluded 0.22 0.24
excluded 0.65 0.51
Child and youth benefits 3.78
no need 0.36 0.31
not excluded 0.27 0.28
excluded 0.37 0.41
Senior benefits 3.39
no need 0.42 0.45
not excluded 0.19 0.15
excluded 0.39 0.40
Unemployment benefits 17.60***
no need 0.51 0.64
not excluded 0.17 0.11
excluded 0.32 0.25
Financial assistances 86.86***
no need 0.14 0.42
not excluded 0.08 0.06
excluded 0.78 0.52
Socio-demographic characteristics
Gender 1.07
Male 0.47 0.44
Female 0.53 0.56
Age(42.33±12.26)a 46.55±11.12a 41.67±12.30a 6.43b***
under 55 years 0.77 0.85 9.31**
over 55 years 0.23 0.15
Educational level 75.08***
Elementary or lower 0.34 0.21
Junior high school 0.24 0.20
Senior high school 0.12 0.13
Vocational school 0.16 0.24
College or higher 0.14 0.22
Health status
Physical health status (good) 0.24 0.48 63.65*
Mental health problem (yes) 0.94 0.74 60.12*
Other external factors
Household income 2.89±2.79a 4.41±3.32a -7.47b***
Religion 6.49**
Protestant 0.37 0.42
Catholic 0.22 0.24
(p<.001). The happy group is less excluded from welfare provisions compared to their coun-terparts. Taking some social exclusion situations for example, the percentages of social exclu-sion for the happy group are: 29%, 51%, 25% and 52%, in accessing medical care, housing, unemployment and financial benefits, respectively. Similar patterns of social exclusion are also found among the unhappy samples. However, the unhappy respondents experienced more dif-ficulties in attempting to receive the abovementioned welfare provisions than their counter-parts did. The exclusions from receiving financial assistances and housing benefits programs are the first two problems for the unhappy group in accessing public support, which account for 78% and 65%, respectively. In contrast, there is no statistical difference between the happy and unhappy respondents with respect to senior, child and youth benefits.
The results inTable 2provide some preliminary evidence that happiness may differ among indigenous adults with different socio-demographic characteristics and those who are excluded from distinct welfare provisions. These conclusions, however, are not necessarily justified, inas-much as the possible differences in other exogenous factors between groups have not yet been controlled [24]. The following section further employs a binary logistic model to investigate the effects of social exclusion and other exogenous factors on the likelihood of
perceiving happiness.
Determinants of happiness of indigenous peoples
The primary focus of this empirical analysis is on the effect of social exclusion and other exoge-nous factors on the likelihood of being self-perceived as happy. The estimation results of a bi-nary logistic regression model of happiness are presented inTable 3. In addition to the six domains of social exclusion variables that indicate whether an indigenous person is excluded from accessing different welfare provisions, this study also controls for several variables reflect-ing the socio-demographic characteristics, physical and mental health status, and regional het-erogeneity. All explanatory variables used in the logistic regression models passed the
collinearity diagnostics by using the variance inflation factor test (all VIF<10) [25].
As exhibited inTable 3, the estimation results of the happiness equations show that females and older (over 55 years old) indigenous peoples are more likely to be happy compared to their counterparts (p<.005). Moreover, the likelihood of perceiving happiness is higher for those who are wealthier; a 1% point increase in monthly household income increases the likelihood of being happy by 0.047 percentage points (i.e. a marginal effect). The results also show that, compared to those who graduated from elementary school or lower (the reference group),
Table 2. (Continued)
Explanatory variables Unhappy (n = 297) Happy (n = 1,903) X2/t-test
Buddhist, or other 0.41 0.34
Geographic Region 12.53**
Remote mountain area 0.12 0.15
Highlands area 0.37 0.41
Plains area 0.51 0.44
*p<.05; **p<.01; ***p<.001;
aBrackets is the standard deviation; bT-test for continuous variable.
Table 3. Binary logistic regression on happiness of indigenous peoples (happy vs. unhappy) (N = 2,200).
Explanatory variables Coef. S.E. M.E. S.E. P-value
Social exclusion (ref.excluded) Medical benefits
no need 0.154 0.198 0.095 0.107 0.375
not excluded 0.295* 0.154 0.172 0.085 0.044
Housing benefits
no need 0.661*** 0.201 0.334 0.105 0.002
not excluded 0.162 0.167 0.084 0.091 0.358
Child and youth benefits
no need -0.192 0.166 -0.113 0.092 0.220
not excluded 0.008 0.170 0.007 0.093 0.943
Senior benefits
no need -0.132 0.160 -0.077 0.088 0.378
not excluded -0.409* 0.194 -0.248 0.107 0.021
Unemployment benefits
no need 0.136 0.161 0.076 0.089 0.396
not excluded -0.220 0.208 -0.126 0.118 0.284
Financial assistances
no need 0.980*** 0.195 0.512 0.098 <.0001
not excluded 0.052 0.248 0.019 0.139 0.892
Socio-demographic characteristics
Male(ref. female) -0.387** 0.139 -0.223 0.077 0.004
Age under 55 years(ref. over 55) -0.363* 0.162 -0.069 0.160 0.033 Education(ref. elementary or lower)
Junior high school 0.213 0.151 0.041 0.152 0.171
Senior high school 0.111 0.184 0.021 0.183 0.544
Vocational school 0.503** 0.162 0.098 0.160 0.001
College or higher 0.310* 0.171 0.062 0.170 0.477
Health status
Physical health status (ref. poor) 0.647*** 0.156 0.358 0.082 <.0001
Mental problem (ref. none) -1.398*** 0.266 -0.717 0.126 <.0001
Other external factors
Household income 0.095** 0.032 0.047 0.016 0.054
Religion(ref. Buddhist or other)
Protestant 0.351* 0.155 0.213 0.085 0.013
Catholic 0.397* 0.179 0.231 0.099 0.019
Geographic Region(ref. plains area)
Remote mountain area 0.531*** 0.152 0.104 0.154 0.001
Highlands area 0.274** 0.114 0.052 0.108 0.010
Intercept 1.816*** 0.379 1.016 0.197 <.0001
*p<.05; **p<.01; ***p<.001;
Coef. = coefficient; S.E. = standard error; M.E. = marginal effect;
Likelihood ratio of Chi-Square test = 241.19 (P-value<.001), reject Global Null Hypothesis (β= 0).
respondents who graduated from vocational school and college or higher education are more likely to be happy, by 9.8% and 6.2%, respectively. This socio-demographic difference in happi-ness is in accordance with previous findings [7,23,26] and suggests that raising occupational competence and income level can enhance subjective well-being, particularly for the poor group. Religion is also a significant factor. Compared with Buddhism or with other religious belief, the indigenous Protestants and Catholics are more likely to be happy by 21.3% and 23.1%, respectively.
Geographic region plays a relevant role in perceiving happiness. Those who reside in remote mountainous and highland areas are more likely to be happy compared to their counterparts, by 10.4% and 5.2%, respectively. This result may reflect the fact that the higher the mountain location, the closer to the traditional territory of indigenous peoples; therefore, they have more chance to con-tinue their aboriginal lifestyles. Perhaps this natural living circumstance and traditional way of life in mountainous areas lead them to be happier. With respect to health status, a positive association be-tween self-reported health and happiness is found. In accordance with the findings in Dockery (2010) [27], the results show that those who are self-reported as physically and mentally healthy are more likely to be happy compared to their counterparts, by 35.8% and 71.7%, respectively.
Finally, perhaps the most interesting finding is in regard to the effects of the social exclusion on happiness. As expected, the results reveal that the likelihood of being happy is higher for those who have received public medical benefits, as well as those without housing problems and financial difficulties, compared to their counterparts who are excluded from the above-mentioned welfare provisions. For instance, compared with respondents excluded from receiv-ing medical benefits (i.e. the reference group), those who successfully received medical benefits are 17.2% higher in being happy than their excluded counterparts. Similarly, those who do not need financial assistance are more likely to be happy than those excluded from financial assis-tance (marginal effect = 51.2%). These results are consistent with the social sustainability hy-pothesis, in that people are more likely to perceive self-happiness if they are integrated or included in the greater society [2,28]. However, no statistically significant association is found between happiness and some welfare domains of social exclusion, such as child and youth ben-efits, and unemployment benefits. Surprising, a negative relationship is evident between wheth-er or not one is excluded from senior benefits and the likelihood of being happy. This
undesired outcome may reflect the fact that the existing public senior benefits do not actually meet the practical needs of caring for the indigenous elders. Another possible explanation is that perhaps the senior respondents who are excluded from receiving welfare have found their own way to take care of family elders. As a result, those who have received public senior bene-fits are more likely to be unhappy than their excluded counterparts, by 24.8%.
Conclusions
Increasing happiness and reducing social exclusion are strongly recommended for realizing the Sustainable Development Goals of the UN [1,2,29]. Although extensive literature has exam-ined the factors that are associated with indigenous peoples’development, relatively little is known about their subjective wellbeing [20,30–32]. To narrow this knowledge gap, this paper employed the perspective of social sustainability to examine the effects of social exclusion, as well as personal and external determinants on the happiness of indigenous peoples in Taiwan. Using nationwide TIPS data in Taiwan, the empirical results show that socio-demographic characteristics, health-related factors and geographic region are significantly associated with indigenous people’s happiness.
empirical results suggest that health status and medical social exclusion are the most pro-nounced determinants of happiness. In addition, those who have no need for housing benefits and financial assistances are more likely to be happy, compared to their socially excluded coun-terparts. Surprisingly, an unexpected result finds that successfully receiving senior benefits has an adverse effect on happiness, compared to their excluded counterparts. Perhaps, this finding reflects the fact that the indigenous tribal solidarity and social network system may serve more active functions than public welfare agents in caring for the elders. Those who have a weak pri-vate support system for caring for tribal elders, and thus have to depend on public senior bene-fits, will perceive being less happy.
This study provides valuable insights into reshaping the indigenous development policy in Taiwan. Several policy implications for social sustainability of indigenous peoples can be in-ferred from these findings. First, since current social welfare provisions can just keep indige-nous peoples in minimal living conditions, rather than eliminating socio-economic and environmental disadvantages, the indigenous development policy might pay more attention to enhancing subjective wellbeing and strengthening social inclusion in the future. Moreover, since mountain indigenes tend to confront challenges in accessing medical healthcare resources associated with remoteness, as well as a lack of social agencies, providing a mobile clinical tour, free pick-up service for medical care, on-site health counseling, or home care service to moun-tain indigenes is an alternative which can remove institutional and geographic barriers of medi-cal welfare provisions. Additionally, the traditional tribal lifestyle is both an adaptation and reaction of the indigenous peoples to their daily life with environment constraints. It is crucial for the indigenous social policy to maintain or strengthen the traditional way of life. For in-stance, the family and community are often posited as an alternative to the delivery of social welfare provisions, as well as the major sources of pursuing happiness. Hence, the authorities may devote more welfare resources to assist indigenous communities to develop their own so-cial safety net, instead of relying merely on individual-oriented welfare provisions. Such family-and community-based supporting measures will help to reduce the social exclusion related to seniors, child and youth care, as well as employment in indigenous tribal areas.
Although some interesting findings are revealed in this study, some study limitations per-tain. Firstly, the Taiwanese Indigenous Peoples Survey only investigate the needs and reception status of specific social welfare packages, rather than individual items of social benefits received by indigenous peoples. It will be relevant to further investigate how different social welfare measures, such as in-kind benefits or cash payment, may determine the likelihood of perceiving self-happiness. Further data limitation is that the TIPS did not provide social network, lifestyle, or psychological factors of the indigenous peoples. Such social life conditions of the indigenous peoples are essential to show the robustness of this study’s findings. This issue could be better addressed if detailed information of separate welfare items and social lifestyle of respondents were available.
Acknowledgments
The author acknowledges the funding support from the National Science Counsel of Taiwan under Grant No: NSC 100–2621-M-002–017 and NSC 101–2621-M-002–009. The views ex-pressed herein are not necessarily those of the National Science Counsel in Taiwan. The author accepts responsibility for any errors or omissions.
Author Contributions
References
1. Sachs DJ. From millennium development goals to sustainable development goals. The Lancet. 2012; 379: 2206–2211. doi:10.1016/S0140-6736(12)60685-0PMID:22682467
2. Helliwell J, Layard R, Sachs J. World happiness report. New York: Columbia University; 2012.
3. SDSN (Sustainable Development Solutions Network). Indicators for sustainable development goals.
New York: Sustainable Development Solutions Network; 2014.
4. Liao PS, Fu YC, Yi CC. Perceived quality of life in Taiwan and Hong-Kong: an intra-culture comparison. J Happiness Stud. 2005; 6: 43–67.
5. Chang HH, Nayga RM. Childhood obesity and unhappiness: the influence of soft drinks and fast food consumption. J Happiness Stud. 2010; 11: 261–275.
6. Chang HH, Liao PA. Are immigrant wives happy in Taiwan? a look at the role of bargaining power within
the married couples. J Happiness Stud. 2014 Feb 08. doi:10.1007/s10902–014–9510-yPMID:
25332682
7. Huang CL, Wang JH. The effect of media-based leisure activities on happiness: a comparison of
Tai-wan and Japan. J Sport Recre Manag. 2014; 11: 1–18.
8. Stiglitz JE, Sen A, Fitoussi JP. The measurement of economic performance and social progress
revis-ited. Paris: Centre de recherche en Économie; 2009.
9. OECD (Organization for Economic Cooperation and Development) Compendium of OECD well-being indicators. Paris: Organization for Economic Cooperation and Development; 2011.
10. Groenfeldt D. The future of indigenous values: cultural relativism in the face of economic development. Futures. 2003; 35: 917–929.
11. ABS (Australian Bureau of Statistics). National aboriginal and Torres Strait islander social survey. New
South Wales: Australian Bureau of Statistics; 2008.
12. Canada Statistics. 2011 National household survey. Ontario: Statistics Canada; 2011.
13. CIP (Council of Indigenous Peoples). Health statistics of Taiwan indigenous peoples, Taipei: Council of Indigenous Peoples; 2013.
14. DGBAS (Directorate General of Budget, Accounting, Statistics). Social indicators. Taipei: Directorate
General of Budget, Accounting, Statistics; 2011.
15. Chang YH, Lin JP, Liu CC. Social change and policy of Taiwanese indigenous peoples. In: Chang YH,
Lin JP, Liu CC, editors. Government policy and social development among Taiwanese indigenous peo-ples. Taipei: Institute of Ethnology, Academia Sinica; 2010, pp. 583–635.
16. Veenhoven R. Measures of gross national happiness. In: OECD statistics, knowledge and policy:
mea-suring and fostering the progress of societies. Paris: OECD; 2007, pp. 231–253.
17. Sen A. Social exclusion: concept, application, and scrutiny, Social Development Papers. 2000; 1: 1–54. Manila: Asian Development Bank.
18. Evans M. Behind the rhetoric: the institutional basis of social exclusion and poverty. In: de Haan A, Maxwell S, editors. Poverty and social exclusion in North and South. Brighton: Institute of Develop-ment Studies. IDS Bulletin. 1998; 29: 42–49.
19. Ziyauddin KM, Kasi E. Dimensions of social exclusion: ethnographic explorations. UK: Cambridge Scholars Publishing; 2009.
20. CIP (Council of Indigenous Peoples) Economic status survey of indigenous peoples. Taipei: Council of
Indigenous Peoples; 2010.
21. SAS Institute Inc. SAS 9.2 user's guide. Cary, NC: SAS Institute Inc; 2009.
22. Lu L. Personal or environmental causes of happiness: a longitudinal analysis. J Soc Psychol. 1999; 139: 79–90. PMID:10074869
23. Chang WC. Social capital and subjective happiness in Taiwan. Int J Soc Econ. 2009; 36: 844–868.
24. Sirkin RM. Statistics for the social sciences. London: SAGE Publications; 2005.
25. Hair JF Jr, Anderson R, Tatham R, Black WC. Multivariate data analysis. Upper Saddle River, NJ: Prentice Hall; 1998.
26. Easterlin RA. Life cycle happiness and its sources: intersections of psychology, economics, and
de-mography. J Econ Psych. 2006; 27: 463–482.
27. Dockery AM. The subjective wellbeing of indigenous Australians. Australia, Curtin: The Centre for La-bour Market Research; 2010.
28. Colantonio A. Social sustainability: exploring the linkages between research. policy and practice. In: Jaeger CC, Tàbara JD, Jaeger J, editors. European research on sustainable development 1:
29. Islam N. Towards a sustainable social model: implications for the post-2015 agenda. New York: United Nations Department of Economic and Social Affairs; 2013.
30. Fetzer JS, Soper JC. The determinants of public attitudes toward the rights of indigenous peoples in Taiwan. Taiwan J Democr. 2011; 7: 95–114.
31. Hsu CT. The delivery of services to indigenous people in Taiwan. In: International conference of social
policy in an unequal world. UK: University of York; 2012.