www.nat-hazards-earth-syst-sci.net/12/61/2012/ doi:10.5194/nhess-12-61-2012
© Author(s) 2012. CC Attribution 3.0 License.
and Earth
System Sciences
Hardware-software system for simulating and analyzing
earthquakes applied to civil structures
J. P. Amezquita-Sanchez, R. A. Osornio-Rios, R. J. Romero-Troncoso, and A. Dominguez-Gonzalez
HSPdigital Research Group, C. A. Mecatr´onica, Facultad de Ingenier´ıa, Campus San Juan del R´ıo,
Universidad Aut´onoma de Quer´etaro, Moctezuma 249, Col. San Cayetano, 76807 San Juan del R´ıo, Quer´etaro, M´exico
Correspondence to:R. A. Osornio-Rios ([email protected])
Received: 11 October 2011 – Revised: 17 November 2011 – Accepted: 27 November 2011 – Published: 6 January 2012
Abstract. The occurrence of recent strong earthquakes, the incessant worldwide movements of tectonic plates and the continuous ambient vibrations caused by traffic and wind have increased the interest of researchers in improving the capacity of energy dissipation to avoid damages to civil struc-tures. Experimental testing of structural systems is essential for the understanding of physical behaviors and the building of appropriate analytic models in order to expose difficul-ties that may not have been considered in analytical studies. This paper presents a hardware-software system for exciting, monitoring and analyzing simultaneously a structure under earthquake signals and other types of signals in real-time. Effectiveness of the proposed system has been validated by experimental case studies and has been found to be a useful tool in the analysis of earthquake effects on structures.
1 Introduction
Recent strong earthquakes (e.g. Japan, Chile, and M´exico), the incessant worldwide movements of tectonic plates and the continuous ambient vibrations caused by traffic and wind have increased the interest of researchers in improving the capacity of energy dissipation to avoid damages to civil struc-tures (Dyke, 1998). In order to achieve this task, it is neces-sary to perform the simulation of structures under vibration loads. This is usually performed either experimentally or an-alytically. Experimental testing of structural systems is es-sential to understand physical behaviors and build appropri-ate analytic models in order to expose difficulties that may not have been considered in analytical studies (Jeyasehara et al., 2009).
Recently, structural simulators have gained impor-tance, particularly in countries vulnerable to destructive
earthquakes. A structural simulator is defined as a system capable of providing the most direct experimental pattern for the performance assessment of structures subject to earth-quakes or to any ground motion (Nakata, 2010). The general block diagram of a structural simulator is shown in Fig. 1. The exciter, typically a shaker, actuates on the structure, pro-ducing vibrations which are measured by sensors – generally accelerometers. Then, the monitored signal is analyzed by means of processing techniques such as FFT, wavelet, and others, in order to get the response of the structure in detail.
In order to excite a structure, several kinds of signals have been used as inputs for the shaker such as: recorded earth-quakes, synthetic signals, and ambient vibrations. Different works have proposed the use of earthquake signals to excite civil structures, due to the fact that it permits analysis of the structure behavior under real conditions (San Bartolome et al., 2004; Dolce and Cardone, 2006; Johnson et al., 2008; Van de Lindt and Potts, 2008; Kamanli and Balik, 2010). Synthetic signals are mainly used to obtain the modal param-eters of a structure and to determine its fatigue life; sinusoidal sweep or pure sinusoidal are the most widely used (Zivanovi´c et al., 2006; Dominguez et al., 2007; Ibrahim and Reynolds, 2008; Ersubasi and Korkmaz, 2010). Another kind of sig-nal frequently used to excite a structure is ambient vibration such as traffic and wind. As well as synthetic signals, am-bient vibration is used to obtain the modal parameters of a structure (Brownjohn et al., 2003; Ren et al., 2004). From the above stated, it is necessary to have a simulator capable of synthesizing or generating the three types of signals, so as to excite any kind of structure under different conditions.
Fig. 1.Structural simulator.
of the most widely used sensors for monitoring a structure during an excitation. An existing problem in several works is the quantity of test points that are simultaneously monitored. For instance, Zivanovi´c et al., 2006 proposed the monitor-ing of a lively steel box girder footbridge. The structure was tested in several points; however, the monitoring of the struc-tural response was only done by one accelerometer. This is considered unsuitable to know the behavior of the structure in detail. Conversely, aiming at observing the behavior of the structure in detail, simultaneous monitoring of several points is necessary. Therefore, the development of a system capable of monitoring concurrently several test points is considered essential.
Concerning the signal processing techniques used for ana-lyzing the response of a structure, several works are based on the fast Fourier transform (FFT) (Chen et al., 2005; Dolce and Cardone, 2006; Dominguez et al., 2007); the short time Fourier transform (STFT) (Dolce and Cardone, 2006; Nagarajaiah, 2009; Nagarajaiah and Basu, 2009); discrete wavelet transform (DWT) (Ovanesova and Su´arez, 2004), and the wavelet packet transform (WPT) (Sun and Chang, 2002; Han et al., 2005). Nevertheless, all these works present several disadvantages. First, they use two software programs, one for generating the signal that excites the structure and another for the analysis of the measured signal, which lim-its the software portability and the comparison between both signals. In addition, the lack of online processing and porta-bility of their systems is also observed. For these reasons, it would be desirable to have a versatile and portable system ca-pable of simultaneously generating, modifying, reproducing, and analyzing any kind of signal so as to be used in real-time structural analysis.
The contribution of this work is the design, development and implementation of a hardware-software system for ex-citing, monitoring, and analyzing civil structures simultane-ously. The proposed system is capable of synthesizing, gen-erating, modifying and controlling the three most common used signals such as earthquakes, ambient vibrations and synthetic signals to excite a structure. Moreover, the system has the ability to adapt the monitored signal to most of the commercial electrodynamic shakers. Additionally, the sys-tem has the potential for continuous and online monitoring to observe the real structure performance during an earthquake or any other excitation, as well as the signal analysis in one or several test points, concurrently. Another contribution of
this work is that the software is capable of analyzing the mea-sured signals through several techniques such as FFT, STFT, DWT, WPT, and their combination. The effectiveness of the proposed system is validated through different experimental cases, where earthquake signals, traffic effects, and synthetic signals are used to stimulate a truss-type scaled structure.
2 Theoretical background
This section presents the theoretical background of the pro-posed techniques for vibration analysis of structures. 2.1 FFT analysis
FFT is an optimized algorithm for performing the discrete Fourier transform (DFT), which is considered an efficient technique for analyzing stationary signals. DFT is defined by Eq. (1) (Proakis, 2006), wherex(n)is the discrete time sig-nal,N is the sampling period,nandkare the discrete time and frequency indexes, respectively, and the transformation kernelWNnkis given by Eq. (2).
X(k)= 1 N
N−1 X
n=0
x(n)WNnk for 0≤k≤N and 0≤n < N (1)
WNnk=cos
2nkπ N
+jsin
2nkπ
N
(2)
2.2 STFT analysis
STFT is a technique capable of analyzing non-stationary sig-nals. The basic idea of STFT is to apply FFT in sequence during short sampling periods. For each different time a dif-ferent spectrum is obtained and the totality of such spectra in-dicates the time-frequency distribution (Gurley and Kareem, 1999).
STFT is defined by Eq. (3), wherex(t )andh(t )are the signal to analyze and the window function, respectively, cen-tered at timeτ.
At(ω)=
1 √ 2π ∞ Z −∞
x(t )h(t−τ )e−j ̟ τdt (3)
The energy density spectrum at timeτ is therefore
PSP(t,ω)= |At(ω)|2 (4)
2.3 DWT analysis
the time scaling, andkis the shifting of the discrete wavelet functionh(n)through the input signalx(n).
DWTj,k=
X
N
x(n)hj,k(n) (5)
DWT is based on the Mallat algorithm (Mallat, 1999), which consists of high pass filter (HPF) and low pass filter (LPF) banks. According to the Mallat algorithm, the convolution of signal x(n) with the LPF is known as the approxima-tion level L(ACL ), and with the HPF is known as the de-tail level L(DCL); the first decomposition ofx(n)is known as level 1, and it is made of DC1and AC1that corresponds to the high-frequency and low-frequency components of the signal. The decomposition process continues on AC1, ob-taining the level 2 made of DC2and AC2that corresponds to the high-frequency and low-frequency components of AC1, respectively. Once the discrete input signalx(n)has been de-composed into theLdesired levels, the signal reconstruction is done by applying the decomposition process in an inverse way that is known as the inverse discrete wavelet transform (IDWT).
According to the DWT filter bank properties, the fre-quency band for an approximation ACLand a detail DCLis given by Eqs. (6) and (7), respectively, wherefs is the sam-pling frequency.
ACL⇒
0, fs
2L+1
(6)
DCL⇒
f
s 2L+1,
fs 2L
(7) 2.4 WPT analysis
WPT, like DWT, is a technique to decompose a signal re-peatedly into successive low-frequency and high-frequency components. Yet, in WPT both the detail and the approxima-tion coefficients are decomposed to create the full binary tree of band decomposition. The main advantage of using WPT over DWT is that it can provide uniform frequency bands; therefore, identifying more frequency components especially at high frequency is possible.
WPT is defined by Eq. (8), wherei,j andkare the mod-ulation, scale and translation parameters, respectively (Reda et al., 2006).
ψj,ki (t )=2j/2ψi(2jt−k), i=1,2,3,... (8) WPT is obtained through the next recursive equations, where
h(k),g(k)andψi are low-pass filter coefficients and
high-pass filter coefficients associated with the scaling function and the mother wavelet, respectively.
ψ2i(t )=√2
∞ X
k=−∞
h(k)ψi(2t−k) (9)
ψ2i+1(t )=√2
∞ X
k=−∞
g(k)ψi(2t−k) (10)
2.5 DWT/WPT combined with FFT analysis
Two promising techniques that have not been employed to analyze civil structures are the combination of DWT with FFT, and WPT with FFT. These techniques have provided good results on analyzing motors (Amezquita-Sanchez et al., 2010) and CNC machine tools (Rangel-Magdaleno et al., 2010); nonetheless, these techniques can be useful tools to analyze civil structures, earthquakes, etc.
The combination of these analysis techniques allows ob-serving the behavior of the signal throughout time and iden-tifying a characteristic frequency related to the reconstruc-tion of either DWT or WPT, without increasing the FFT fre-quency resolution (Rangel-Magdaleno et al., 2010). A spe-cific frequency band of interest is isolated by means of DWT or WPT, and the FFT is applied on the reconstruction level to identify the characteristic frequencies within this band.
3 Methodology
This section shows the methodology followed for the de-velopment of the hardware-software system, as well as its characteristics and capabilities. The general system, soft-ware methodology, and control system methodology are de-scribed.
3.1 Hardware-software system
The schematic diagram of the hardware-software system is shown in Fig. 2, in which the implemented system consists of six units: earthquake simulator software (ESS), control sys-tem (CS), primary actuator (PA), primary sensor (PS), signal conditioner (SC), and data acquisition system (DAS). The ESS unit generates and modifies the signal that will be used to excite the structure. In addition, this unit allows analyzing either the generated signal or the acquired signal. The CS unit stores and reproduces the generated signal by ESS unit. The PA unit includes a commercial linear amplifier, which receives and conditions the generated signal by the CS, and an electrodynamic shaker, which is fed by the conditioned signal to excite the structure. The system uses multiple ac-celerometers as PS for measuring the acceleration simulta-neously in one or several test points of the structure. Finally, the DAS unit acquires and stores all the measured signals by the sensors, conditioned and amplified by the SC unit; then, these signals are sent to the ESS unit for their analysis. 3.2 ESS methodology
Fig. 2.Proposed methodology flow diagram.
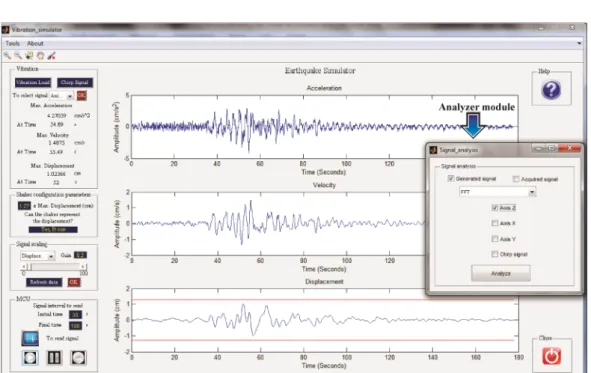
Fig. 3.ESS unit.
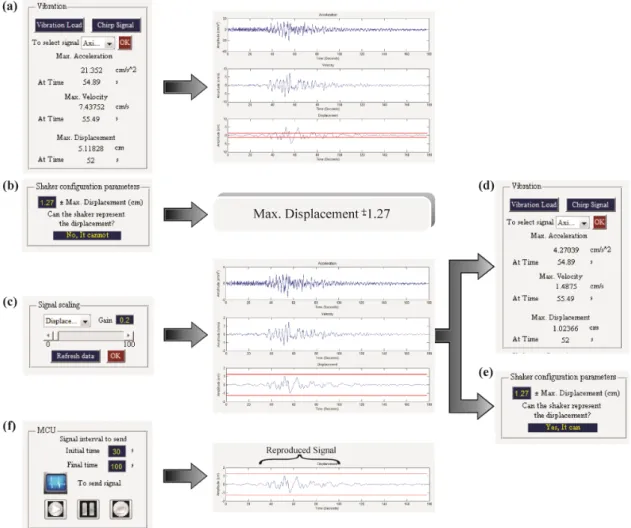
The simulator module is the main window, which appears when the program starts. The module is based on four stages: vibration, shaker configuration parameters, signal scaling, and master control unit (MCU). Figure 4 shows the overall process, depicted as follows:
a. Vibration. This stage generates or loads a signal that will be reproduced by the shaker. Earthquakes, syn-thetic signals, and ambient vibrations can be synthe-sized or generated by this stage. First, the push but-ton “Vibration load” is used to load the data from either earthquake accelerations or ambient vibrations such as traffic, wind, etc. In addition, a synthetic signal with certain characteristics can be generated by the push but-ton “Chirp Signal”. Next, by means of a popup menu, the desired signal is selected. This popup menu was de-veloped because in several cases the data loaded from
a text file contains horizontal (axes X and Y) and verti-cal (axis Z) accelerations. Then, the parameters of the shaker are set, this with the purpose of comparing the maximum displacement generated by the signal and the “max displacement” that can be represented by shaker. Finally, the push button “OK” is used to show the gen-erated or loaded signal in the interface. Simultaneously, some characteristics of the signal such as “max accel-eration”, “max velocity” and “max displacement” are displayed (Fig. 4a).
Fig. 4.Simulator module.
cases of this research, the displacement parameter was set to±1.27 cm.
c. Signal scaling. This stage scales the signal in amplitude (Fig. 4c). First, the signal to be scaled is selected by means of a popup menu (acceleration, velocity or dis-placement). Next, a gain is established, which is mul-tiplied by original signal to obtain the scaled signal. In order to display the scaled signal in the interface, it is necessary to press the push button “Refresh data”. Si-multaneously, “max acceleration”, “max velocity” and “max displacement” are updated in the first stage (Vi-bration) (Fig. 4d). The Shaker configuration parameter (second stage) is updated (Fig. 4e) as well. This pro-cess is repeated until the user obtains the desired scaled signal. Finally, when the user observes a desired scaled signal, the push button “OK” has to be pressed to update the signal that will be sent to control system.
d. MCU. This stage sends and controls the signal that will be reproduced by the shaker. First, the range of sig-nal that will be reproduced is selected. After, when the user selects a desired region of the signal, the push but-ton “To send signal” is used to send the signal to control system unit (Fig. 4f). In order to easily control the signal that will be reproduced by the control system unit, three push buttons “Play”, “Pause”, and “Stop” are used. The push button “Play” allows the reproduction of the gen-erated signal in the interface. The push button “Pause” allows the user to pause the reproduction of the signal. Finally, the push button “Stop” allows the user to stop the reproduced signal.
various nodes (Zeng et al., 2008). Thus, it is necessary to determine the corresponding relationship between nodes of decomposition tree and frequency bands of signal subspace. A simple methodology to solve this problem was proposed by Zeng et al. (2008), which is implemented in the “Analyzer module”. When the user chooses either WPT or WPT-FFT, the software automatically selects the appropriate node ac-cording to the chosen scale and frequency. The use of this module, by selecting WPT-FFT, is shown in Fig. 5. The se-lected options for this example in the “analyzer module” are: Earthquake of M´exico 1985 as generated signal, WPT-FFT analysis, vertical acceleration (Axis Z), and 10 and 0.5 Hz for scale and frequency, respectively.
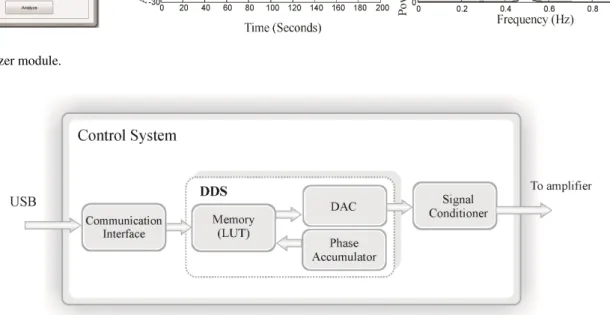
3.3 Control system methodology
The control system (CS) unit is based on the digital direct synthesis (DDS) technique (Romero-Troncoso and Espinosa-Flores, 1999). Depicted in Fig. 6, the CS unit is composed of five modules: communication interface (CI), dynamic memory, phase accumulator (PA), digital-analog-converter (DAC), and signal conditioner (SC). The CI re-ceives the generated data from the EES unit by means of USB interface. Concurrently, the received data is stored in dy-namic memories to form a look-up table (LUT). PA includes two stages, an adder and a register, which are in charge of re-producing the stored data to a desired frequency. Finally, the reproduced data is sent to DAC to generate the analog signal, which in turn is conditioned to feed the linear amplifier.
The output frequency of the phase accumulator is given by Eq. (10), in whichfois the output frequency,fclkthe clock frequency,nthe number of bits andNvaries from 0 to 2n−1 to set the desired frequency.
fo=
N
2nfclk (11)
4 Experimentation
In this section, the experimental setup and the cases of study for validating the proposed system are presented.
4.1 Experimental setup
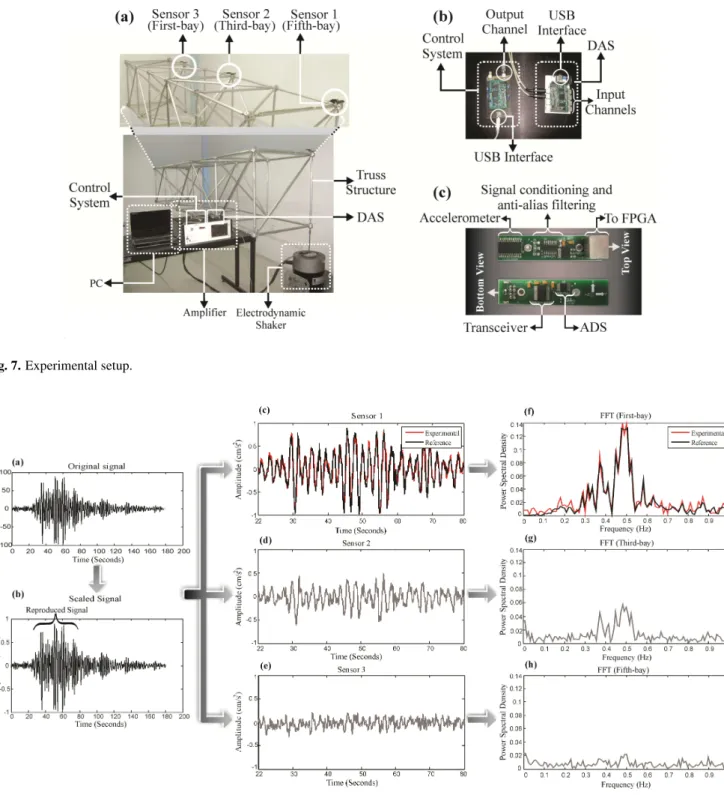
The experimental setup is shown in Fig. 7a; it consists of a five-bay space truss structure made of aluminum. Each as-sembled bay is a 707 mm cube-shaped structure. The test benches were performed using a Labworks Model ET-127 electrodynamic shaker as an excitation source, which can re-produce maximum±1.27 cm of displacement, powered by a Labworks Model PA-141 linear power amplifier. The am-plifier is fed by a proprietary control system, which has a high-speed 14-bit digital-to-analog converter DAC2904 from Texas Instruments (Fig. 7b). Depicted in Fig. 7a, struc-tural acceleration responses were measured using three tri-axial accelerometers LIS3L02AS4 from STMicroelectronics
mounted on top of first-bay (Sensor 1) third-bay (Sensor 2) and fifth-bay (Sensor 3), which aims at concurrently monitor-ing its behavior at different parts. The used accelerometers have a bandwidth of 750 Hz, a user-selectable full scale of ±2 g/±6 g (g=9.81 m s−2)and a 5×10⁻⁴resolution over a 100 Hz bandwidth. Accelerometer information is digitalized using 12-bit 4-channel ADS7841 ADC from Texas Instru-ments, with a maximum sampling rate of 200 kHz for the four channels (Fig. 7c). Digital data acquisition was per-formed using a portable proprietary DAS; this system has eight input channels (Fig. 7b). The sampling frequency of the DAS system is set to 3.2 kHz. A proprietary Spartan 3E XC3S1600E FPGA platform running at 48 MHz as the con-trol system and DAS unit is used.
4.2 Case studies
The experimentation has three main objectives: firstly, to show the usefulness of ESS software to synthesize, gener-ate and modify earthquake signals or any other excitation; secondly, to show that the system has the ability to concur-rently monitor several test points of the structure; and thirdly, to show that the system is capable of analyzing the moni-tored signals by means of different techniques proposed in the EES software such as FFT, STFT, DWT, WPT, WPT-FFT and DWT-FFT.
In order to validate the effectiveness of the proposed hardware-software methodology, three experiments were performed. The first case of study focuses on the use of earth-quakes signals. The next two cases of study allow observing the efficiency of the proposed system to generate or synthe-size other types of signals such as ambient vibrations and synthetic waveforms. All experiments were carried out in a healthy truss structure.
In the first experiment, the earthquakes of M´exico 1985 and Loma Prieta, California 1989, are used for exciting and analyzing the behavior of the structure during these excita-tions.
In the second experiment, an ambient vibration caused by traffic is used for exciting the structure. The used vibration was on-line monitored through two tri-axial accelerometers mounted onto a rigid bridge (Fig. 10a). The replication of these types of events in scaled structures is essential because it allows the user to observe the structural behavior during everyday situations.
Fig. 5.Analyzer module.
Fig. 6.Control system unit.
5 Results
In this section, the results of the proposed experimentation are presented. Also, the main advantages of the proposed system are discussed.
5.1 Earthquakes
Following the proposed methodology, the recorded accelera-tion of the earthquake in Mexico 1985 is loaded in the ESS (Fig. 8a). Then, the loaded signal is scaled to 0.97 cm s−2 maximum acceleration, 0.3836 cm s−1 maximum velocity and 0.18 cm maximum displacement. Additionally, the re-gion with the maximum accelerations, 22 to 80 s (Fig. 8b), is selected to be reproduced by the shaker. The structural response of the first-, third- and fifth-bays are concurrently sensed (Fig. 8c–e). With the purpose to show the behavior of the structure during the excitation, FFT is selected for analyz-ing the measured vertical acceleration. Depicted in Fig. 8f– h, the measured time-domain signals are processed to obtain the FFT of the signals. The results show a static analysis of the structural response, where it is possible to identify the induced frequencies by the earthquake.
Alike the previous case, the recorded acceleration of the earthquake in Loma Prieta, California 1989, is loaded in the ESS (Fig. 9a). The loaded signal is scaled to 5.395 cm s−2 maximum acceleration, 0.7461 cm s−1 maximum velocity
and 0.15 cm maximum displacement. Furthermore, the re-gion with the maximum accelerations, 9 to 19 s (Fig. 9b), is selected to be reproduced by the shaker. As in the previous case, the structural response of the first-, third- and fifth-bays are concurrently sensed (Fig. 9c–e). STFT with a window of time duration 0.7 s is selected to analyze the measured verti-cal acceleration. Depicted in Fig. 9f–h, STFT allows observ-ing the structural response throughout time, where a main frequency component, caused by the earthquake, is clearly observed.
In both case studies, the reproduced signal is compared with the experimental signal, demonstrating that the system is capable of exciting the structure with same characteris-tics of the generated signal by the ESS unit (Fig. 8c, f and Fig. 9a).
5.2 Ambient vibration
Fig. 7.Experimental setup.
Fig. 8.Earthquake in M´exico 1985.
first-, third- and fifth-bays are concurrently sensed (Fig. 10c– e). DWT and WPT are selected for analyzing the moni-tored vertical accelerations. In addition, Daubechies (db4) is used as mother wavelet; due to that, db4 is the most suitable wavelet mother to decompose acceleration signals (Taha, 2010).
Fig. 9.Earthquake in Loma Prieta, California 1989.
signal to obtain the decomposition and reconstruction of the signal. The reconstructed wavelet signals allow observing the structural response throughout time, where the caused frequencies by traffic are clearly identified in this frequency band. Like in the previous test, the reproduced signal is com-pared with the experimental signal (Fig. 10c), where it is pos-sible to observe that the system is capable of reproducing the signal generated by the ESS unit with great accuracy. 5.3 Synthetic signal
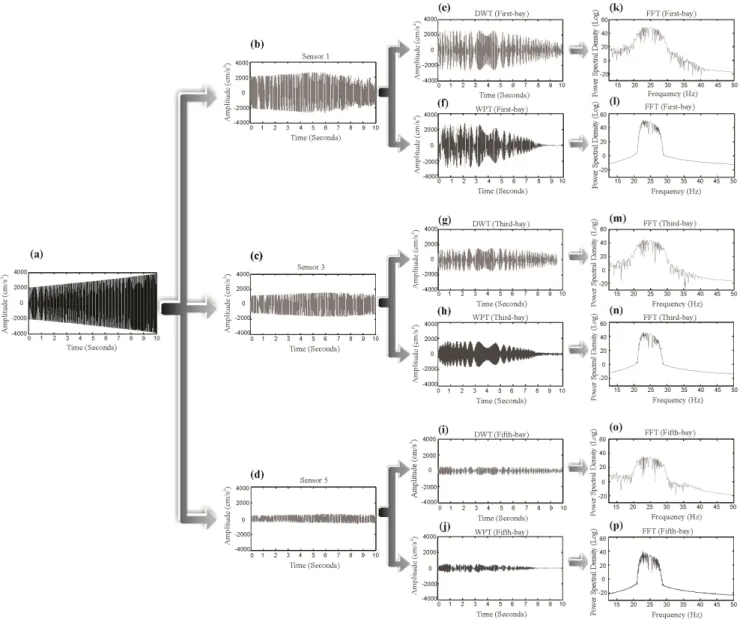
Unlike the two previous experiments, the tool “Chirp signal” was used to generate the exciter signal. The generated sig-nal has the following characteristics: 10 KHz sampling fre-quency, 10 s running time for the experiment, 3900 cm s−2 maximum acceleration, 20.72 cm s−1maximum velocity and 0.11 cm maximum displacement; therefore, the scaling is not necessary. Like the previous test, the structural response of the first-, third- and fifth-bays are concurrently sensed (Fig. 11b–d). To analyze the behavior of the structure, WPT-FFT and DWT-WPT-FFT are selected for analyzing the measured vertical acceleration. Similar to previous experiment, db4 is used as mother wavelet in both DWT-FFT and WPT-FFT analysis.
For this experiment, the region of interest lies below 26 Hz; therefore, the recommended decomposition level for DWT is DC7 with an active frequency band from 12.5 to
25 Hz, and for WPT is [9 4] with an active frequency band from 21.875 to 25 Hz. Once the decomposition level for DWT and the node for WPT have been established, the time-domain signal is processed to obtain the decomposition and reconstruction of the signal, which are shown in Fig. 11e–j. In both cases, the result wavelet contains the time evolution of the natural frequency of the structure, and to locate this frequency, the FFT is applied to obtain the spectrum, where a natural frequency is clearly appreciated (Fig. 11k–p). 5.4 Methodology comparative
In order to validate the main advantages of the proposed sys-tem to other similar used syssys-tems, a comparison of the main features is shown in Table 1.
Fig. 10.Ambient vibration.
by means of different analysis techniques. In addition, they do not allow introducing or synthesizing a signal; thus, earthquake signals and ambient vibrations cannot be repro-duced (Reynolds and Pavic, 2002; Zivanovi´c et al., 2006 and Ibrahim and Reynolds, 2008). Secondly, the monitoring of several test points concurrently is not performed (Zivanovi´c et al., 2006). Third, the use of two software programs, one for generating the signal that excites the structure and another for the analysis of the measured signal, means portability of the system is not possible (Dominguez et al., 2007).
Fig. 11.Synthetic signal.
Table 1.Features comparison between the proposal and reported works.
Work Generate Modify Monitor Multiple One system for Portability
multiple signals multiple test techniques of generating, monitoring
signals points analyzing and analyzing
Reynolds and Pavic (2002) YES NO YES NO YES YES
Zivanovi´c et al. (2006) YES NO NO NO YES YES
Dominguez et al. (2007) YES NO YES NO NO NO
Ibrahim and Reynolds (2008) YES NO YES NO YES YES
6 Conclusions
Earthquakes are seismic waves that cause the greatest catas-trophes: human, economic and structural. Therefore, it is necessary to have a system capable of analyzing, monitoring and reproducing them. Seismic hazard analysis is one of the most important processes for earthquake safety assessment of structures and the designing of earthquake resistant struc-tures.
This paper proposes a hardware-software system for ex-citing, monitoring and analyzing simultaneously a structure under earthquakes, ambient vibrations and synthetic signals in real-time. The proposed system has different tools to gen-erate and to modify the different signals either gengen-erated or acquired, as well as their analysis by means of several analy-sis techniques such as FFT, STFT, DWT, WPT, DWT-FFT and WPT-FFT. Three experiments have been presented in this work. In the first experiment, the system proves to be a useful tool to synthesize, modify and reproduce real earth-quake signals with great accuracy, which is fundamental in the analysis and design of structures. The second and the third experiment are carried out to show the efficiency of the system to generate or to synthesize other types of sig-nals such as ambient vibration and synthetic sigsig-nals, aiming at knowing other characteristics like natural frequencies.
The proposed system is a useful tool in the analysis of earthquake effects on structures in order to help the improve-ment of its performance, resistance, design, and life service. In addition, it has tools to generate other types of signals for calculating other structure characteristics, showcased in the developed experiments. Furthermore, the feature compari-son between the proposed system and other reported works highlights the advantages of using the proposed system.
Acknowledgements. This project was partially supported by CONACyT scholarship 213849 and SEP-CONACyT 84723 project.
Edited by: M. E. Contadakis
Reviewed by: A. Garcia-Perez and another anonymous referee
References
Amezquita-Sanchez, J. P., Cabal-Yepez, E., Romero-Troncoso, R. J., Osornio-Rios, R. A., and Garcia-Perez, A.: Determination of system frequencies in mechanical systems during shutdown transient, J. Sci. Ind. Res., 69, 415–421, 2010.
Brownjohn, J. M. W., Moyo, P., Omenzetter, P., and Lu, Y.: As-sessment of highway bridge upgrading by dynamic testing and finite-element model updating, J. Bridge Eng., 8, 162–172, 2003. Chavez, O., Millan-Almaraz, J. R., P´erez-Enr´ıquez, R., Arzate-Flores, J. A., Kotsarenko, A., Cruz-Abeyro, J. A., and Rojas, E.: Detection of ULF geomagnetic signals associated with seismic events in Central Mexico using Discrete Wavelet Transform, Nat. Hazards Earth Syst. Sci., 10, 2557–2564, doi:10.5194/nhess-10-2557-2010, 2010.
Chen, B., Xu, Y. L., and Qu, W. L.: Evaluation of atmospheric corrosion damage to steel space structures in coastal areas, Int. J. Solids Struct., 42, 4673–4694, 2005.
Dolce, M. and Cardone, D.: Theoretical and experimental studies for the application of shape memory alloys in civil engineering, J. Eng. Mater. Technol., 128, 302–311, 2006.
Dominguez, A., Sedaghati, R., and Stiharu, I.: Modeling and ap-plication of MR dampers in semi-adaptive structures, Comput. Struct., 86, 407–415, 2007.
Dyke, S. J.: Design and development of the Washington University seismic simulator facility, in: Proc. 12th Eng. Mech, ASCE, San Diego, 762–765, 1998.
Ersubasi, F. and Korkmaz, H. H.: Shaking table tests on strength-ening of masonry structures against earthquake hazard, Nat. Hazards Earth Syst. Sci., 10, 1209–1220, doi:10.5194/nhess-10-1209-2010, 2010.
Gurley, K. and Kareem, A.: Applications of wavelet transforms in earthquake, wind and ocean engineering, Eng. Struct., 21, 149– 167, 1999.
Han, J. G., Wei-Xin Ren, W. X., and Sun, Z. S.: Wavelet packet based damage identification of beam structures, Int. J. Solids Struct., 42, 6610–6627, 2005.
Ibrahim, Z. and Reynolds, P.: Modal testing of a cantilever grand-stand, in: International conference on construction and build-ing technology (ICCBT2008), 16–20, Kuala Lumpur, Malaysia, 2008.
Jeyasehara, C. A., Kumarb, K. S., Muthumanib, K., and Laksh-mananb, N.: Seismic performance evaluation methodologies for civil engineering structures, Indian J. Eng. Mater. Sci., 16, 220– 228, 2009.
Johnson, R., Padgett, J. E., Maragakis, M. E., DesRoches, R., and Saiidi, M. S.: Large scale testing of nitinol shape memory alloy devices for retrofitting of bridges, Smart Mater. Struct., 17, 1–10, 2008.
Kamanli, M. and Balik, F. S.: The behaviour of roof gable walls under the effect of earthquake load, Nat. Hazards Earth Syst. Sci., 10, 251–263, doi:10.5194/nhess-10-251-2010, 2010.
Mallat, S.: A Wavelet tour of signal processing, 2nd Edn., Aca-demic Press, 1999.
Nagarajaiah, S.: Adaptive passive, semiactive, smart tuned mass dampers: identification and control using empirical mode de-composition, hilbert transform, and short-term fourier transform, Struct Contr Health Monit., 16, 800–841, 2009.
Nagarajaiah, S. and Basu, B.: Output only modal identification and structural damage detection using time frequency and wavelet techniques, Earthq. Eng. Eng. Vib., 8, 583–605, 2009.
Nakata, N.: Acceleration trajectory tracking control for earthquake simulators, Eng. Struct., 32, 2229–2236, 2010.
Ovanesova, A. V. and Su´arez, L. E.: Applications of wavelet trans-forms to damage detection in frame structures, Eng. Struct., 26, 39–49, 2004.
Proakis, J. G. and Manolakis, D. K.: Digital Signal Processing, Principles and Applications, Fourth Edition, Prentice-Hall, New Jersey, USA, 2006.
Reda, M. M., Noureldin, A., Lucero, J. L., and Baca, T. J.: Wavelet transform for structural health monitoring: A compendium of uses and features, Struct. Health. Monit., 5, 267–295, 2006. Ren, W. X., Tong Zhao, T., and Harik, I. E.: Experimental and
analytical modal analysis of steel arch bridge, J. Struct. Eng., 130, 1022–1031, 2004.
Ren, W. X., Peng, X. L., and Lin, Y. Q.: Experimental and analytical studies on dynamic characteristics of a large span cable-stayed bridge, Eng. Struct., 27, 535–548, 2005.
Reynolds, P. and Pavic, A.: Modal testing of a sport stadium, in: Proc. of the 20th. International Modal Analysis Conference (IMAC XX), Los Angeles, California, USA, 1037–1043, 2002. Romero-Troncoso, R. J. and Espinosa-Flores, G.: Phase
accumula-tor synthesis algorithm for DDS applications, Electron. Lett., 35, 770–772, 1999.
San Bartolome, A., Quiun, D., and Zegarra, L.: Effective sys-tem for seismic reinforcement of adobe houses, in: 13th World conference on Earthquake Engineering, 3321, Vancouver, B.C., Canada, 2004.
Sun, Z. and Chang, C. C.: Structural damage assessment based on wavelet packet transform, J. Struct. Eng., 128, 1354–1361, 2002. Taha, M. M. R.: A neural-wavelet technique for damage identifica-tion in the ASCE benchmark structure using phase II experimen-tal data, Adv. Civ. Eng., doi:10.1155/2010/675927, 2010. Van de Lindt, J. W. and Potts, A.: Shake table testing of a
Superelas-tic Shape Memory Alloy response modification device in a wood shearwall, J. Struct. Eng., 134, 1343–1352, 2008.
Zeng, X., Zhao, W., and Sheng, J.: Corresponding relationships between nodes of decomposition tree of wavelet packet and fre-quency bands of signal subspace, Acta Seismol. Sin., 21, 91–97, 2008.